Ad hoc reporting and analysis help enterprise teams answer urgent, high-stakes business questions without waiting for the next scheduled dashboard, analyst backlog, or manual spreadsheet cycle. When a sales leader asks why revenue dropped in one region, when an operations director needs to isolate a supply chain delay, or when a marketing team must reallocate budget before the day ends, speed and trust in the data matter equally. The business value is straightforward: faster answers, better decisions, fewer blind spots, and less operational drag across IT, analytics, and business teams.
Click To Try The Dashboard
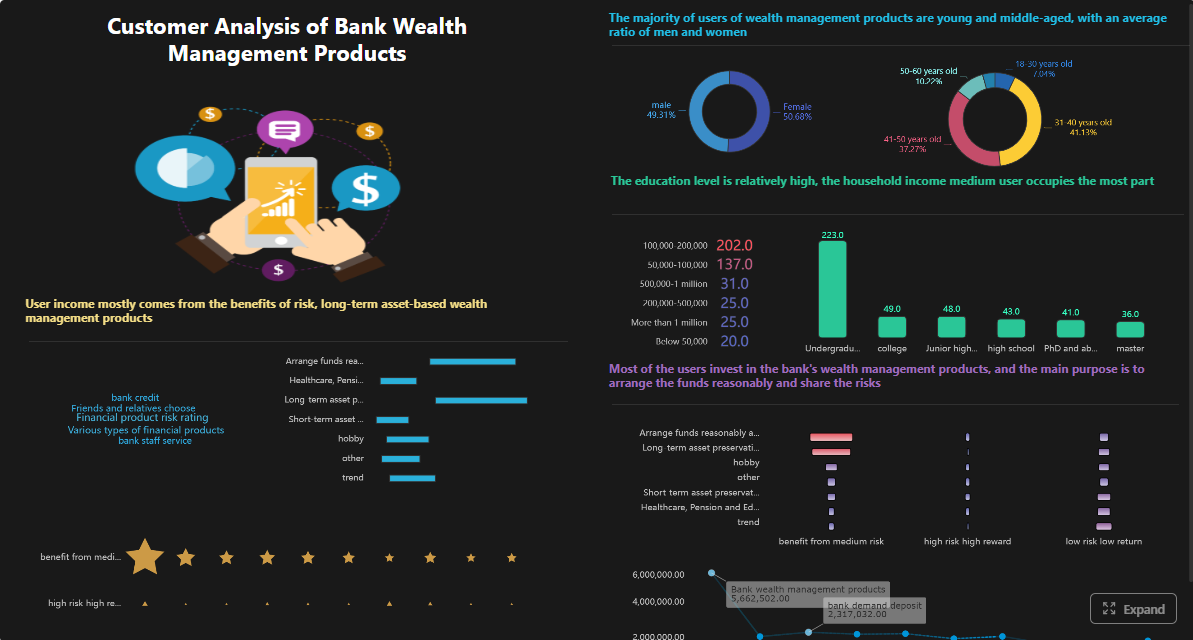
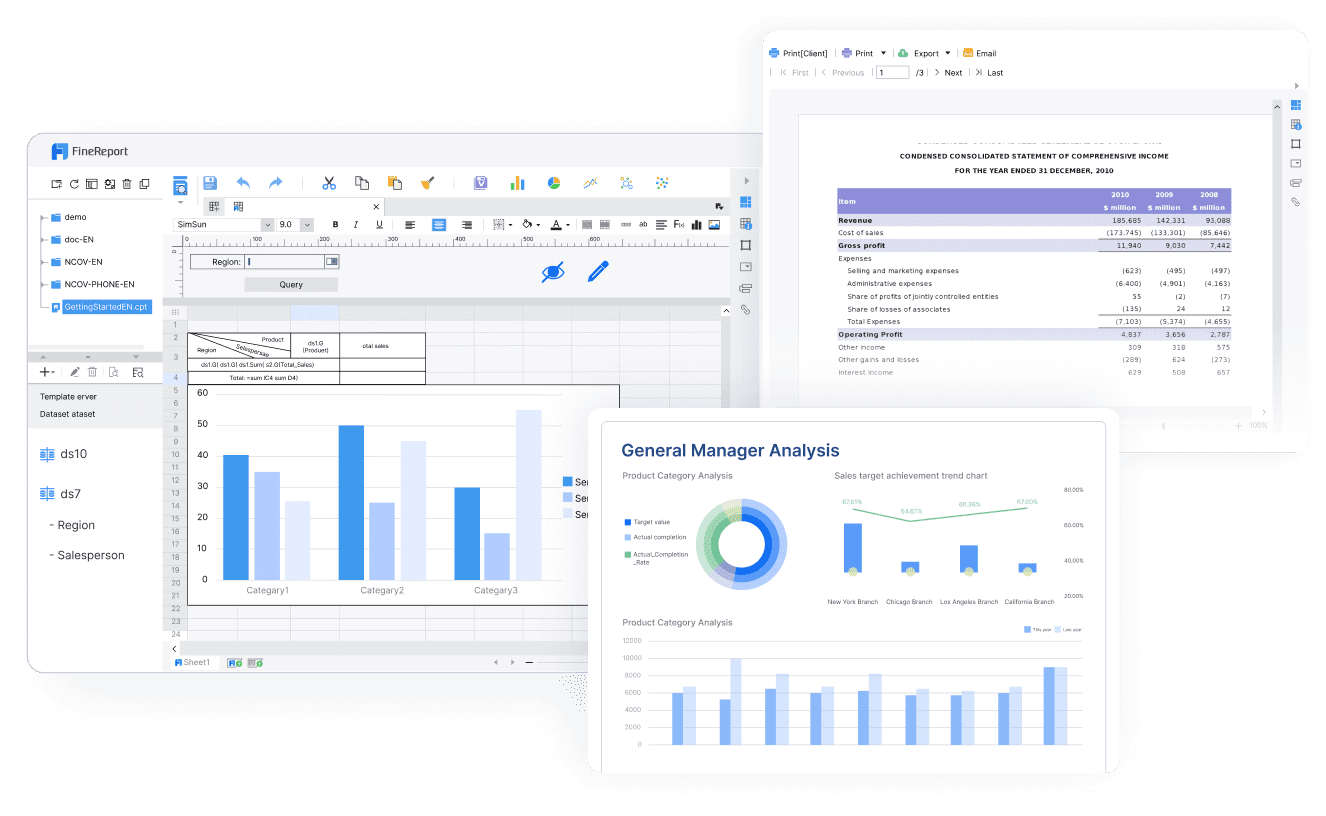
All reports in this article are built with FineReport
Ad hoc reporting and analysis: what they are and why enterprise teams rely on them
Ad hoc reporting and analysis refer to on-demand ways of answering business questions that were not fully addressed by prebuilt, recurring reports. They are often discussed together because both are used when a team needs a fast answer outside standard reporting cycles. In practice, however, they serve slightly different purposes.
Ad hoc reporting is the fast retrieval and presentation of current data to answer a specific question. Ad hoc analysis goes a step further by interpreting that data to explain patterns, causes, anomalies, or likely business impact.
Enterprise teams rely on both because routine reporting cannot anticipate every decision scenario. Standard dashboards are excellent for monitoring known KPIs, but urgent business questions are usually more specific, more time-sensitive, and more context-dependent.
Examples include:
Why did conversion rates fall in one product category this week?
Which warehouses are driving the current order fulfillment delay?
Did last weekend’s pricing change improve margin or only shift volume?
Which accounts are most exposed after a sudden service incident?
These questions differ from routine reporting needs because they are:
Immediate: leaders need answers now, not next week
Contextual: filters, segments, and comparisons change by situation
Decision-linked: the output must support a concrete action
Cross-functional: the answer often requires business and data teams to align quickly
In enterprise environments, expectations are high. Teams need speed, flexibility, and decision support without sacrificing governance. That means self-service where possible, standard definitions where necessary, and enough analytical depth to move from “what happened” to “what should we do next.”
Ad hoc reporting vs. ad hoc analysis: key differences that matter
One of the most common causes of delay in enterprise decision-making is confusion between reporting and analysis. Teams ask for one when they actually need the other, or they deliver a data extract when leadership expects a clear explanation.
Ad hoc analysis answers: Why did it happen, what does it mean, and what should happen next?
A quick report pulls current data from trusted systems and organizes it into a usable view. A deeper analysis examines trends, anomalies, comparisons, drivers, and implications. In many urgent scenarios, teams need both in sequence.
Key Metrics (KPIs)
For effective ad hoc reporting and analysis, enterprise teams should align on a core KPI set before urgent requests arrive:
Revenue Variance: Difference between actual and expected revenue across time, region, segment, or product.
Conversion Rate: Percentage of users, leads, or opportunities moving to the next stage.
Volume Change: Increase or decrease in orders, tickets, transactions, or cases over a defined period.
Margin Impact: Effect of pricing, discounting, channel mix, or cost shifts on profitability.
Service Level / SLA Performance: Percentage of service commitments met within target thresholds.
Inventory Availability: Current stock position versus demand, reorder point, or fulfillment requirement.
Cycle Time: Time required to complete a process such as order fulfillment, ticket resolution, or approval flow.
Exception Rate: Share of records, transactions, or cases falling outside expected rules or thresholds.
Root-Cause Driver: Contributing variable most associated with a performance shift, such as region, campaign, supplier, or product line.
Decision Deadline: The latest time the business can act without losing value, budget, or customer trust.
Interactive filtering by time, product, geography, or owner
Minimal manual preparation
The main objective is speed. If the question is straightforward and the decision depends on current status, ad hoc reporting is usually enough.
When ad hoc analysis is the better fit
Ad hoc analysis is the better fit when the team must investigate causes, trends, anomalies, and business impact before taking action.
Typical scenarios include:
Understanding why revenue dropped despite higher lead volume
Isolating the cause of a late shipment spike
Determining whether churn is linked to pricing, service issues, or product experience
Evaluating whether a campaign underperformed because of audience targeting, timing, or channel mix
This type of work requires more than pulling data. It involves:
Comparing periods, segments, or cohorts
Testing assumptions
Identifying unusual deviations
Combining quantitative evidence with business context
Summarizing implications clearly for decision-makers
A common misconception is that a fast report is always enough. It is not. A report may show that performance changed; analysis explains why that change matters and what the business should do.
Benefits of ad hoc reporting and analysis for enterprise decision-making
For enterprise leaders, the value of ad hoc reporting and analysis is not simply speed. It is the ability to turn uncertainty into action while maintaining control over data quality and interpretation.
The biggest benefits include:
Faster response time: leaders can get answers on short notice without waiting for the next reporting cycle
Greater team independence: business users can answer many questions themselves instead of relying on long reporting queues
Earlier risk detection: unusual shifts in demand, cost, service, or performance become visible sooner
Stronger collaboration: analysts, operations teams, and managers can work from the same data and move toward a shared conclusion
Better decision confidence: governed metrics reduce disagreements over whose numbers are correct
Less manual effort: standardized data access reduces repeated exports, spreadsheet rework, and one-off formatting
For IT managers and data leaders, there is another benefit: ad hoc capability helps reduce low-value request traffic. Instead of rebuilding simple views for every stakeholder, centralized teams can focus on data models, governance, and advanced support.
Typical enterprise use cases
Ad hoc reporting and analysis are especially valuable in situations where timing, scope, and consequences are all significant.
Revenue changes by segment, region, or product line
A regional sales VP sees an unexpected shortfall in one business unit. The immediate need is an ad hoc report that breaks revenue down by geography, product line, and account segment. If the drop appears concentrated in one area, the next step is ad hoc analysis to determine whether the issue is pricing, pipeline quality, shipment timing, or customer churn.
Campaign performance shifts that require immediate budget decisions
A marketing leader notices that paid campaign efficiency has changed mid-quarter. The first question is performance by channel, audience, and creative. The next question is why CAC rose or lead quality fell. The business may need to move budget the same day, so both rapid reporting and deeper analysis matter.
Supply chain, inventory, or service issues that need rapid triage
An operations director is told that fulfillment delays have increased. A quick report can show where the backlog sits. Analysis then identifies root causes such as a supplier bottleneck, warehouse capacity issue, or demand spike in a specific SKU category.
Executive requests that cannot wait for the next scheduled dashboard update
Senior leaders often ask highly specific questions during reviews, planning cycles, or incident response. Waiting for the next dashboard refresh is not realistic. Teams need trusted self-service tools that can create decision-ready outputs on demand.
How the ad hoc reporting and analysis process works in practice
The most effective teams do not treat ad hoc work as random fire drills. They follow a disciplined process that protects speed without compromising accuracy.
Start with a clearly framed business question and decision deadline
Before anyone opens a reporting tool, the team should define the question precisely. A vague request like “show me product performance” is not actionable. A stronger framing is: “Which product lines drove the margin decline in APAC over the last 14 days, and do we need to adjust pricing before Friday?”
This framing sets boundaries for the work:
Scope
Timing
Audience
Required confidence level
Expected action
Identify the right data sources, definitions, and filters before building outputs
Most ad hoc failures happen before the first chart is built. Teams pull the wrong source, use inconsistent definitions, or mix time windows that should not be compared.
At this stage, confirm:
Which system is the source of truth
How the metric is defined
Which filters and exclusions apply
Whether the data is current enough for the decision
Whether permissions allow the intended audience to view the result
Choose the appropriate format: table, chart, drill-down, or deeper analytical review
Not every urgent question needs a dashboard. The best format depends on the decision.
Use:
Tables for detailed record-level review
Charts for trend or variance recognition
Drill-down reports for layered investigation
Analytical summaries when leadership needs interpretation, not just output
If the audience is executive, simplify the presentation. If the audience is operational, include enough detail to take action directly.
Validate findings, summarize implications, and communicate next steps
Even time-sensitive outputs need a quality check. Validate numbers against a trusted benchmark, sanity-check extreme values, and make sure the conclusion matches the evidence.
A strong ad hoc output should end with three things:
These questions prevent wasted effort and help teams right-size the output.
Common challenges to avoid
Ad hoc reporting and analysis create value only when the underlying process is controlled.
Watch for these common failure points:
Inconsistent metric definitions across teams: sales, finance, and operations may define the same KPI differently
Poor data quality or incomplete source coverage: incomplete source systems create false conclusions
Overreliance on manual exports and spreadsheet rework: this slows delivery and increases error risk
Fast answers delivered without sufficient context or validation: speed without interpretation leads to low-confidence decisions
Examples, tools, and best practices for getting faster answers
Enterprise teams do not need more dashboards for the sake of dashboards. They need a practical operating model that turns urgent questions into answers quickly, repeatedly, and safely.
Realistic examples of urgent business questions
Here are common scenarios where ad hoc reporting and analysis deliver immediate value:
“Why did enterprise renewals slow down this week?”
Useful output: renewal pipeline table by account owner, region, contract value, and renewal stage, followed by analysis of delayed approvals or service issues.
“Which campaign should lose budget today?”
Useful output: spend, leads, conversion rate, CAC, and pipeline contribution by channel and audience segment, followed by root-cause review of underperforming assets.
“What is causing the customer support backlog?”
Useful output: open tickets by queue, severity, aging, and product type, followed by analysis of staffing mix, product defects, or escalation trends.
“Do we have a warehouse-specific inventory problem or a broader demand issue?”
Useful output: stock levels, order volume, backorders, and lead times by site and SKU, followed by analysis of supplier delays versus forecast errors.
The right platform determines whether ad hoc work is fast and trusted or slow and disputed. Strong ad hoc reporting tools should support:
Flexible filtering, slicing, and drill-down: users must be able to refine the question without rebuilding from scratch
Reliable access to governed enterprise data: self-service only works when the underlying data is trusted
Collaboration, sharing, and repeatable workflows: users should be able to annotate, distribute, and reuse outputs
Performance that supports time-sensitive decision-making: slow queries and fragile data pipelines defeat the purpose
In enterprise settings, usability alone is not enough. Governance, permissions, auditability, and scale are just as important.
Best practices from a seasoned implementation perspective
If you want ad hoc reporting and analysis to work consistently across the enterprise, follow these best practices.
1. Standardize the semantic layer before scaling self-service
Build shared definitions for revenue, margin, active customer, backlog, SLA, and other sensitive metrics. If teams are free to invent definitions during urgent requests, you will get speed but not trust.
2. Create reusable templates for common urgent scenarios
Most “unexpected” questions are variations of known patterns. Build templates for revenue variance, campaign diagnostics, fulfillment exceptions, service backlog review, and executive drill-downs. This reduces cycle time dramatically.
3. Separate user roles clearly
Not every user should do everything. Business users should have self-service access to governed exploration. Analysts should handle deeper interpretation. Centralized data teams should own models, quality controls, and permissions.
4. Design for permission-based access from day one
Sensitive financial, HR, and customer data require row-level or role-based controls. Enterprises cannot trade security for agility.
5. Turn one-off answers into reusable assets
When a question comes up repeatedly, promote it into a formal dashboard, template, or governed view. This is how mature teams reduce repetitive manual work over time.
Step-by-step approach to implement ad hoc capability
Here is a practical 4-step approach enterprise teams can use.
Step 1: Define the top urgent decision scenarios
List the 10 to 20 business questions that repeatedly trigger last-minute requests. Prioritize by business impact and frequency.
Step 2: Map the trusted data sources and KPI definitions
For each scenario, identify source systems, owners, calculation logic, refresh needs, and access constraints.
Step 3: Build role-based templates and drill-down paths
Create preconfigured reports and dashboards that business users can filter safely. Reserve advanced analytical workspaces for analysts.
Step 4: Establish a review and escalation workflow
Define when a quick report is enough, when deeper analysis is required, and when centralized data teams must step in because the request touches sensitive metrics, poor-quality data, or executive-level decisions.
An enterprise-ready approach to ad hoc reporting and analysis requires more than a tool. It needs clear ownership, a governance model, and a repeatable operating rhythm.
Start by defining responsibilities:
Business users should frame the decision question and use approved self-service views
Analysts should investigate root causes, test assumptions, and communicate implications
Centralized data teams should maintain governed models, quality controls, access policies, and performance standards
Next, establish shared metric definitions and approval processes for sensitive data. Revenue, margin, headcount, customer churn, and service metrics should not be open to interpretation in urgent situations.
Then train teams on when to use reporting, when to use analysis, and when to escalate. This is essential. Many delays happen because the organization has tools but no decision protocol.
Finally, create an operating model that turns urgent questions into confident decisions:
Intake and question framing
Source and KPI validation
Self-service or analyst-led output creation
Review and quality check
Stakeholder communication
Reuse or promote recurring requests into standard assets
Building this manually is complex; use FineReport to utilize ready-made templates and automate this entire workflow.
Get Ready-to-Use Dashboard Templates in Fine Gallery
FineReport helps enterprise teams close the gap between urgent business questions and trusted decisions. Instead of relying on fragile spreadsheet chains or waiting for custom development, teams can use governed data connections, flexible report design, self-service exploration, pixel-perfect outputs, and automated distribution in a single environment. That means faster delivery for business users, stronger control for IT, and better confidence for leadership.
If your organization needs to answer urgent questions without sacrificing consistency, security, or speed, a structured ad hoc reporting and analysis approach is no longer optional. It is a core operating capability.
Ad hoc reporting gives a fast view of current data to answer a specific question, while ad hoc analysis explains why something happened and what it may mean. Reporting focuses on visibility, and analysis focuses on interpretation and action.
Teams should use ad hoc reporting when a question is urgent, specific, and not fully covered by a recurring report. It is especially useful when leaders need current data quickly to support an immediate decision.
Common metrics include revenue variance, conversion rate, volume change, margin impact, SLA performance, inventory availability, and cycle time. The right choice depends on the business question and the decision deadline.
The key is to use governed data sources, shared metric definitions, and self-service tools with filters and drill-downs. This helps teams move quickly while keeping results consistent and reliable.
Yes, if the organization provides intuitive self-service BI tools and clear data governance. That reduces dependence on IT or analyst backlogs while still keeping reporting accurate and secure.
Product Trial
FineReport
Pixel-perfect reports · Interactive dashboards · Easy data entry · Digital twins