FineReport is an enterprise reporting and dashboard platform that helps Excel-reliant finance teams turn manual spreadsheet reporting into governed, automated, highly formatted financial output.
Why financial reporting tools for Excel users matter in 2026
Excel remains the default working environment for many finance teams because it is fast, flexible, and familiar. Teams still use spreadsheets for budgeting, forecasting, variance analysis, management packs, board reporting, and ad hoc analysis. For many controllers and FP&A professionals, Excel is not just a tool for calculations. It is the place where reporting logic, business rules, and presentation formats are built.
That said, the pressure on finance has changed. Data volumes are larger, reporting cycles are tighter, and more stakeholders expect self-service access to timely numbers. Manual spreadsheet reporting often struggles under these conditions. Common issues include broken links, version confusion, inconsistent data definitions, duplicated effort across files, and weak auditability. As collaboration expands across entities, departments, and regions, spreadsheet-only reporting becomes harder to control.
This is why financial reporting tools excel users can adopt have become more important in 2026. The best platforms do not force finance teams to abandon familiar workflows overnight. Instead, they improve data connectivity, automation, governance, and report distribution while preserving the speed and usability Excel users value.
When evaluating a modern reporting platform, Excel-based finance teams should look for a few core outcomes:
Less manual data collection and copy-paste work
More reliable refreshes from ERP, accounting, and operational systems
Better control over permissions, approvals, and version history
Easier creation of board-ready and management-ready reports
A practical path from spreadsheet-driven reporting to scalable finance operations
How to compare financial reporting tools for Excel-based finance teams
Choosing among reporting platforms is easier when comparison criteria are tied to real finance workflows rather than generic software checklists.
Core evaluation criteria
Ease of use for spreadsheet-heavy workflows
The first question is simple: can finance users work efficiently without depending on developers for every change? A strong platform should support the way finance teams already think, especially where row-level calculations, custom formatting, and period-based report structures are involved.
Look for tools that reduce friction for users who are comfortable with Excel logic, tabular layouts, and recurring financial statements. If a platform is powerful but pushes all report design into a specialist layer, adoption may slow down.
Data integration, refresh speed, and model flexibility
Financial reporting becomes fragile when source data has to be exported manually from multiple systems. Modern tools should connect to ERP platforms, accounting systems, databases, and cloud applications with reliable refresh options.
Flexibility to support changes in entities, departments, and chart of accounts
Reporting automation, dashboarding, and distribution options
Different teams need different outputs. Some require pixel-perfect balance sheets and income statements. Others need interactive dashboards for executive review. The best solution depends on the mix.
Security, audit trails, permissions, and version control
As reporting complexity grows, control matters as much as speed. Finance teams need clear access rules, report version history, and confidence that published numbers are traceable.
Strong governance features include:
Role-based permissions
Approval workflows
Cell-level or report-level audit trails
Change tracking and version management
Controlled publication and distribution
Pricing, implementation effort, and scalability for growing teams
Some tools are easy to adopt for a small team but become expensive or limited at scale. Others deliver enterprise control but require more setup. The right choice depends on reporting complexity, team size, and available IT support.
Compare not only subscription cost, but also:
Time to initial deployment
Services or implementation support needed
Ongoing administration burden
Ability to scale across functions, entities, and use cases
Must-have Excel capabilities
For finance teams, “Excel compatibility” can mean very different things. It is important to separate basic file export from truly useful Excel-centric functionality.
Native Excel connectivity and add-ins
The strongest options either connect well with Excel outputs or support Excel-based workflows directly through integrations or add-ins. This matters for teams that still prepare narratives, board packs, and ad hoc analysis in spreadsheet form even after adopting a dedicated reporting platform.
Support for familiar formulas and useful Excel functions for financial planning and analysis
Finance users often rely on established Excel functions and spreadsheet logic for planning and analysis. A useful platform should not make common reporting tasks harder than they need to be. It should allow finance teams to maintain familiar structures for calculations, lookups, period handling, and variance checks.
Reusable financial management templates for Excel
Reusable templates remain important for month-end and quarterly reporting. Whether the organization uses management packs, departmental P&Ls, cash flow views, or budget-versus-actual models, templates reduce rework and improve consistency.
Good platforms make it easier to standardize and reuse financial management templates for Excel rather than rebuilding report structures every cycle.
Options for building and updating reports without excessive IT dependency
Finance teams often need to adjust report formats, add columns, update mappings, or create new management views quickly. If every change requires a technical specialist, the platform may not fit real-world finance timelines.
The best reporting tools strike a balance between governance and flexibility. Finance can own routine reporting work while IT supports integrations, architecture, and complex data modeling where needed.
Click To Try The Dashboard
FineReport vs Power BI vs Datarails vs Vena: side-by-side comparison
Below is a practical shortlist for Excel-based finance teams. Each tool serves a different reporting style, so the best choice depends on whether your priority is formatted statements, dashboards, Excel-native FP&A workflows, or structured planning processes.
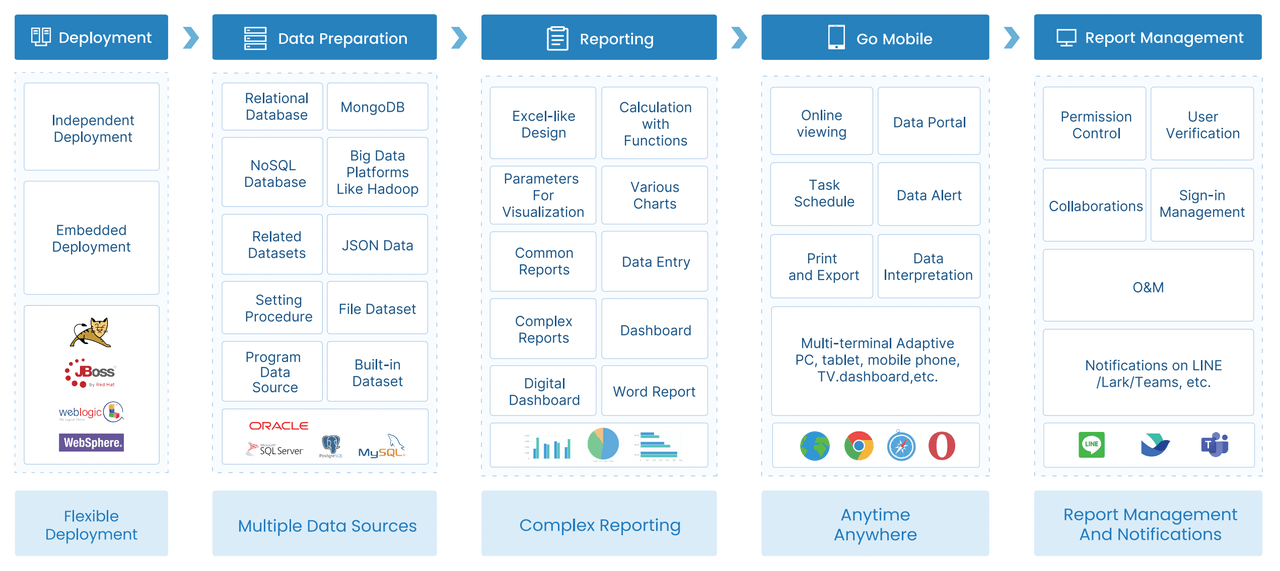
FineReport
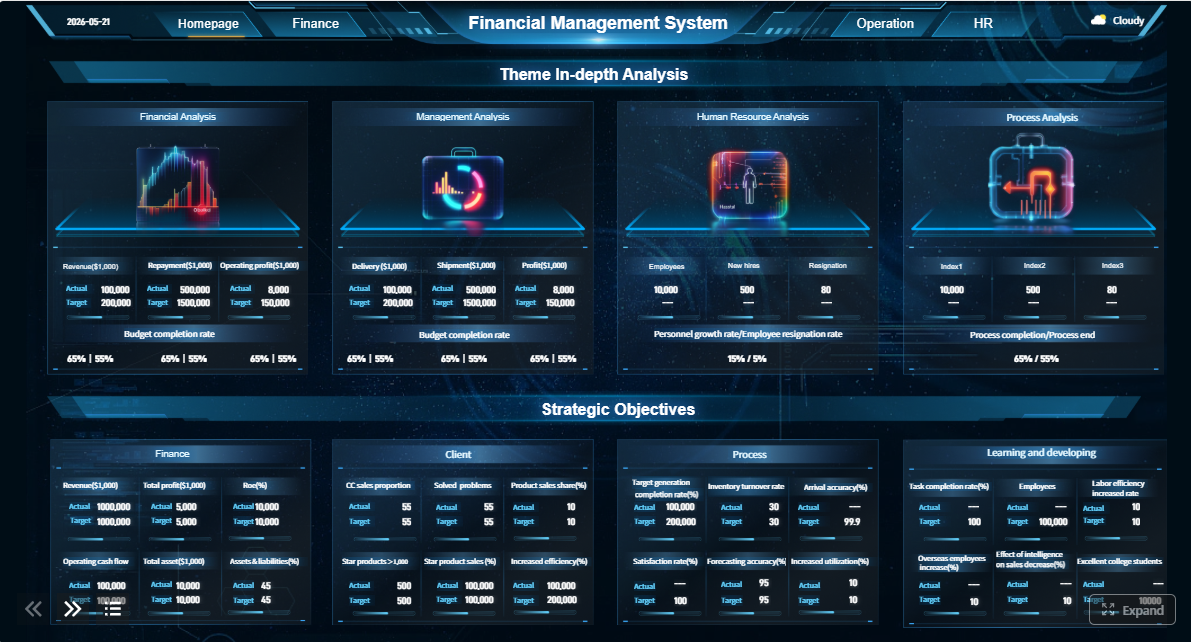
One-sentence overview:FineReport is best for finance teams that need pixel-perfect financial statements, flexible report design, dashboard support, and broad connectivity across enterprise data sources.
Key Features:
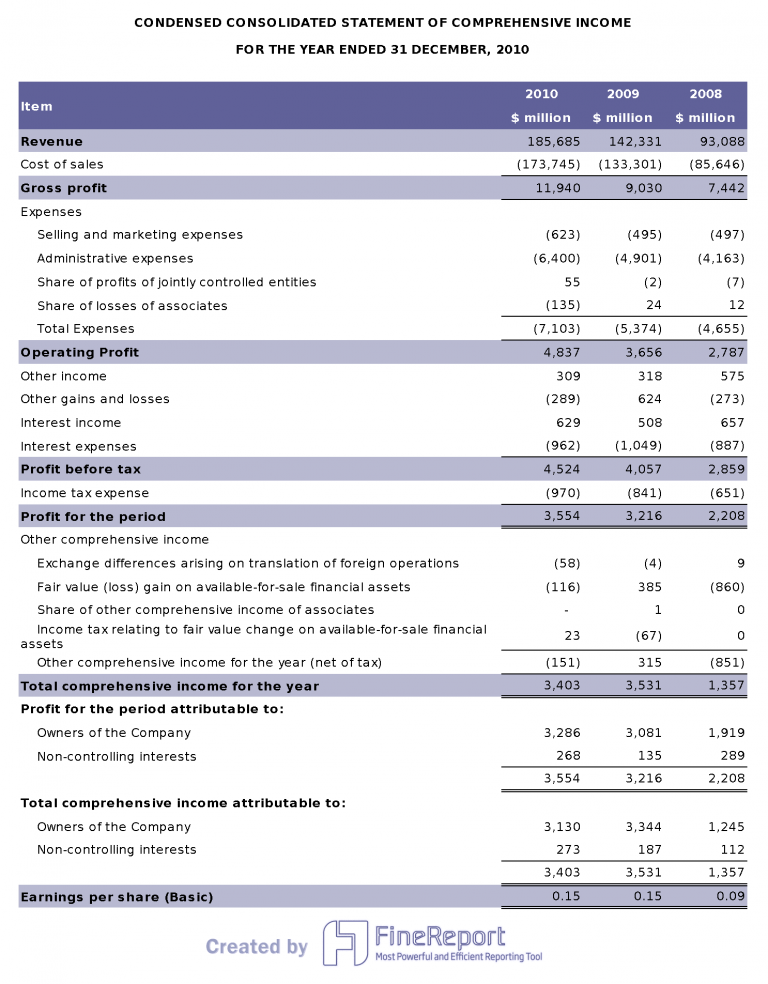
Highly formatted report design for income statements, balance sheets, cash flow reports, and board packs
Supports both dashboards and structured reports in one platform
Helpful for organizations that need centralized, governed reporting beyond spreadsheet files
Cons:
May require more setup than lightweight Excel add-ins
Can be more than smaller teams need if reporting requirements are very simple
Best For (Target user/scenario):
Mid-sized and large organizations that need polished, board-ready or compliance-sensitive reporting with stronger governance than standalone spreadsheets can provide
FineReport stands out when report appearance matters as much as the data behind it. Many finance teams do not just need dashboards. They need formal, readable statements with precise row structures, account groupings, subtotal logic, and print-ready layouts. That is where FineReport is especially strong.
For Excel users, this matters because the pain point is often not just analysis. It is the final reporting package. If your team spends too much time cleaning exports, aligning columns, adjusting layouts, and preparing executive-ready reports manually, FineReport offers a more scalable path. It also gives organizations a way to modernize reporting without reducing everything to generic dashboard tiles.
Compared with the other tools in this list, FineReport is the strongest option when your reporting environment includes recurring financial packs, multi-format distribution, and a need for design precision. That makes it a strong recommendation for organizations looking for modern financial reporting tools excel users can transition to without losing report quality.
Power BI
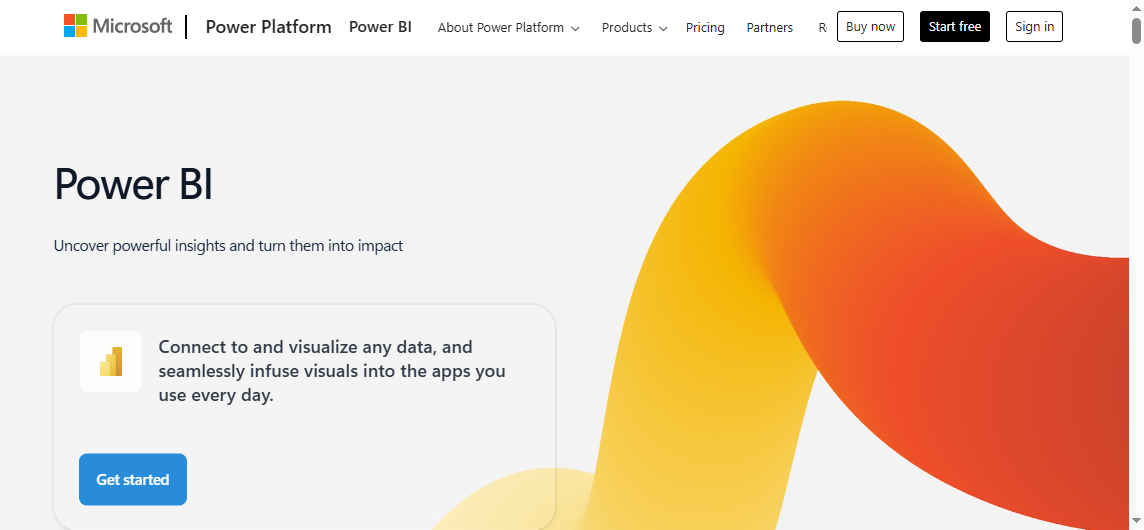
One-sentence overview: Power BI is a strong option for organizations that prioritize interactive dashboards, Microsoft ecosystem alignment, and broad self-service analytics.
Key Features:
Interactive dashboards and drill-down analysis
Deep integration with Microsoft tools such as Excel, Teams, Azure, and Dynamics
Strong data modeling and transformation capabilities
Financial statement formatting can require extra effort
DAX and data modeling add complexity for non-technical users
Finance teams may need IT or BI support to maintain models at scale
Best For (Target user/scenario):
Teams focused on dashboards, executive analytics, and self-service reporting inside a Microsoft-heavy environment
Power BI is often the first platform Excel users consider because it sits naturally within the Microsoft stack. It is powerful for visual analysis, trend monitoring, and dashboarding. It is also strong for combining data from multiple systems and enabling interactive exploration.
Its main limitation for finance reporting is format control. If your primary need is a polished P&L or board pack that must follow a strict layout, Power BI can feel less natural than a dedicated reporting platform. It is excellent for answering questions and exploring performance, but not always the easiest path to highly structured financial statements.
Datarails
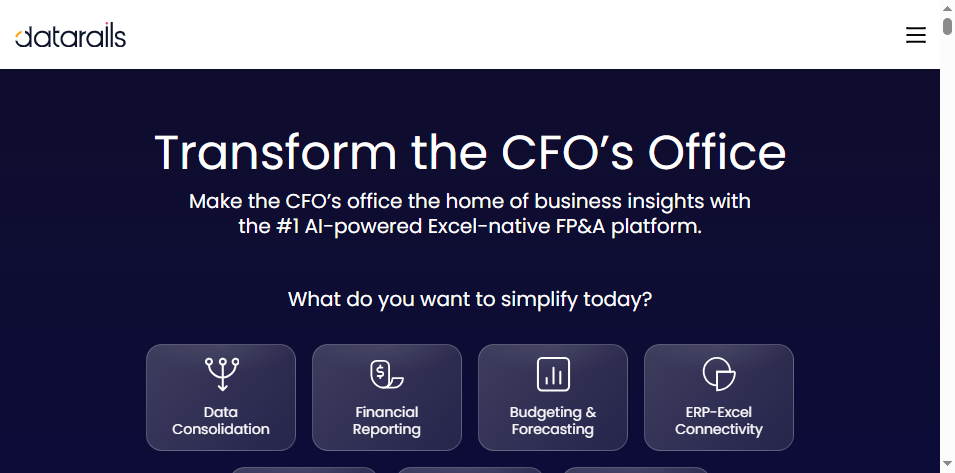
One-sentence overview: Datarails is designed for finance teams that want to keep Excel at the center while adding consolidation, automation, and FP&A workflow support.
Budgeting, forecasting, and variance analysis support
Finance-focused reporting capabilities
Pros & Cons:
Pros:
Familiar spreadsheet experience for finance users
Good fit for teams that want to preserve existing Excel models
Adds control and automation to spreadsheet-led processes
Well aligned with FP&A use cases
Cons:
Less flexible than broader BI or enterprise reporting platforms for organization-wide analytics
Implementation and pricing can be significant relative to simpler tools
Best For (Target user/scenario):
Finance-led teams that want stronger control, consolidation, and automation without moving far from Excel-based workflows
Datarails appeals to teams that want evolution rather than replacement. If the reporting logic already lives in Excel and the organization wants cloud-based control around it, Datarails is a sensible shortlist candidate. It is especially relevant for FP&A teams that need budgeting, forecasting, and recurring management reporting with better version discipline.
Where it is less compelling is in wider enterprise BI or broader operational reporting. It is more finance-specific by design, which can be an advantage or a limitation depending on your goals.
Vena
One-sentence overview: Vena is an Excel-based planning and reporting platform that combines familiar spreadsheet workflows with structured processes, collaboration, and workflow management.
Key Features:
Excel-based interface for planning and reporting
Workflow and approval management
Budgeting, forecasting, and financial consolidation support
Collaboration and auditability features
Structured process control for finance cycles
Pros & Cons:
Pros:
Strong fit for organizations standardizing finance processes
Preserves Excel familiarity while adding governance
Good support for budgeting and forecasting cycles
Useful approval and collaboration controls
Cons:
Implementation scope may be heavier than some teams expect
Total cost can be high for smaller organizations with simple needs
Best For (Target user/scenario):
Organizations seeking Excel-based planning, reporting, and workflow management within a more structured corporate performance management environment
Vena is often attractive to organizations that want more than reporting alone. It supports planning, approvals, and process discipline in a way that fits finance operations well. For teams that need controlled submissions, recurring workflows, and consistent cross-department collaboration, Vena can be a strong fit.
Its trade-off is that it may feel broader and heavier than necessary for teams mainly trying to fix monthly reporting output. If your top issue is polished statement generation and report distribution, FineReport may be the more direct fit. If your broader objective is Excel-based planning plus workflow control, Vena deserves close consideration.
Other financial reporting software and add-ins worth considering
The four tools above cover many common Excel-based finance scenarios, but they are not the entire market. Finance teams should also review broader categories of financial reporting software and add-ins when building a shortlist.
This is especially true if your needs extend into:
Multi-entity close and consolidation
Regulatory and compliance reporting
Account reconciliation
Narrative reporting
ESG or statutory reporting
ERP-native reporting extensions
Spreadsheet automation add-ins
In practice, many buyers start with a focused shortlist and then widen their review only if specific requirements appear. That is usually more efficient than reading a massive market roundup too early.
A practical approach is to begin with the core shortlist in this article, then cross-check wider curated lists such as:
That process helps teams separate true contenders from tools that are better suited to other finance maturity levels or operating models.
What should you expect from financial reporting software and add-ins in general? At minimum, a modern product should improve on spreadsheets in a few important ways:
Automate data collection and report refresh
Support the close and recurring reporting cycles
Improve consistency across entities and departments
Add stronger permissions, traceability, and control
Reduce file sprawl and manual reconciliation effort
For Excel users, the key question is not whether a tool can replace spreadsheets entirely. It is whether the tool solves the reporting bottlenecks that spreadsheets alone no longer handle well.
How Excel users can improve reporting before switching tools
Not every reporting issue requires a new platform immediately. Many teams can improve speed and accuracy by tightening spreadsheet design and process discipline first. Doing this also makes future software implementation easier because source logic becomes more standardized.
How to build a financial report in Excel more effectively
Standardize source data and chart of accounts structures
Reporting gets harder when source data is inconsistent. Standard account naming, clear chart of accounts hierarchies, and consistent period labeling reduce downstream cleanup. Even small improvements here can cut hours from month-end reporting.
Reduce manual linking errors with consistent formulas, checks, and naming conventions
Complex workbooks often break because links are inconsistent and logic is hard to trace. Finance teams should standardize formula patterns, use named ranges carefully, and build visible control checks. Useful Excel functions for financial planning and analysis, such as XLOOKUP, SUMIFS, IF, EOMONTH, and INDEX/MATCH, can improve reliability when used consistently.
Create modular report tabs for management reporting, variance analysis, and board-ready summaries
A better workbook structure separates recurring outputs into clear layers. For example:
Data import or raw data tabs
Mapping and calculation tabs
Report output tabs
Dashboard or summary tabs
This modular structure makes financial reports easier to refresh, review, and update.
5 helpful tips for Excel financial reporting
1. Separate raw data, calculations, and presentation layers
This is one of the most effective ways to reduce confusion. Raw exports should not sit inside final presentation tabs. Keeping layers separate makes review easier and lowers the chance of accidental overwrite.
2. Use validation checks and exception flags to catch errors early
Add balance checks, mapping completeness checks, sign tests, and variance thresholds. Small warning flags often prevent larger reporting mistakes.
3. Build repeatable month-end processes and documentation
A well-designed reporting file is not enough if the monthly process changes every cycle. Document refresh steps, ownership, review checkpoints, and publication timing so reporting is repeatable.
4. Limit file sprawl with clearer ownership and version rules
Too many files create uncertainty about which report is final. Use clear naming conventions, archive rules, and owner accountability to reduce duplication and confusion.
5. Identify when reporting pain points justify moving to a dedicated platform
Excel remains valuable, but there is usually a tipping point. Common signs include:
Multiple people editing different versions of the same file
Heavy reliance on copy-paste from ERP exports
Repeated formula breaks during close
Slow turnaround for board or management packs
Weak auditability for published numbers
Difficulty scaling reporting across entities or departments
Once these issues become recurring operational risks, a dedicated platform is usually the better long-term answer.
Which tool is best for your finance team?
The best choice depends on what kind of reporting problem you are trying to solve.
Choose FineReport if your organization needs highly formatted, enterprise-grade reporting with flexible deployment, strong report design control, and broad data connectivity. It is the best fit when polished financial statements, scheduled distribution, and governed reporting matter most.
Choose Power BI if your team is focused on dashboards, KPI visibility, and Microsoft-native analytics. It is strongest for interactive exploration and visual reporting.
Choose Datarails if finance wants to preserve Excel-centric workflows while adding consolidation, version control, and automation for FP&A processes.
Choose Vena if your organization wants Excel-based planning and reporting combined with workflow management, approvals, and more structured finance processes.
A simple decision framework can help:
Reporting complexity: The more formal and structured the outputs, the stronger the case for FineReport
Team size: Smaller Excel-led teams may prefer Datarails or Vena, while larger cross-functional environments may need FineReport or Power BI
IT support: If finance needs more self-service dashboarding and has BI support, Power BI is attractive; if finance needs governed formatted reports, FineReport is often the better fit
Budget: Lightweight needs may not justify broader implementations, while enterprise reporting demands often do
For many Excel-based finance teams in 2026, the real choice is not between spreadsheets and software. It is between continuing to patch manual reporting processes or adopting a platform that improves control, speed, and confidence. If your priority is accurate, polished, enterprise-ready reporting rather than dashboarding alone, FineReport is the strongest starting point.
FAQs
The best tools reduce manual spreadsheet work while keeping familiar finance workflows intact. Key priorities include reliable data connections, automation, strong permissions, audit trails, and support for board-ready reporting.
Power BI can work well for teams in the Microsoft ecosystem, especially when interactive dashboards matter. However, finance teams often need extra skills in data modeling and DAX, so it may be less intuitive than more Excel-centric options.
FineReport focuses on governed, highly formatted enterprise reporting and dashboard delivery, which can be useful for teams producing standardized financial output at scale. Datarails and Vena are more centered on Excel-native FP&A workflows such as budgeting, forecasting, and collaboration.
In many finance teams, no, and it usually should not have to. The strongest platforms improve control, automation, and data access while letting users keep Excel for analysis, templates, and ad hoc reporting where it still adds value.
They help finance teams trace how numbers changed, who changed them, and which version was approved for distribution. This reduces reporting risk, improves compliance, and makes month-end and board reporting more trustworthy.
Product Trial
FineReport
Pixel-perfect reports · Interactive dashboards · Easy data entry · Digital twins