
If you are searching for power bi interview questions, you are probably trying to solve one of three problems: understand what interviewers actually test, prepare answers that sound practical instead of memorized, and tailor your preparation to the specific role you want.
That role matters more than many candidates realize.
A Data Analyst is usually tested on reporting logic, KPI design, data preparation, and business communication. A BI Developer is expected to go deeper into semantic modeling, DAX patterns, performance optimization, and deployment practices. A Power BI Admin is typically evaluated on governance, security, tenant management, refresh reliability, and platform support.
Hiring managers rarely want textbook definitions alone. They usually test whether you can apply Power BI in real situations involving:
- Modeling
- DAX
- Visualization
- Governance
- Deployment
- Troubleshooting
The smartest way to prepare for 2026 interviews is not to memorize one giant list. It is to build role-based answers that show how you think, how you solve problems, and how your Power BI skills connect to business outcomes.
Quick Comparison Table
Before jumping into specific questions, here is a structured view of what most interviewers emphasize by role.
| Role | Best for | Main interview focus | Technical depth expected | Common tools/topics | Recommended prep style |
|---|---|---|---|---|---|
| Data Analyst | Reporting, business insight, KPI tracking | Data cleaning, visuals, storytelling, business logic | Moderate | Power Query, measures, filters, dashboards | Practice business scenarios and dashboard walkthroughs |
| BI Developer | Scalable BI solutions and semantic models | Modeling, DAX, optimization, deployment | High | Star schema, CALCULATE, iterators, incremental refresh | Prepare architecture, DAX, and performance examples |
| Power BI Admin | Platform governance and support | Security, tenant settings, capacity, refresh, access control | High in administration | Workspaces, RLS, gateway, Premium, monitoring | Practice governance decisions and troubleshooting cases |
A strong candidate knows the fundamentals across all three roles, but the depth changes significantly.
Power BI Interview Questions and Answers by Role for 2026
Role-based preparation works because interview expectations are different even when the product is the same. A recruiter may ask broad screening questions, but the hiring manager usually looks for evidence that you can handle the work listed in the job description.
Here is the practical shift:
- Data Analyst interviews focus on turning raw data into clear decisions.
- BI Developer interviews focus on designing reliable, scalable models and calculations.
- Admin interviews focus on managing Power BI as an enterprise platform.
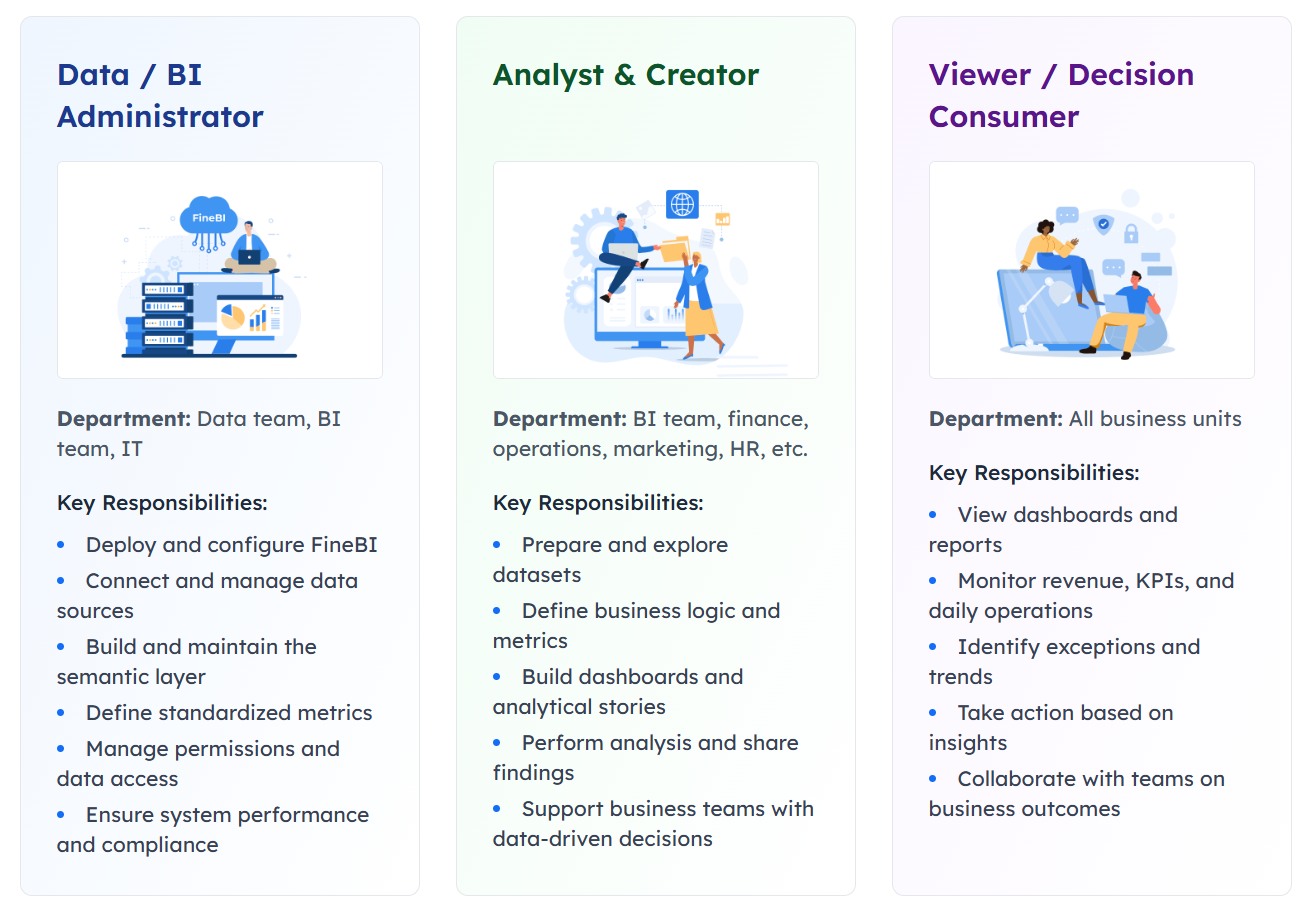
This is why generic question lists often fall short. They help you recognize terms, but they do not teach you how to answer in a role-specific way.
Typical Power BI Interview Questions for Every Candidate
No matter which role you target, there are some fundamentals almost every interviewer expects you to know. These questions often cover:
- Power BI Desktop
- Power BI Service
- Mobile access
- Data refresh
- Relationships
- Basic data modeling
- Report performance
A strong answer is usually:
- Concise
- Practical
- Business-focused
- Accurate without overexplaining
Core concepts interviewers often ask about
1. What is the difference between Power BI Desktop, Power BI Service, and Power BI Mobile?
Strong answer:
Power BI Desktop is the authoring tool used to connect data, transform it, build the semantic model, write DAX, and design reports. Power BI Service is the cloud platform used to publish, share, refresh, govern, and collaborate on content. Power BI Mobile is the app for consuming dashboards and reports on phones or tablets.
What interviewers are testing:
They want to see whether you understand the end-to-end workflow, not just report creation.
2. What is the difference between Import, DirectQuery, and Live Connection?
Strong answer:
Import loads data into the Power BI model, which usually gives better interactive performance but requires refresh. DirectQuery leaves data in the source and queries it when users interact, which can help with near-real-time use cases but may depend heavily on source performance. Live Connection connects to an existing semantic model or analytical source, where modeling is managed elsewhere.
What interviewers are testing:
Whether you understand trade-offs, not just definitions.
3. Why does star schema matter in Power BI?
Strong answer:
A star schema separates fact tables from dimension tables, making models easier to understand, easier to maintain, and often more efficient for filtering and DAX calculations. It reduces ambiguity and supports more reliable reporting.
What interviewers are testing:
Your modeling maturity. Even analyst roles often include this question.
4. What is the difference between a measure, a calculated column, and a calculated table?
Strong answer:
A measure is calculated at query time based on filter context and is best for aggregations used in visuals. A calculated column is computed row by row and stored in the model, so it increases model size. A calculated table creates a new table in the model based on DAX logic and is used for specific modeling scenarios.
What interviewers are testing:
Whether you know when to use each option and the performance implications.
5. How do you improve Power BI report performance?
Strong answer:
I start by checking the data model, reducing unnecessary columns, simplifying relationships, reviewing cardinality, and minimizing heavy visuals on a page. Then I look at DAX efficiency, refresh design, and whether the storage mode fits the use case.
What interviewers are testing:
Structured troubleshooting.
How to answer scenario-based questions well
Many Power BI interviews now include scenario-based questions because they reveal how you think under realistic constraints. A good format is:
- Context: What was the business problem?
- Action: What did you do in Power BI or around the process?
- Outcome: What changed, improved, or got resolved?
For example:
Question: Tell me about a time report numbers did not match stakeholder expectations.
Good answer structure:
A finance stakeholder noticed margin numbers in a monthly dashboard did not match their spreadsheet. I traced the issue to inconsistent filters between the source extract and the semantic model, then aligned the date logic and validated totals with the finance team. After correction, the report became the trusted source for monthly reviews and reduced reconciliation time.
This kind of answer shows:
- Problem-solving
- Communication
- Validation discipline
- Business impact
Data Analyst Role: Questions Focused on Reporting and Business Insight
For a Data Analyst role, interviewers usually care less about advanced architecture and more about whether you can convert data into useful decisions. They often test:
- Data preparation
- KPI definition
- Dashboard usability
- Visual choices
- Basic-to-intermediate DAX
- Self-service reporting judgment
Reporting and dashboard design questions
1. How do you choose the right visual for trends, comparisons, and part-to-whole analysis?
Strong answer:
I match the visual to the question being asked. For trends over time, I usually use line charts. For comparing categories, bar or column charts work well. For part-to-whole, I prefer stacked bars or treemaps when the number of categories is manageable. I avoid visuals that look attractive but make interpretation harder.
Why this works:
It shows that you design for decision-making, not decoration.
2. How would you design an executive dashboard?
Strong answer:
I would start with the business decisions executives need to make, then define a limited set of KPIs, trend views, and exception indicators. The layout should surface the most important metrics first, keep interactions simple, and allow drill-down only where it adds value. I would also validate the dashboard with stakeholders before finalizing it.
3. How do you handle messy source data before building reports?
Strong answer:
I use Power Query to clean and standardize the data before modeling. That may include fixing data types, removing duplicates, handling nulls, splitting or merging columns, and aligning naming conventions. I try to keep transformation logic consistent and documented so the dataset remains reliable.
4. What makes a dashboard actionable?
Strong answer:
An actionable dashboard connects metrics to decisions. It should highlight changes, exceptions, targets, and drivers so users know what needs attention. If users can see the KPI but cannot tell what to do next, the dashboard is incomplete.
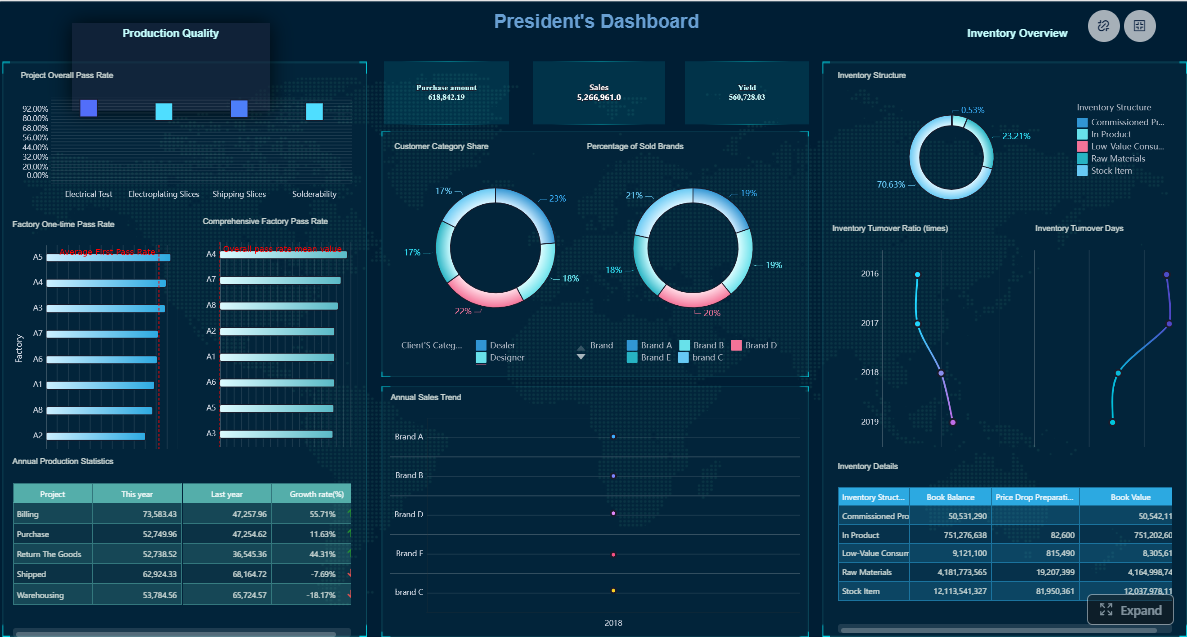
All dashboards in this article are built with FineBI.
DAX and analytical thinking questions
1. How would you write a measure for year-to-date sales?
Strong answer:
I would create a measure using a proper date table and time intelligence logic so the result follows the current filter context. I would also verify that the date table is marked correctly and that relationships support the calculation.
This answer does not require reciting code unless the interviewer asks for it. Many interviewers care more about your setup logic than syntax memorization.
2. How do you explain filter context in plain language?
Strong answer:
Filter context is the set of conditions that affect a calculation at a given moment. For example, if a visual is filtered to one region and one month, the measure is calculated only for that slice of data. Changing the slicer changes the context and therefore the result.
3. How do you validate numbers when report results look incorrect?
Strong answer:
I check the source data, relationships, filters, and DAX logic step by step. I compare totals at different levels, create simple validation measures, and isolate whether the issue comes from the data, the model, or the visual interaction. I also confirm the expected business definition with stakeholders because sometimes the issue is definition mismatch, not calculation failure.
4. How do you calculate ratios or variance in a business report?
Strong answer:
I define the business formula clearly first, then build measures that respond correctly to filter context. For variance, I typically compare actual against target, budget, or prior period. I also make sure edge cases like divide-by-zero are handled cleanly.
BI Developer Role: Questions on Data Modeling, DAX, and Performance
For a BI Developer role, the interview goes deeper. You are expected to show you can build semantic models that are reliable, reusable, and scalable. Typical topics include:
- Schema design
- Advanced DAX
- Model optimization
- Refresh strategy
- Release practices
- Multi-developer collaboration
Data modeling and DAX questions
1. How do you build a scalable star schema?
Strong answer:
I start by identifying the business process, then define the fact table at the correct grain and connect it to clean conformed dimensions such as date, product, customer, or region. I avoid unnecessary snowflaking unless there is a clear reason, and I keep relationships as simple and explicit as possible to support both usability and performance.
2. How do you handle many-to-many relationships in Power BI?
Strong answer:
I try to avoid many-to-many where possible by redesigning the model or introducing bridge tables. If a many-to-many relationship is required, I make sure the business logic is fully understood and test filter propagation carefully because ambiguity can lead to incorrect results.
3. When do you use CALCULATE?
Strong answer:
I use CALCULATE when I need to evaluate an expression under a modified filter context. It is central to many DAX patterns such as time intelligence, conditional filters, and context transitions.
4. What are iterators, and when would you use them?
Strong answer:
Iterators such as SUMX evaluate an expression row by row over a table and then aggregate the results. I use them when a simple aggregation is not enough and the calculation depends on row-level logic before summarization.
5. Why use variables in DAX?
Strong answer:
Variables improve readability, reduce repeated logic, and can help with debugging and maintainability. They also make complex measures easier to explain during code reviews or handovers.
6. When would you use Power Query instead of DAX?
Strong answer:
I prefer Power Query for data shaping and structural transformation before the data enters the model, such as cleaning columns, pivoting, merging, and standardizing values. I use DAX for analytical logic that needs to respond dynamically to report filters and user interaction.
Performance and enterprise development questions
1. How do you diagnose a slow Power BI report?
Strong answer:
I break the issue into model performance, query performance, and visual performance. I review model size, high-cardinality columns, relationship design, storage mode, and DAX complexity. Then I check whether too many visuals or expensive interactions are slowing the page. I try to isolate the main bottleneck before making changes.
2. What affects model size and performance?
Strong answer:
Large text columns, unnecessary detail, high-cardinality fields, too many calculated columns, and poorly designed relationships can all increase model size and reduce efficiency. Keeping only needed fields and modeling at the right grain usually helps.
3. How do you optimize refresh and incremental refresh?
Strong answer:
I first understand refresh frequency, data volume, and source constraints. Incremental refresh is useful when historical data is stable and only recent partitions change. Good partition logic, stable date filtering, and source query efficiency are all important.
4. How do you manage versioning and release workflows?
Strong answer:
I use a structured promotion process across development, test, and production where possible, document semantic model changes, and coordinate releases so report logic is validated before business users see it. I also separate reusable datasets from report layers when appropriate.
5. How do you balance reusability with report-specific needs?
Strong answer:
I try to keep core business logic in shared semantic models and avoid duplicating definitions across reports. If a report has a unique calculation, I evaluate whether it belongs in the shared model or should remain local to avoid unnecessary complexity.
Power BI Admin Role: Questions on Governance, Security, and Tenant Management
For a Power BI Admin role, interviewers want proof that you can run Power BI as a managed platform, not just build reports. This includes:
- Governance
- Security
- Capacity planning
- Monitoring
- Refresh reliability
- Business enablement
Security and governance questions
1. What are workspace roles in Power BI, and why do they matter?
Strong answer:
Workspace roles control what users can do with content, such as viewing, editing, publishing, or managing access. They matter because good role design helps organizations collaborate without giving broader permissions than needed.
2. How do app distribution and workspace access differ?
Strong answer:
Workspace access is for users who need to collaborate on content creation or management. Apps are for distributing curated content to broader business audiences in a more controlled way.
3. What is row-level security?
Strong answer:
Row-level security restricts which rows of data a user can see based on defined rules. It allows one report or semantic model to serve different audiences while preserving data access boundaries.
4. How do tenant settings support governance?
Strong answer:
Tenant settings let administrators control features and sharing behaviors at the organization level. Good governance uses these settings to balance innovation with risk control, such as limiting who can publish widely, use certain features, or connect to external services.
5. How do you monitor adoption across the organization?
Strong answer:
I look at usage patterns, content ownership, refresh health, and workspace activity to understand which reports are being used, which teams need support, and where governance or enablement actions are needed.
Capacity, refresh, and support questions
1. What is the difference between shared and Premium capacity?
Strong answer:
Shared capacity is the standard multi-tenant environment for Power BI workloads, while Premium provides dedicated resources and supports broader enterprise scenarios such as larger scale, advanced distribution, and more administrative control. The right choice depends on workload size, performance needs, and governance requirements.
2. How do you troubleshoot gateway or scheduled refresh issues?
Strong answer:
I check gateway status, credentials, source availability, query changes, refresh logs, and timeout behavior. I also verify whether changes in the source schema, permissions, or network configuration caused the failure.
3. How do you handle access issues from business users?
Strong answer:
I first confirm whether the issue is caused by workspace permission, app audience, row-level security, or tenant policy. Then I resolve the immediate access problem while documenting whether there is a broader governance issue to address.
4. How do you support self-service BI without losing control?
Strong answer:
I establish clear workspace standards, approved data sources, security patterns, and support guidelines. The goal is to enable teams to move quickly while keeping important data assets governed and reusable.
How to Prepare Role-Based Answers and Practice for 2026 Interviews
The best preparation strategy is to match your examples to the job description. If the role emphasizes reporting and stakeholder engagement, your stories should show business impact. If it emphasizes semantic models and optimization, your examples should go deeper technically. If it is an admin role, your examples should show governance judgment and platform reliability.
A useful preparation framework is:
- Read the job description carefully.
- Group required skills into fundamentals, role-specific depth, and scenario questions.
- Prepare 5 to 8 project stories aligned with those requirements.
- Practice concise answers out loud.
- Review likely follow-up questions.
Final preparation checklist
- Review project stories that prove impact, ownership, and technical depth.
- Prepare role-specific examples for analytics, development, or administration.
- Rehearse common follow-up questions like:
- Why did you choose that model design?
- What trade-off did you make?
- How did you validate the result?
- What would you improve now?
- Practice whiteboard-style explanations for:
- Star schema
- Filter context
- Refresh flow
- Security design
- Build a study plan based on your level:
- Freshers: fundamentals, dashboard walkthroughs, simple DAX, Power Query basics
- Mid-level candidates: scenario answers, model design, optimization, stakeholder examples
- Experienced professionals: architecture decisions, governance, troubleshooting, scaling
Practical Recommendations for Power BI Interview Preparation
Here are five practical recommendations I would give as a BI consultant to anyone preparing for power bi interview questions in 2026:
-
Do not memorize definitions without examples.
Interviewers remember candidates who connect concepts to actual project decisions. -
Prepare one strong story for each major area.
Have at least one example for modeling, DAX, dashboard design, troubleshooting, and stakeholder communication. -
Explain trade-offs clearly.
Saying why you chose Import over DirectQuery or Power Query over DAX shows judgment. -
Practice simplifying technical concepts.
If you can explain filter context or RLS in plain language, you will perform better with both technical and non-technical interviewers. -
Build a portfolio walkthrough, not just a resume summary.
Be ready to explain what problem a report solved, how the data model worked, what was difficult, and what measurable outcome it supported.
Beyond Power BI Interview Prep: What Teams Also Evaluate in Modern BI Roles
Power BI remains one of the most widely used BI tools, so it makes sense that many candidates prepare around its ecosystem. But in real hiring environments, companies are not only evaluating whether someone can use one product. They are also evaluating whether that person understands broader BI principles:
- Trusted metrics
- Reusable semantic logic
- Self-service analytics
- Dashboard adoption
- Governance
- Cross-team collaboration
That broader perspective matters because many enterprises use mixed BI environments or evaluate alternatives based on user adoption, deployment preferences, and how easily business teams can explore data without relying on specialists for every change.
Tools like Power BI are widely used in the BI market, but teams that need a more business-user-friendly, self-service BI platform may also consider FineBI.
When FineBI Is Relevant for BI Teams Preparing for Real-World Work
FineBI is designed for self-service BI and interactive analytics, especially for organizations that want business users to participate more actively in reporting and analysis. In practical terms, that means teams can build dashboards, explore data, drill down into results, and share insights more easily across departments.
For candidates preparing for interviews, understanding platforms like FineBI is useful because interviews increasingly test whether you can support:
- Business-user adoption
- Faster dashboard iteration
- Governed self-service analytics
- Enterprise data connectivity
- Interactive reporting workflows
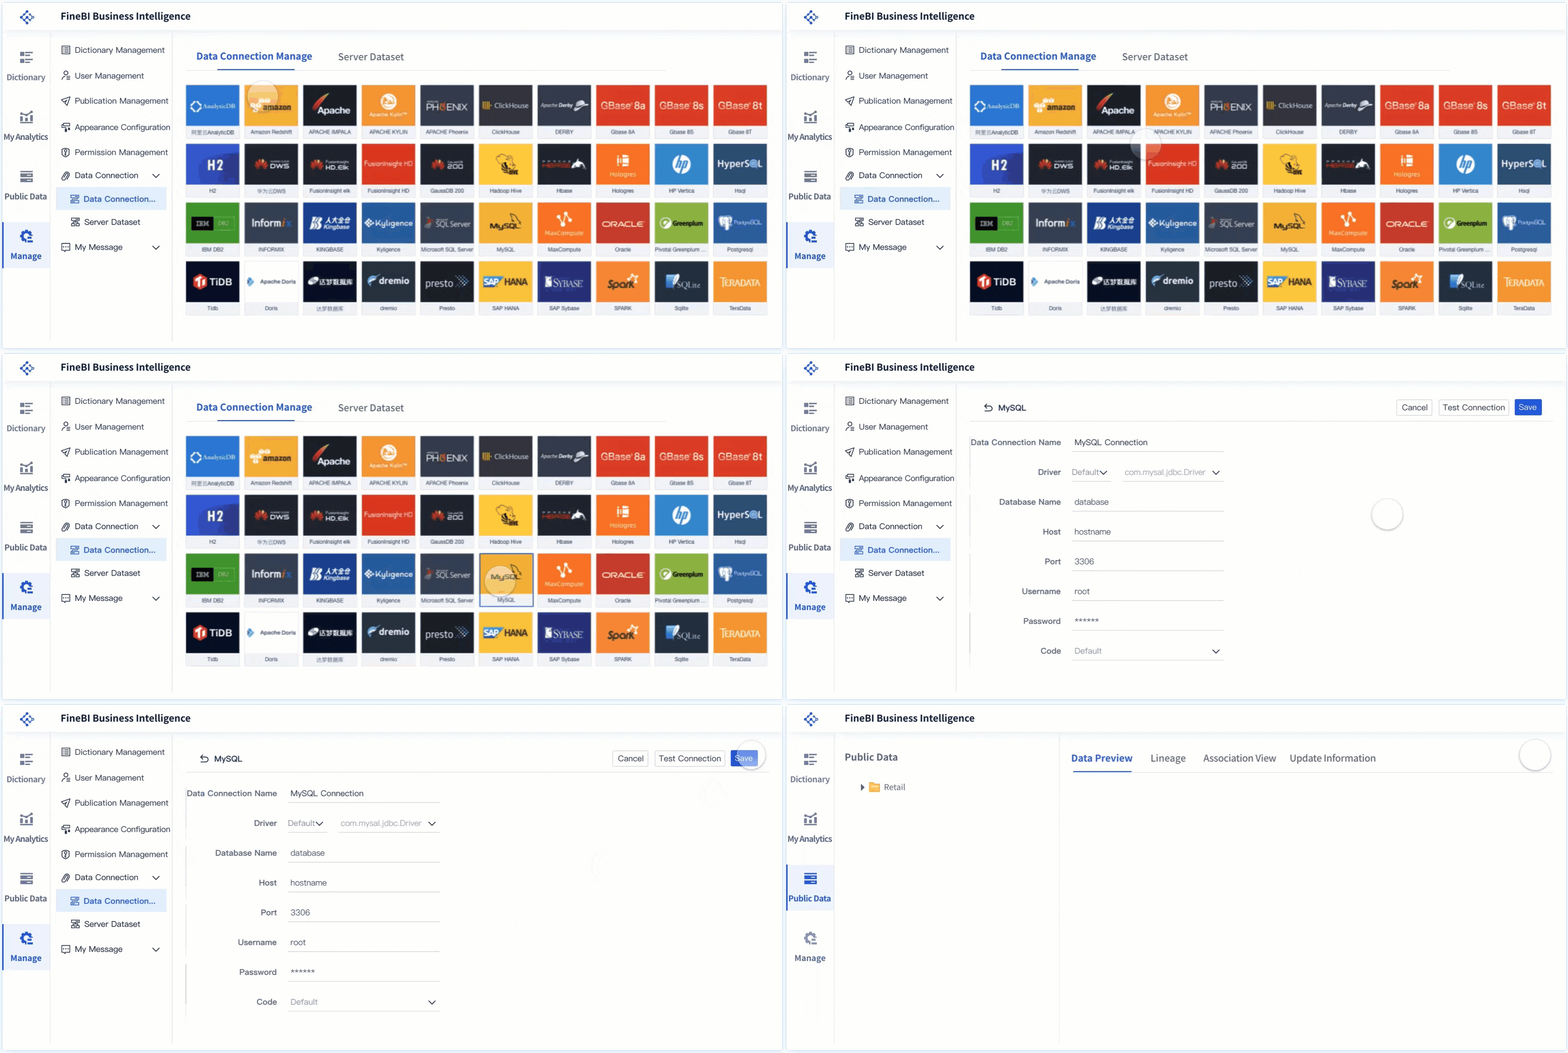 FineBI's Data Connection
FineBI can be a practical fit when a company wants to reduce the gap between technical BI teams and business consumers. Instead of positioning BI only as report delivery, it supports a more exploratory and collaborative analytics experience.
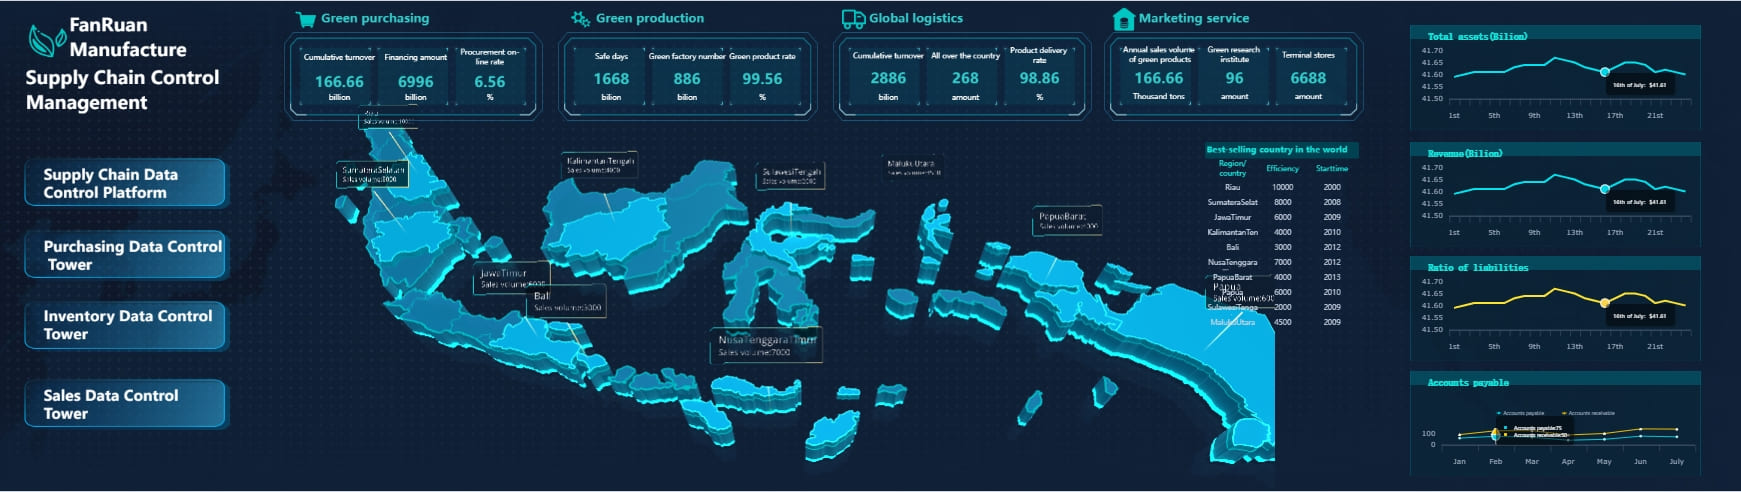
Dora extends this further as FanRuan’s enterprise Data Agent platform. It acts as an AI assistant layer on top of FineBI and existing enterprise data assets. Together, FineBI + Dora help organizations move from simply reading dashboards to enabling governed AI-assisted analysis.
That includes workflows such as:
- Natural-language requests
- Trusted metric access through a semantic foundation
- Governed query or skill execution
- Answers, charts, summaries, alerts, and follow-up actions
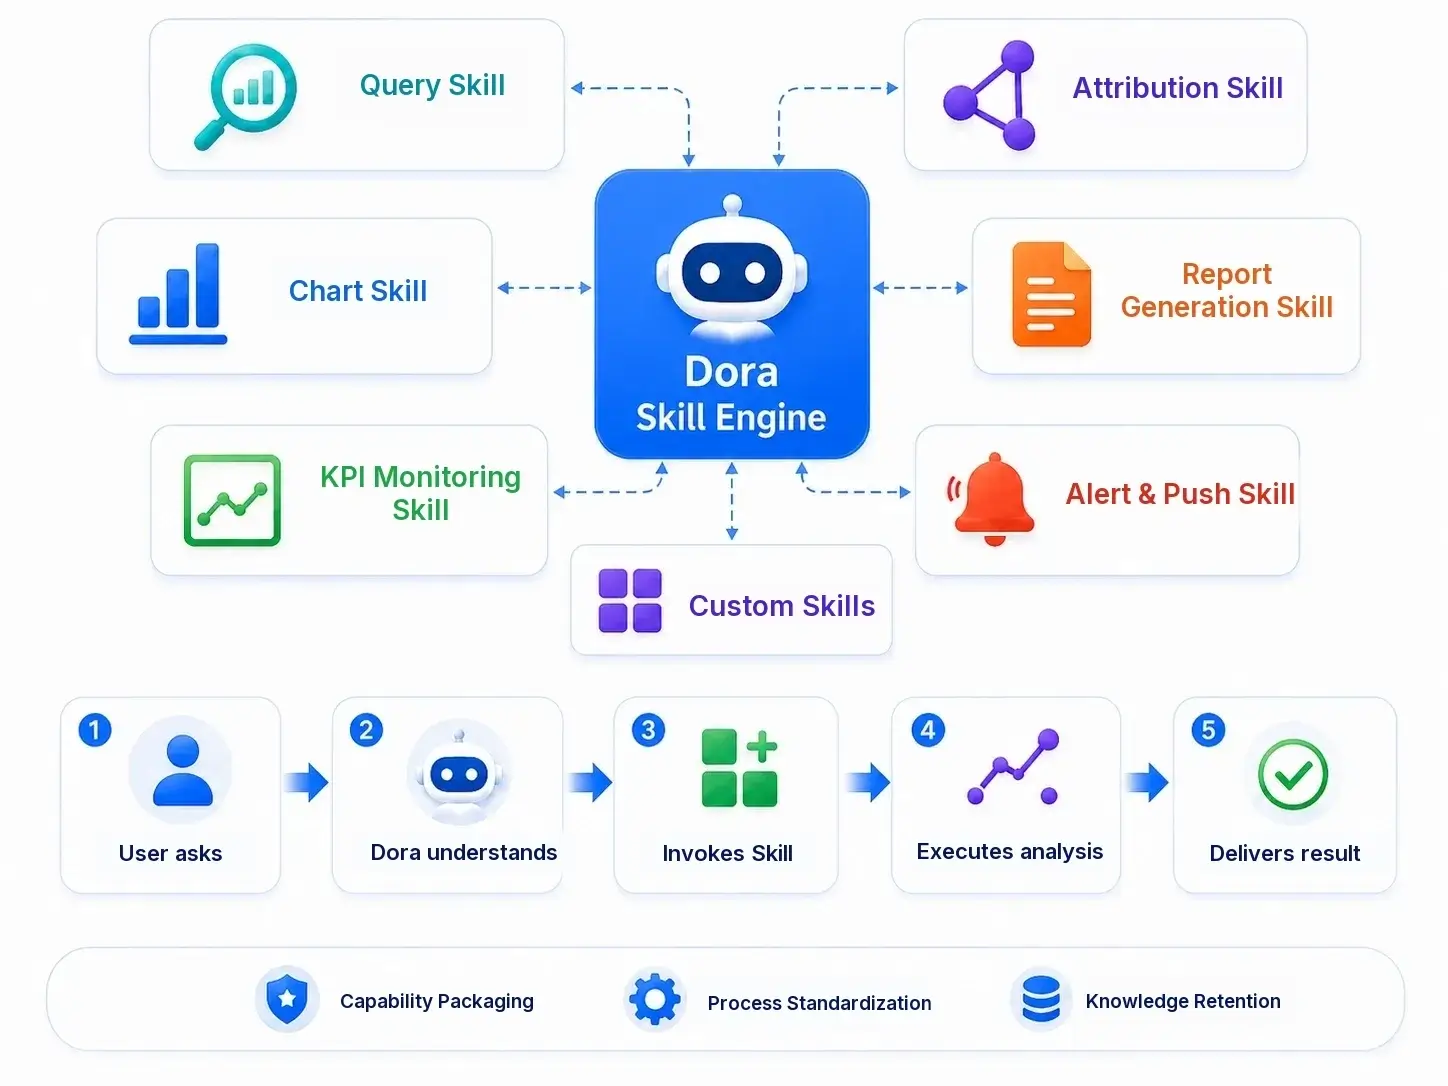 Dora is powered by skills
This is best understood as Agentic BI, where FineBI provides the trusted dashboard and metric foundation, while Dora acts as a scenario-specific AI assistant or AI digital employee. Depending on the use case, Dora can support roles such as a:
- Data Analyst digital employee
- Report Researcher
- Daily Briefing Secretary
- Risk Alert Officer
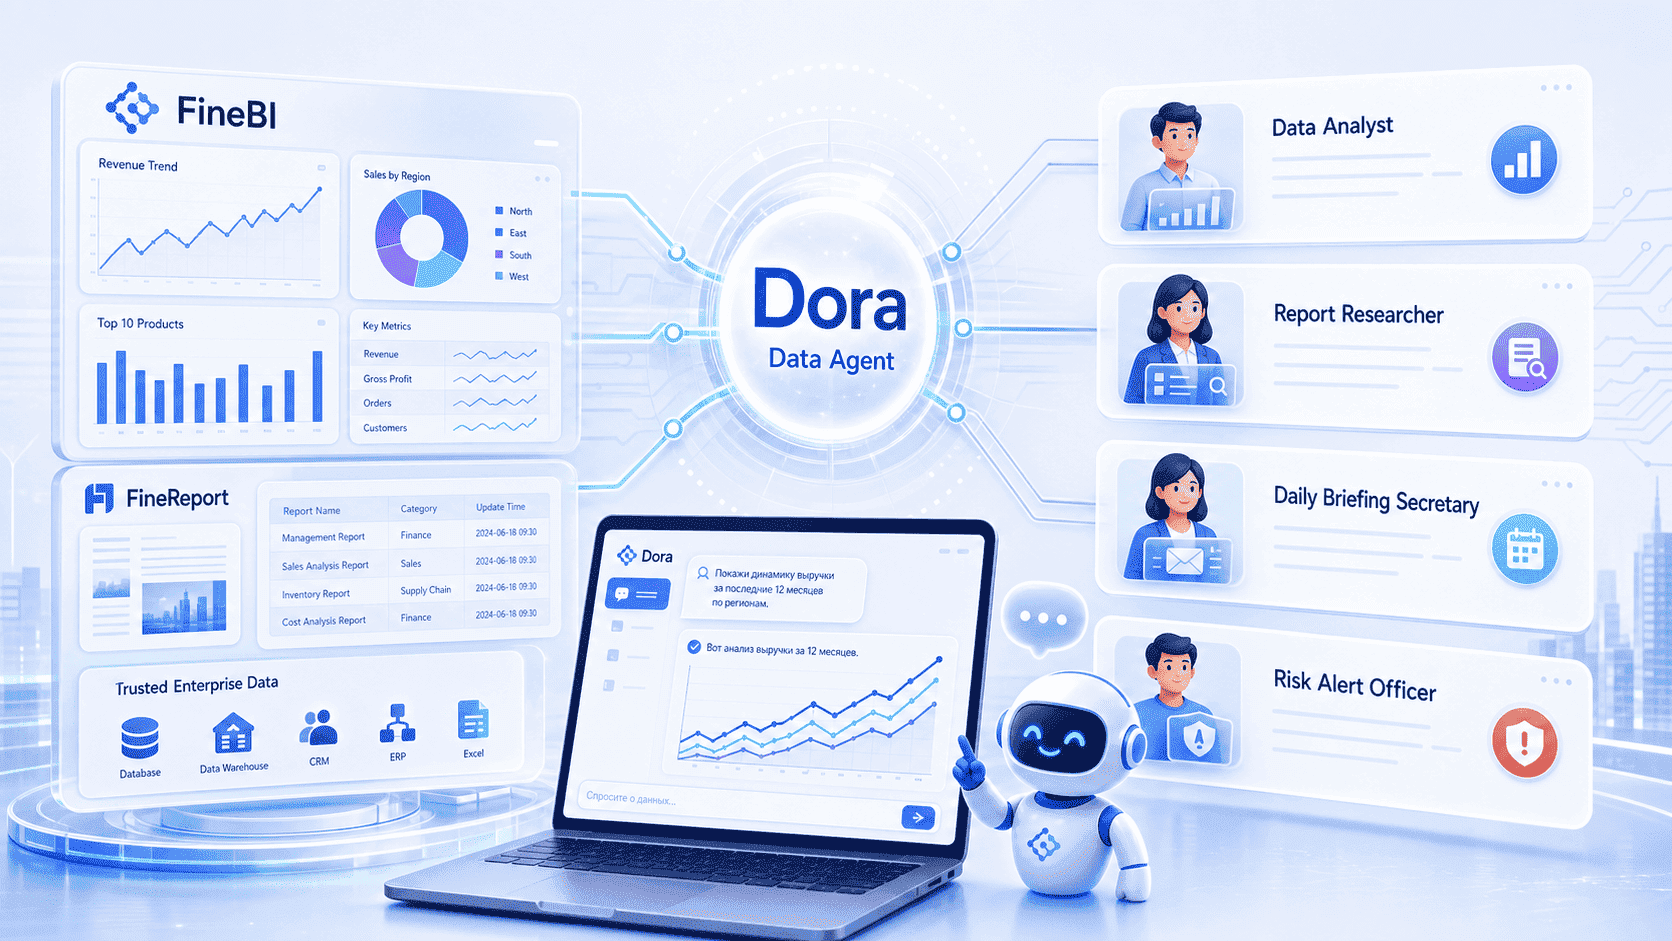
For enterprises that already have trusted BI or data assets, Dora can also be considered independently. Still, it is more accurate to think of Dora as complementing governed analytics rather than replacing the BI foundation.

Get Ready-to-Use Dashboard Templates in Fine Gallery
Final Thoughts
The best way to prepare for power bi interview questions is to stop thinking in terms of one generic question bank. In 2026, the strongest candidates are the ones who can show role fit.
- A Data Analyst should prove reporting clarity and business insight.
- A BI Developer should prove model quality, DAX depth, and performance judgment.
- A Power BI Admin should prove governance, security, and platform reliability.
If you prepare your answers around real project stories, trade-offs, and measurable outcomes, you will stand out more than candidates who only memorize definitions.
And if your career or team is also exploring broader BI capabilities beyond Power BI, platforms like FineBI + Dora are worth understanding for self-service analytics, governed dashboards, and AI-assisted enterprise data workflows.
FAQs
Most interviews focus on data modeling, DAX, report design, refresh, relationships, and performance. For admin roles, governance, security, gateways, and tenant settings are also common.