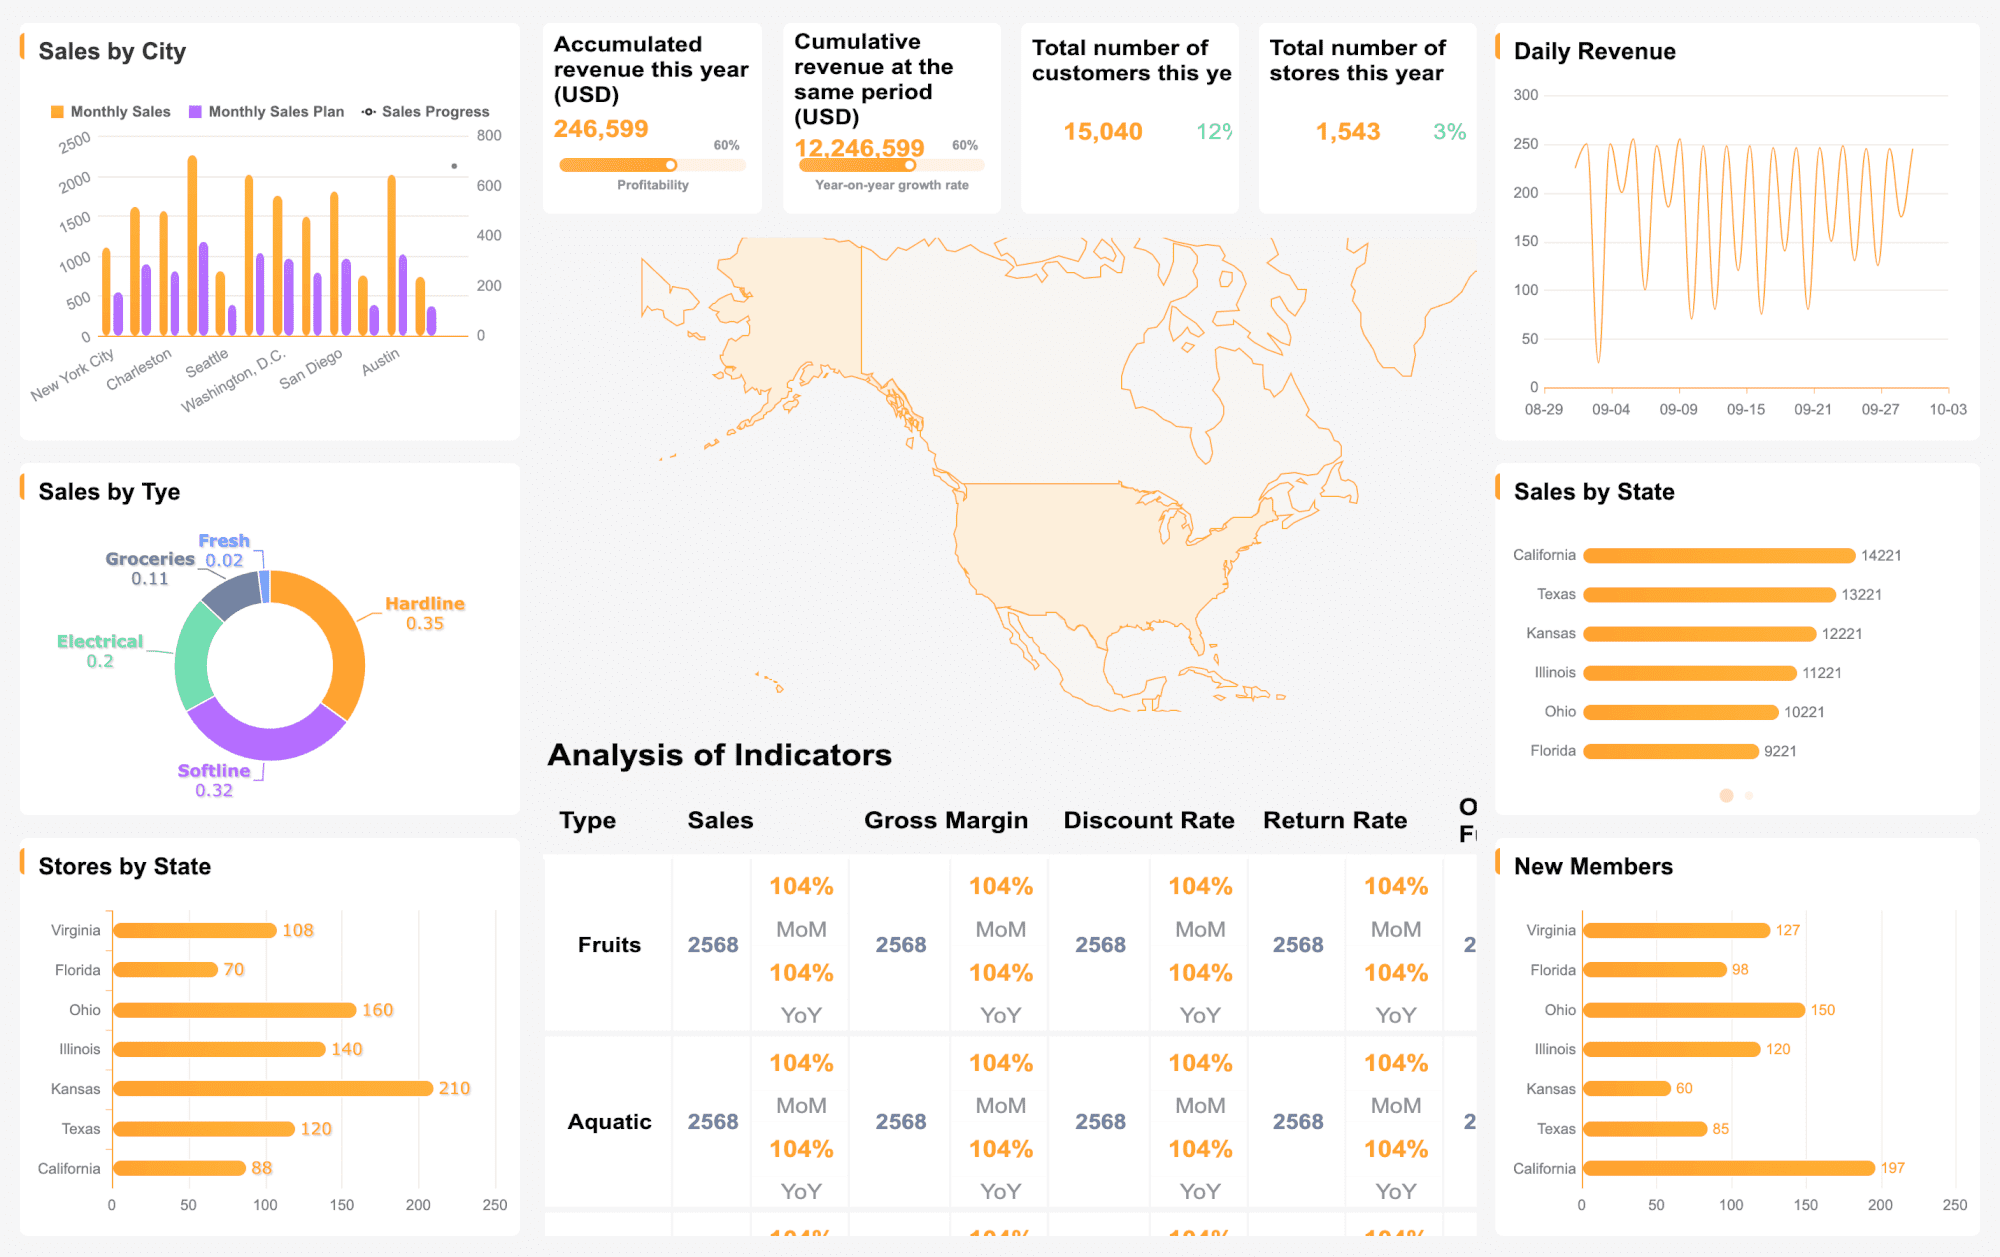
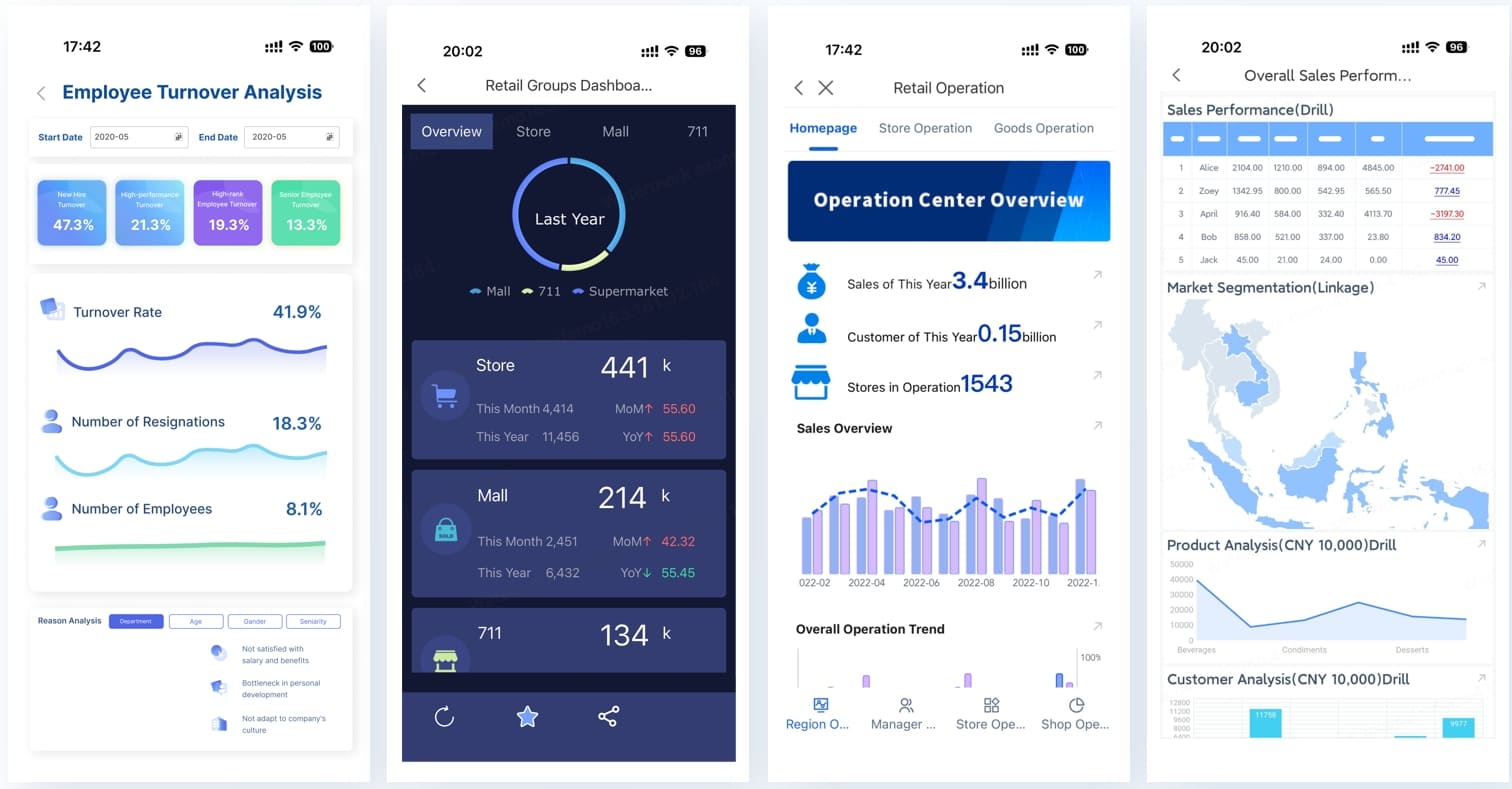
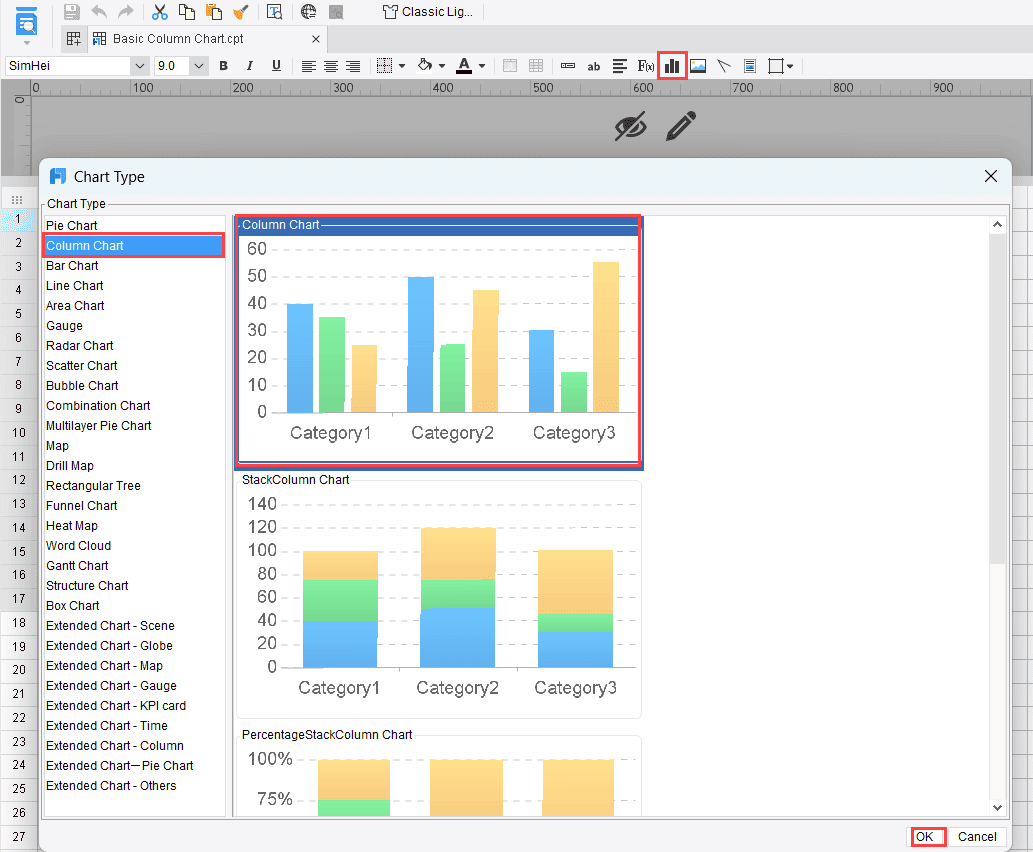
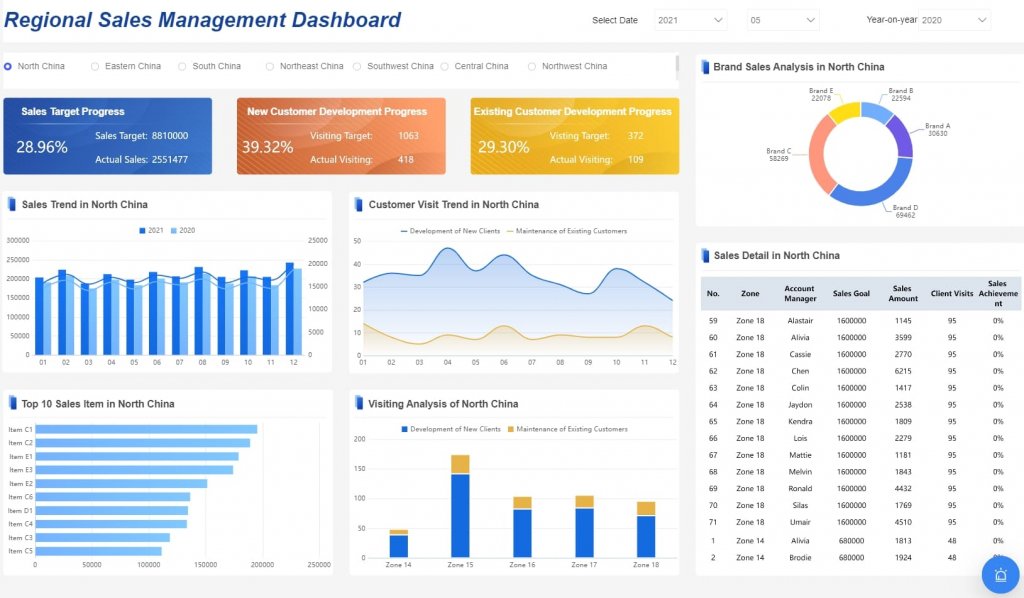
An executive online marketing report is not a channel dashboard with more charts. It is a decision tool that shows leadership how marketing spend translates into pipeline, revenue, efficiency, and forecasted business impact. If your CMO, CFO, or operations director still has to ask, “So what does this mean for growth?” after reading your report, the report is failing. The goal is simple: connect campaign activity to outcomes executives care about, surface risk early, and recommend what to do next.
Click To Try The Dashboard
All reports in this article are built with FineReport
What an executive online marketing report should accomplish
A strong executive online marketing report translates marketing execution into commercial performance. It helps leadership understand whether current investments are creating qualified demand, accelerating pipeline, and improving revenue outcomes.
Unlike operational reports built for channel managers, executive reporting must stay focused on business decisions. That means less attention on isolated metrics and more emphasis on performance against target, material changes, risks, and opportunities.
At a practical level, executive-level reporting should do three things well:
Show business impact: connect campaigns to pipeline, bookings, and customer growth
Highlight variance: explain what is above plan, below plan, or trending off target
Support action: recommend where to increase investment, fix leakage, or reallocate budget
Executive reporting vs channel-level reporting
This distinction matters. Many teams mistake a detailed paid media or social dashboard for an executive report. They are not the same thing.
Channel-level reporting is designed for optimization:
CTR
CPC
email open rate
engagement rate
landing page bounce rate
Executive-level reporting is designed for allocation and strategy:
sourced pipeline
influenced revenue
CAC
ROAS
conversion efficiency across the funnel
forecasted revenue contribution
If channel metrics do not explain movement in pipeline or revenue, they belong in supporting sections, not in the top summary.
Start with revenue goals, attribution, and reporting scope
Before you build a report layout, define the commercial logic behind it. This is where many reporting projects fail: teams jump into charts before agreeing on the revenue questions, KPI definitions, and attribution rules.
Identify the business questions leadership wants answered
Start by asking what executives actually need from the report. Most leadership teams are not looking for more data. They want fast answers to a small set of high-impact questions:
Are we on track to hit revenue and pipeline targets?
Which marketing channels are creating the strongest commercial return?
Where is spend underperforming?
What risks could affect quarterly outcomes?
What action should we take now?
Your reporting scope should align with the planning cadence leadership uses:
Weekly: active campaign pacing, early performance shifts, budget risks
Choose the metrics that connect campaign performance to revenue
A high-value online marketing report does not overload executives with every available KPI. It prioritizes the handful of metrics that link marketing activity to revenue generation.
Key Metrics (KPIs)
Sourced Pipeline: Total pipeline value created directly by marketing-originated leads or opportunities.
Influenced Revenue: Closed revenue where marketing played a measurable role in the buyer journey.
Customer Acquisition Cost (CAC):Total sales and marketing cost required to acquire one new customer.
Conversion Rate: Percentage of users or leads that move to the next stage or complete the target action.
Return on Ad Spend (ROAS): Revenue generated for each unit of paid media spend.
Marketing Qualified Leads (MQLs): Leads that meet agreed qualification criteria and are ready for sales review or nurture progression.
Sales Accepted Leads (SALs) / Sales Qualified Leads (SQLs): Qualified leads accepted by sales, useful for showing funnel health beyond top-of-funnel volume.
Pipeline Velocity: The speed at which opportunities move through the funnel toward closure.
Lifetime Value (LTV): Estimated long-term revenue generated by an acquired customer.
LTV:CAC Ratio: A key efficiency measure showing whether acquisition economics are sustainable.
Spend Pacing: Actual spend against budget plan for the reporting period.
Forecasted Revenue Contribution: Expected revenue outcome if current trends and conversion assumptions continue.
Executives should also see the difference between:
Set attribution rules and data sources before building the report
Attribution confusion destroys trust. If marketing, sales, and finance each use different definitions, the report becomes politically difficult and operationally unreliable.
Before building the report, document:
which attribution model is being used
how conversions are tracked across paid, organic, email, social, referral, and partner channels
which systems are the source of truth
where data gaps exist
how confidence levels should be interpreted
Typical data inputs include:
ad platforms
web analytics
CRM
marketing automation
e-commerce or order systems
finance systems for revenue validation
Be explicit about limitations. For example, influenced revenue may include a broader set of touchpoints than sourced pipeline. Branded search conversions may overstate incremental impact if not interpreted carefully. Offline touchpoints may be partially undercounted.
Executives do not read reports linearly. They scan, compare, and decide. Your report structure should reflect that behavior.
Build a one-page summary first
The first page should work as a stand-alone executive brief. If leadership sees only one page, they should still understand performance, implications, and next steps.
Include:
top 3 takeaways
revenue and pipeline impact
target vs actual scorecard
major changes from prior period
key risk or opportunity flags
recommended actions
A concise scorecard should show:
Target
Actual
Variance
Trend direction
This makes the report easy to interpret in less than two minutes.
Organize supporting sections by business impact
Supporting sections should follow business logic, not platform logic. Instead of dividing the report only by Google Ads, Meta, email, and SEO, group findings around executive concerns.
Recommended structure:
Demand generation
Pipeline contribution
Revenue influence
Efficiency and spend
Forecast and risk
This keeps the story tied to outcomes rather than tool silos.
Turn metrics into a narrative
A report without interpretation is just a dashboard export. Executives need the story behind the numbers:
What changed?
Why did it change?
Is the shift temporary or structural?
What should we do next?
For example, if conversion rate dropped, explain whether the issue came from weaker lead quality, landing page friction, rising media costs, or delayed sales follow-up. If paid social spend increased but pipeline did not, say whether that reflects audience saturation, poor creative-market fit, or a long conversion cycle that has not yet matured.
The narrative should be short, direct, and action-oriented.
Include the sections executives expect to see
Most executive stakeholders expect a consistent structure. When the report is predictable, it becomes easier to compare periods and identify movement quickly.
Revenue and pipeline contribution
This is the heart of the report. Show how marketing contributed to qualified leads, opportunities, pipeline, and closed revenue.
Essential views include:
pipeline created by channel
influenced revenue by campaign group
opportunity creation trend
conversion rate across key funnel stages
performance vs plan, prior period, and year-over-year
Keep the language commercial. Rather than saying “campaign engagement improved,” say “email nurture campaigns increased opportunity creation by 14%, supporting stronger mid-funnel velocity.”
Channel and campaign performance
This section should summarize which channels are worth scaling and which require correction. The emphasis is not on vanity metrics. It is on return and efficiency.
A useful executive view includes:
top-performing channels by pipeline and revenue
underperforming channels by cost efficiency
campaign groups with strongest ROAS
spend concentration by channel
notable shifts in conversion behavior
Common channel categories:
paid search
paid social
organic search
email
social
partnerships
display
affiliate
referral
When possible, show both scale and efficiency. A channel with moderate ROAS but high volume may matter more than a small high-efficiency channel with limited growth potential.
Budget, efficiency, and forecast
Executives want to know whether marketing is spending wisely and whether current trends will deliver target outcomes.
Include:
total spend vs budget
spend pacing by month or quarter
CAC trend
ROAS trend
expected pipeline or revenue outcome if current performance continues
scenarios for reallocation
This section is where you flag issues early. If one channel is absorbing budget but producing weak downstream conversion, say so clearly. If reallocating 10% of spend could improve forecasted pipeline, quantify the expected gain.
Use templates, dashboards, and examples without losing strategic clarity
Templates can accelerate delivery, but they should not dictate strategy. The best executive report design starts with the decision-making needs of leadership, then uses templates to speed up execution.
Adapt proven marketing report formats to your executive audience
Borrow the useful elements from common report templates:
KPI scorecards
trend charts
variance tables
funnel views
channel comparison matrices
But remove low-value detail. An executive report does not need long tables of ad set metrics unless they support a material conclusion. Put tactical detail in appendices or drill-down views for operating teams.
Business outcomes should appear before channel mechanics. That sequencing is what separates executive reporting from generic marketing dashboards.
Build a reporting workflow your team can maintain
A report is only as good as the process behind it. If it depends on manual exports, spreadsheet stitching, and last-minute commentary, it will become inconsistent fast.
A maintainable workflow should define:
KPI definitions
source systems
data refresh cadence
report owners
review checkpoints
commentary contributors from marketing, sales, and finance
This creates a repeatable operating rhythm and reduces reporting friction over time.
Benchmark responsibly and keep the report current
Benchmarks can be useful for context, but they should never replace business-specific goals. Industry averages vary widely by channel, region, pricing model, and sales cycle.
Use benchmarks to answer:
Are we broadly efficient or inefficient?
Are acquisition costs moving in the wrong direction?
Are conversion assumptions still realistic?
Then anchor final judgment to internal targets and revenue objectives.
Common mistakes and how to improve executive reporting over time
Most weak executive reporting suffers from the same patterns. Avoiding them will immediately improve trust and usability.
Common mistakes
Too many vanity metrics: impressions, clicks, and followers without revenue context
No interpretation: dashboards presented without explanation or recommendation
No target comparison: performance shown without plan, benchmark, or variance
Broken attribution logic: inconsistent definitions between systems
Overly complex visuals: too many colors, labels, or chart types
No feedback loop: report stays static even when leadership questions repeat every cycle
This keeps executives focused while preserving drill-down capability for operators.
3. Standardize commentary
Require every reporting section to answer:
What happened?
Why did it happen?
What should we do next?
That discipline improves clarity immediately and prevents vague summaries.
4. Automate data integration early
If your team is still manually merging platform exports with CRM and finance data, scale and trust will remain limited. Centralized, automated reporting reduces delays, improves consistency, and frees analysts to focus on interpretation rather than collection.
5. Review report usefulness, not just report accuracy
Accurate data is necessary but not sufficient. Measure whether the report leads to better decisions:
Building this manually is complex; use FineReport to utilize ready-made templates and automate this entire workflow.
FineReport helps enterprise teams turn fragmented marketing, CRM, and revenue data into executive-ready dashboards and reports without relying on endless spreadsheet work. Instead of rebuilding the same online marketing report every cycle, you can standardize KPI definitions, automate refreshes, create drill-down views for different stakeholders, and present leadership with a clear revenue story.
This is especially valuable when your reporting process involves multiple departments. Marketing needs campaign data, sales needs opportunity visibility, finance needs trusted revenue numbers, and leadership needs a clean summary. FineReport supports that reporting chain with flexible dashboard design, data integration, and reusable executive templates.
Get Ready-to-Use Dashboard Templates in Fine Gallery
If your team wants to move from fragmented channel reporting to revenue-centered executive reporting, the next step is not adding more slides. It is building a reporting system leadership can trust and act on.
It should focus on business outcomes such as sourced pipeline, influenced revenue, CAC, ROAS, conversion efficiency, and forecasted revenue contribution. The report should also show target variance, key risks, and recommended next actions.
A dashboard usually shows current performance data in real time, while an executive report explains what happened, why it matters, and what leadership should do next. Executive reporting is built for decisions, not just monitoring.
The most important metrics are the ones that tie activity to financial outcomes, including sourced pipeline, influenced revenue, CAC, ROAS, LTV to CAC ratio, and funnel conversion rates. Supporting leading indicators like MQL growth and demo requests can help explain future revenue movement.
Most teams use a weekly, monthly, and quarterly rhythm depending on the decision cycle. Weekly reports help with pacing and risk detection, monthly reports support performance review, and quarterly reports guide budget allocation and forecasting.
Attribution rules determine how marketing credit is assigned across channels and campaigns, which directly affects reported pipeline and revenue impact. Without clear rules, executives may see inconsistent numbers and lose trust in the report.
Product Trial
FineReport
Pixel-perfect reports · Interactive dashboards · Easy data entry · Digital twins