Modern business report design trends matter because reports are no longer just static documents—they are decision tools. For finance leaders, operations directors, strategy teams, and reporting managers, poor report design creates friction: key insights get buried, stakeholders lose confidence, and action slows down. Whether you are producing an annual report for investors, a sales report for regional leaders, an ESG report for regulators and stakeholders, or an internal strategy report for executives, the design must help readers find meaning fast, trust the data, and act with clarity.
All reports in this article are built with FineReport.
Why modern business report design trends matter across report types
The best reporting teams now design for faster comprehension, higher credibility, and cross-functional usability. A modern report is not judged only by appearance. It is judged by how quickly a stakeholder can answer core questions such as: What changed? Why does it matter? What should we do next?
Design choices directly influence:
Clarity: Strong layouts reduce cognitive overload and surface the most important facts first.
Decision-making: Well-designed reports help leaders compare performance, evaluate risk, and prioritize action.
Engagement: Readers are more likely to complete and use reports that feel structured, readable, and relevant.
Reuse across channels: Modern reports must often work as PDFs, board packs, dashboards, slide decks, and digital pages.
Different report types require different emphasis. Annual reports must reassure investors and tell a coherent strategic story. Sales reports must support fast operational action. ESG reports need transparency and methodological rigor. Internal strategy reports must align teams around priorities, trade-offs, and future scenarios.
Key Metrics (KPIs) for modern report design
Below are the core elements teams should evaluate when assessing report quality:
Time to Insight: How quickly a reader can identify the main takeaway or issue.
Scanability: How easily a stakeholder can move through headings, summaries, charts, and callouts.
Data-to-Explanation Ratio: Whether visuals are supported by concise interpretation rather than left unexplained.
Consistency Score: The degree to which layouts, labels, chart styles, and terminology remain uniform.
Accessibility Compliance: Whether color contrast, typography, navigation, and labeling work for all users.
Stakeholder Relevance: How well the report is tailored to the needs of its primary audience.
Narrative Continuity: Whether each section logically builds toward conclusions and recommended actions.
Transparency Level: How clearly sources, definitions, methodologies, and limitations are presented.
Cross-Format Flexibility: How easily the report can be repurposed across print, digital, and presentation formats.
Production Efficiency: The time and manual effort required to create, update, and distribute the report.
Modern business report design trends 1–3: Stronger structure, readability, and visual hierarchy
Build reports around decision-first layouts
One of the most important modern business report design trends is the move from information-heavy layouts to decision-first structures. Instead of asking readers to work through pages before reaching the conclusion, modern reports lead with the business implications.
This means putting the most important content upfront:
Executive summary
Key findings
Material changes versus prior period
Risks and opportunities
Recommended actions
For enterprise readers, this is essential. Executives often scan before they read deeply. A decision-first layout respects that behavior while still allowing supporting detail beneath the surface.
In practice, this can include:
A one-page summary before detailed sections
Section previews that explain what the reader will learn
“What changed / why it matters / next step” callouts
Clear sequencing from insight to action
A strong annual report might open with strategic performance and outlook before detailed disclosures. A sales report might begin with missed targets, regional variance, and pipeline risks. An ESG report might surface material issues and methodology changes immediately.
Improve readability with cleaner typography and spacing
Modern report design is becoming quieter, sharper, and easier to read. The shift is away from dense text blocks, inconsistent type, and crowded page layouts. In their place, reporting teams are using clean typography systems, more intentional whitespace, and simpler page templates.
The business value is straightforward: readers absorb more when the layout reduces friction.
Best-practice readability improvements include:
Using a clear heading hierarchy
Keeping paragraphs short
Limiting font variations
Maintaining consistent spacing between sections
Using captions and labels that are easy to interpret
Designing templates that repeat predictably across the document
This is especially important in long-form reports such as annual and ESG reports, where fatigue can erode understanding. Cleaner formatting helps readers maintain focus across many pages without feeling overwhelmed.
A useful benchmark: if a page looks visually exhausting before anyone reads a word, it likely needs redesign.
Make visual hierarchy guide attention
Good reports do not just contain information—they direct attention. Modern business report design trends increasingly rely on visual hierarchy to tell readers what matters first, second, and third.
Visual hierarchy is built through:
Contrast: making important figures stand out
Alignment: keeping content organized and easy to track
Color restraint: using accent colors strategically rather than everywhere
Sectioning: separating themes clearly so readers do not lose context
Size and emphasis: enlarging summary figures, reducing supporting detail
The goal is not decoration. The goal is controlled emphasis.
For example, if revenue growth, carbon intensity, or strategic milestone completion is the lead message, that information should be visually prioritized through placement, size, and surrounding whitespace. Supporting notes can remain accessible without competing for attention.
This is one of the clearest differences between dated reports and modern ones: old reports present everything with equal weight; modern reports make priorities obvious.
Too many reports include charts that show movement but do not explain significance. Readers should never have to guess what the takeaway is. Every important chart or table should answer at least one of these questions:
What changed?
Why did it change?
Why does it matter?
What should happen next?
This does not require long commentary. Often, one concise sentence is enough.
For example:
“Q3 sales grew 12%, driven mainly by enterprise renewals in North America.”
“Scope 2 emissions declined due to energy sourcing changes rather than production reductions.”
“Operating margin compression was concentrated in two underperforming business units.”
Chart choice also matters. A familiar template is not always the right one. Use:
Line charts for trends over time
Bar charts for category comparisons
Waterfall charts for contribution analysis
Heatmaps for concentration or variance
Bullet charts for progress against target
Annotated tables when precision matters more than visual impact
Design for different stakeholders and reading behaviors
Modern reports are increasingly designed around audience behavior, not just content ownership. That is a major shift.
Investors, sales managers, ESG stakeholders, and internal executives all consume information differently:
Investors want confidence, strategic coherence, and comparable financial context.
Sales leaders want speed, variance visibility, and action triggers.
Employees and managers want alignment, direction, and practical implications.
Executives want decisions supported by concise evidence.
That means the same dataset may need different presentations depending on the audience. A board-level strategy report may emphasize scenarios, strategic trade-offs, and business implications. A field sales report from the same underlying data may emphasize target attainment, territory movement, and account-level actions.
Modern design supports both skim reading and deep review. The top layer should be fast to scan, while the next layers provide enough detail for validation and follow-up.
Use modular layouts for multi-format publishing
Another important trend is modularity. Reporting teams are under pressure to publish across PDF, presentations, dashboards, intranet pages, and external microsites. Reports designed as fixed one-off documents are expensive to maintain and difficult to adapt.
Modular design solves this by creating repeatable content blocks such as:
KPI summary tiles
Narrative insight boxes
Standard comparison charts
Risk and opportunity panels
Methodology notes
Regional or business unit snapshots
The benefit is not only visual consistency. It also improves production efficiency and governance. When sections are modular, teams can reuse them across quarterly updates, annual reporting, board briefings, and department reviews without redesigning from scratch.
For enterprises managing many reporting cycles, this is one of the highest-impact design improvements available.
Modern business report design trend 7–8: Credibility, accessibility, and brand consistency
Strengthen trust with transparent sourcing and context
Trust is a design issue as much as a data issue. Readers lose confidence when numbers appear without definitions, benchmarks, methodology, or caveats. Modern report design trends increasingly prioritize visible transparency without cluttering the main narrative.
This means making the following easy to find:
Metric definitions
Reporting periods
Comparison basis
Methodology notes
Scope boundaries
Assumptions and limitations
Benchmark references where relevant
The key is placement. Important context should be available at the point of need, not buried deep in appendices. Smart footnotes, side notes, expandable sections, and labeled methodology panels can preserve readability while strengthening trust.
This is especially important in ESG reporting, where stakeholder scrutiny is high, and in annual reporting, where investor confidence depends on precision and consistency.
Build accessible and brand-aligned report systems
Accessibility is no longer optional. It is a practical requirement for enterprise reporting and a defining feature of modern business report design trends.
Accessible report systems include:
Sufficient color contrast
Labels that do not rely on color alone
Readable font sizes
Logical heading structure
Clear navigation
Alt-friendly visual logic for digital formats
Simple, unambiguous chart labeling
Accessibility improves usability for everyone, not only for users with specific needs. It also reduces interpretation errors and strengthens professionalism.
At the same time, reports should stay aligned with the organization’s brand. But modern design avoids over-branding. Strong report systems are recognizable without becoming decorative or distracting. The best branded reports feel disciplined, not flashy.
A useful rule: brand should support trust and recognition, never compete with the message.
Modern business report design trend 9–10: Interactivity and AI-supported production workflows
Add digital elements that improve usability
As reporting shifts further into digital environments, interactivity is becoming more valuable—but only when it improves usability.
Useful digital report features include:
Clickable table of contents
Anchor links across sections
Expandable detail layers
Interactive summaries
Drill-down dashboards
Hover definitions or metric explanations
Filters for business unit, region, or timeframe
The purpose is speed. Stakeholders should be able to reach answers faster and move from summary to detail without friction.
The best interactive reports do not overwhelm readers with novelty. They use digital elements to reduce search time, clarify logic, and support self-service exploration.
This is particularly effective in sales and internal strategy reporting, where users often need to move from enterprise-level trends to departmental or regional specifics.
Use AI and automation without weakening editorial quality
AI is now influencing report production, but mature organizations are using it selectively. The right approach is not to automate judgment; it is to automate repetition.
AI and automation can help with:
Drafting first-pass summaries
Generating layout variations
Refreshing recurring report sections
Standardizing commentary structures
Detecting anomalies or missing inputs
Accelerating multilingual or multi-format production
However, enterprise reports still require human oversight for:
Accuracy
Strategic framing
Compliance
Tone
Materiality judgment
Stakeholder sensitivity
The most effective reporting teams use AI to speed execution while preserving editorial control. That balance is now one of the defining modern business report design trends, especially in organizations managing high-volume reporting cycles.
How these modern business report design trends apply to annual, sales, ESG, and internal strategy reports
Annual reports
Annual reports should combine credibility, narrative strength, and executive polish. Modern design here emphasizes:
Strong executive summary pages
Long-form storytelling with clean pacing
Investor-friendly visual hierarchy
Transparent financial and operational context
Brand alignment without excessive decoration
The design goal is confidence. Readers should feel that the organization is disciplined, transparent, and strategically coherent.
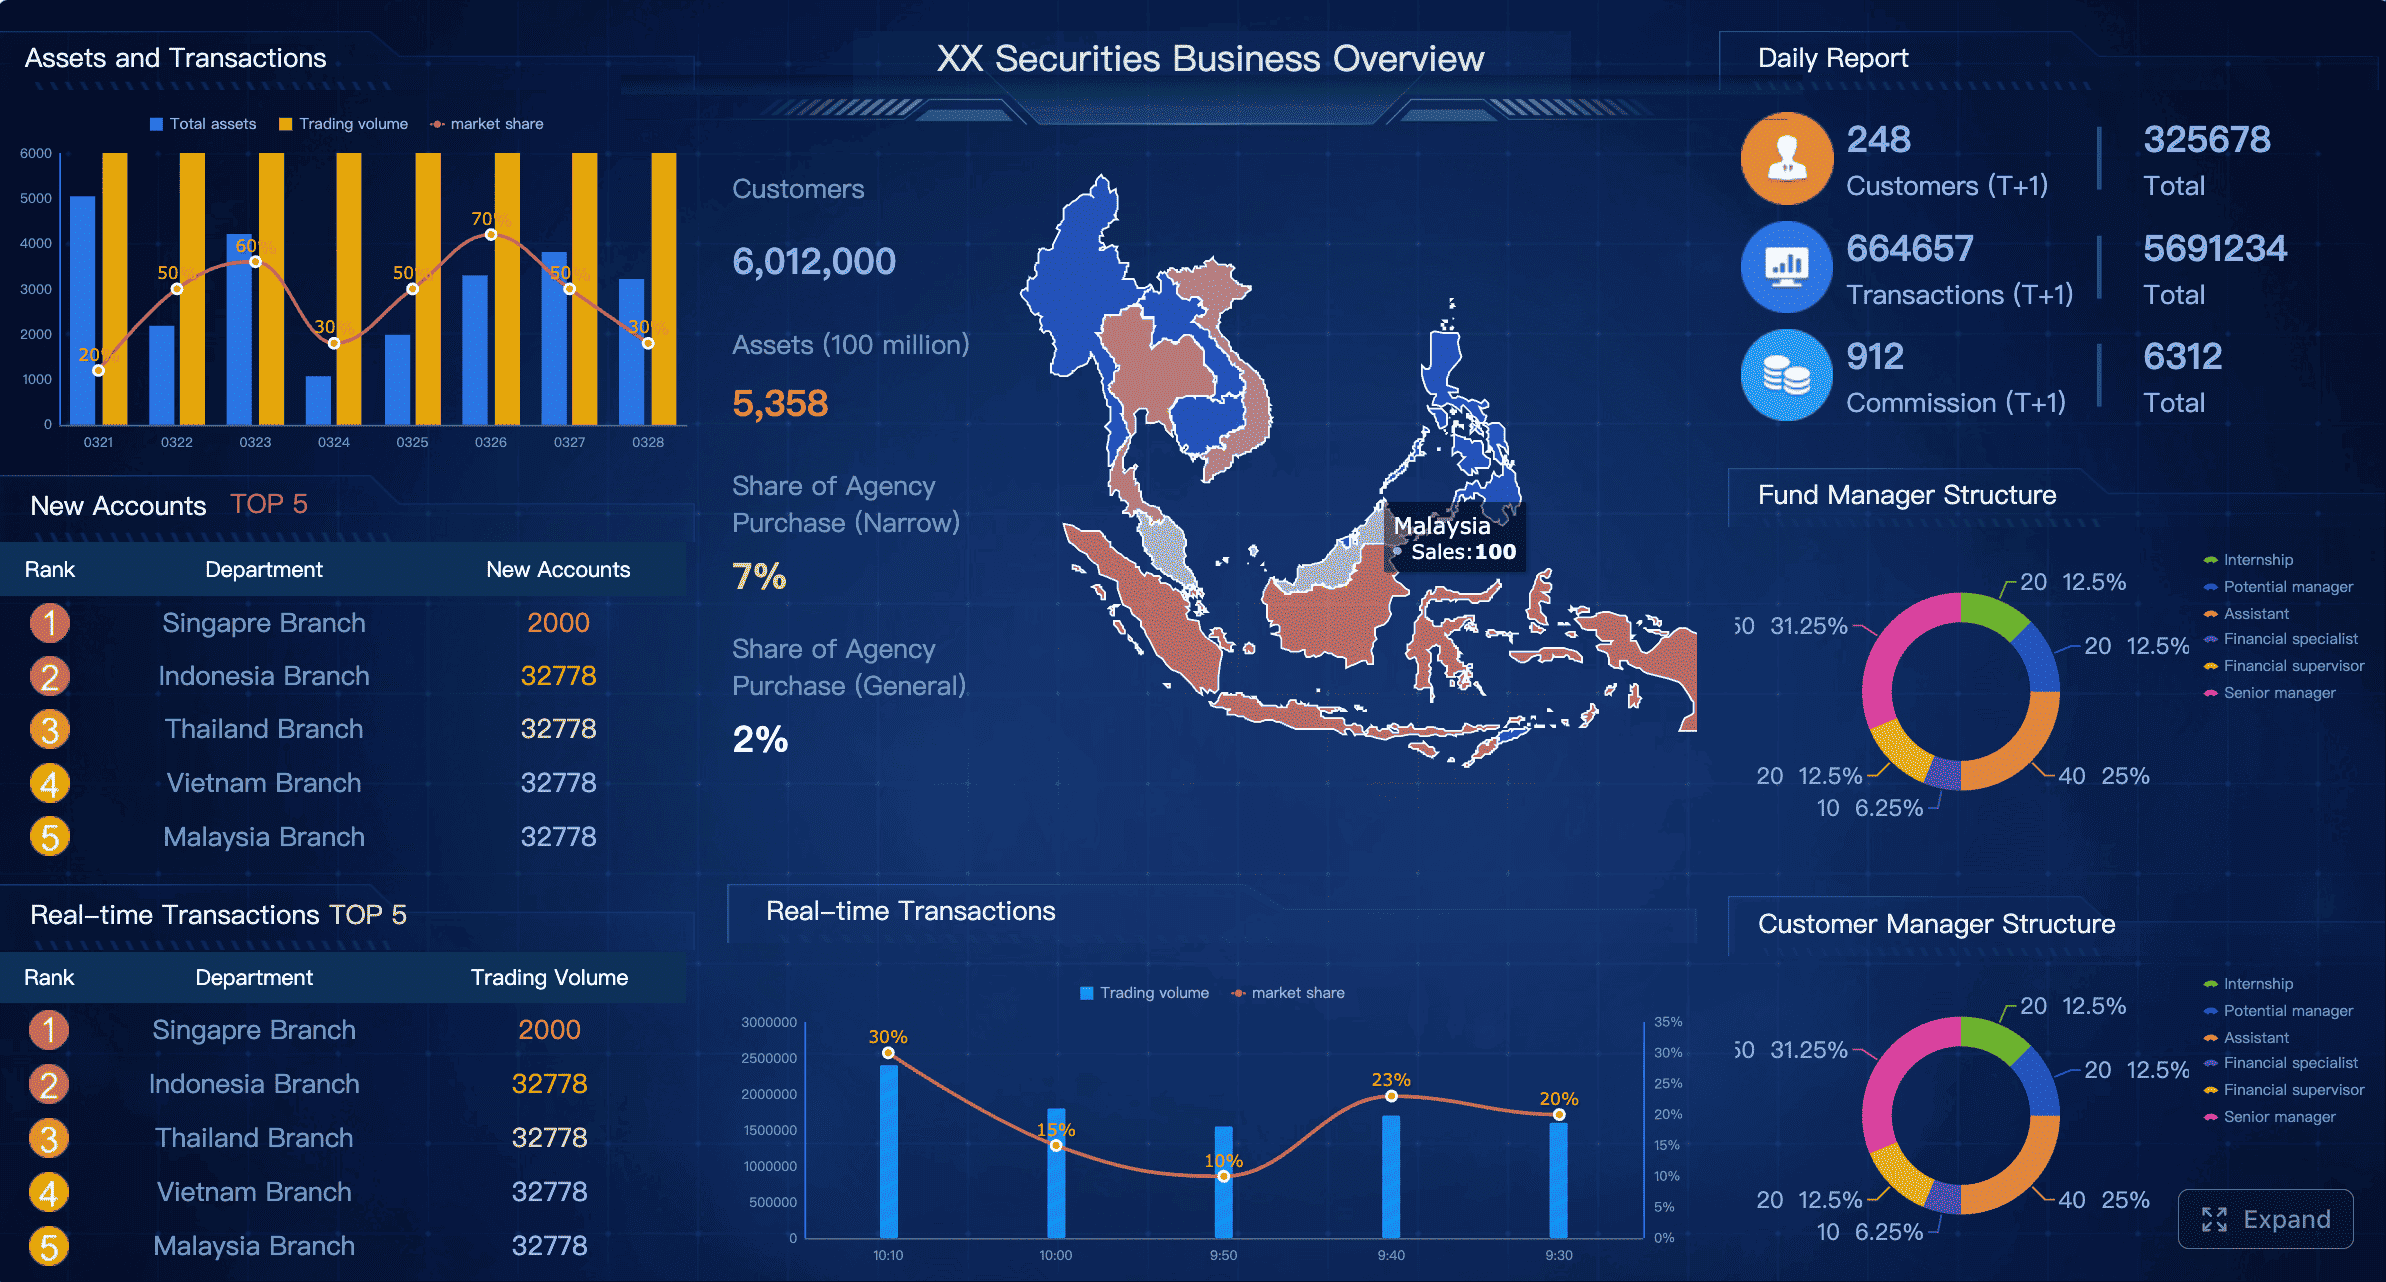
Sales reports
Sales reports must prioritize operational visibility and action. The most effective designs focus on:
Real-time or near-real-time KPI visibility
Trend comparisons by period, team, region, and product
Performance exceptions and variance analysis
Dashboard-first layouts
Clear action prompts for managers
For sales teams, speed matters more than polish alone. A beautiful report that hides performance issues is a failure.
ESG reports
ESG reports demand trust, consistency, and methodological clarity. Modern design trends in this area include:
Materiality-focused section structure
Clear disclosure logic
Definitions and methodology close to the data
Balanced use of narrative and evidence
Transparent benchmarks and scope notes
The design goal is not simply to look responsible. It is to communicate responsibility with verifiable clarity.
Internal strategy reports
Internal strategy reports support alignment and executive decision-making. Their design should emphasize:
Priorities and trade-offs
Scenario planning views
Progress against strategic initiatives
Dependencies, risks, and ownership clarity
Clear links between performance data and business choices
These reports work best when they reduce ambiguity. Leaders should quickly understand where the organization stands, what options exist, and what decisions are needed.
Actionable best practices for implementing modern business report design trends
If you want these modern business report design trends to create measurable impact, implementation needs to be disciplined. Here are five proven best practices I would recommend as a reporting consultant.
1. Start with stakeholder decisions, not content inventory
Before designing any page, identify:
Who will read this report
What decisions they need to make
Which metrics actually influence those decisions
How quickly they need to reach the takeaway
This prevents the common mistake of building reports around available data instead of business needs.
2. Create a repeatable report architecture
Define a standard framework for each report family:
Summary page
KPI overview
Trend analysis
Risk/opportunity section
Methodology notes
Action or recommendation block
A repeatable structure increases trust, reduces production time, and makes reports easier to compare over time.
3. Pair every critical visual with a clear interpretation
Do not let charts stand alone. Add one-line insight statements, directional cues, or concise commentary to explain significance. This single practice dramatically improves report usability for busy executives.
4. Build accessibility and governance into templates
Create templates that already include:
Approved color system
Heading hierarchy
Labeling rules
Footnote logic
Data definition placement
Brand standards
This reduces quality variation across teams and protects credibility at scale.
5. Automate recurring workflows, but keep human review at the end
Automate data refreshes, repetitive layouts, and standard sections wherever possible. But require final human review for message quality, compliance, and business interpretation. This is where high-performing reporting organizations separate efficiency from recklessness.
Building modern reports at scale with FineReport
Building this manually is complex; use FineReport to utilize ready-made templates and automate this entire workflow. That is the practical reality for enterprise teams managing annual, sales, ESG, and internal strategy reports across multiple departments and reporting cycles.
FineReport helps organizations operationalize modern business report design trends by making it easier to:
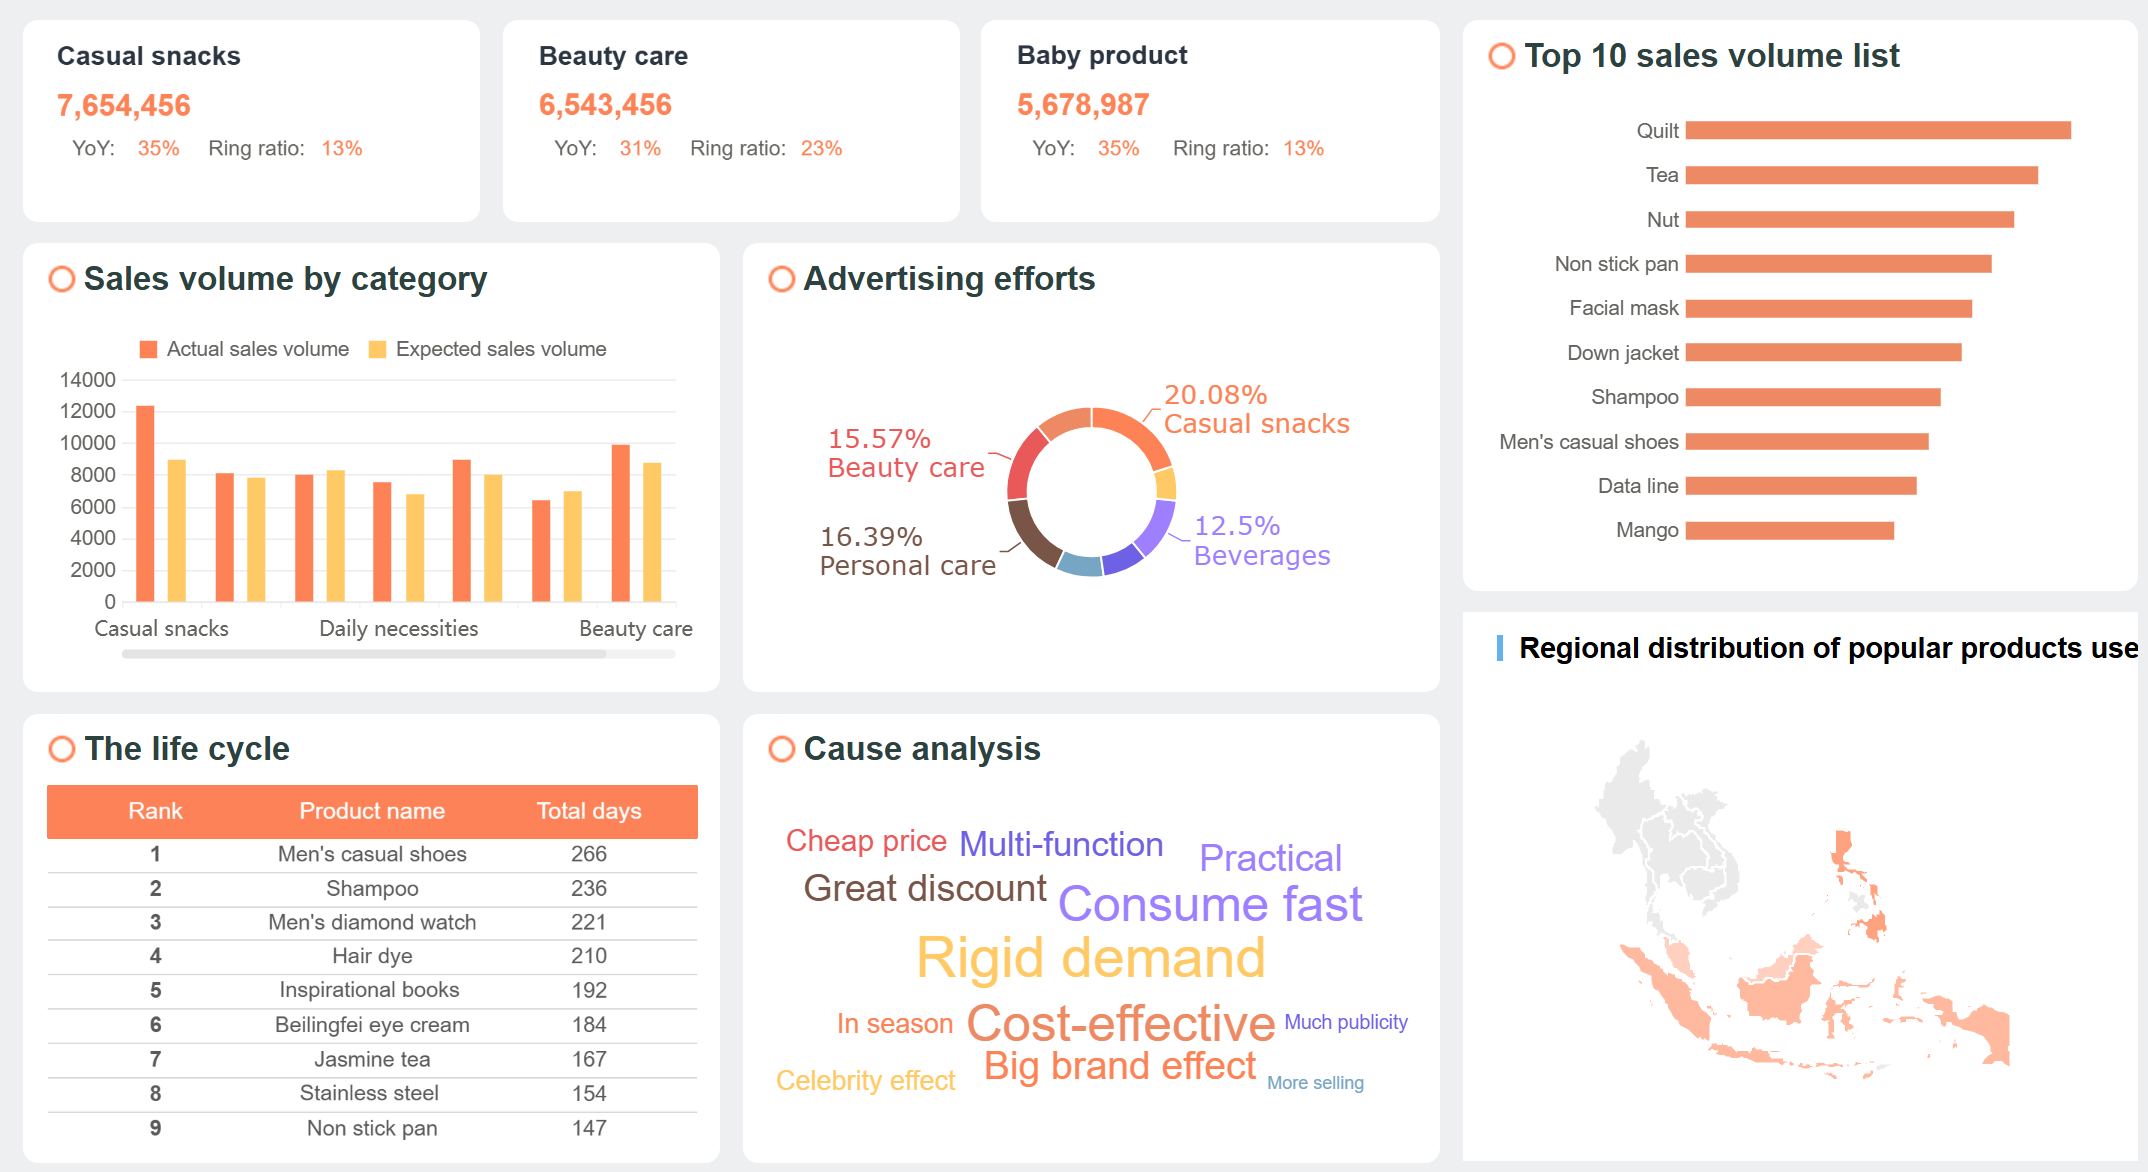
Build decision-first dashboards and report layouts
Support both executive summaries and detailed operational views
For annual reports, that means more polished and consistent reporting packs. For sales reporting, it means faster performance visibility and action-ready dashboards. For ESG reporting, it means clearer methodology communication and controlled disclosure workflows. For internal strategy reporting, it means stronger alignment through connected, executive-friendly reporting systems.
Get Ready-to-Use Modern Dashboard Templates in Fine Gallery
If your current process relies on fragmented spreadsheets, manual layout work, inconsistent visuals, and too much last-minute editing, modernizing the design alone is not enough. You also need a reporting platform that can scale those standards reliably.
Modern business report design trends focus on making reports easier to scan, easier to trust, and faster to act on. Common themes include decision-first layouts, cleaner typography, strong visual hierarchy, and designs that work across PDF, dashboard, and presentation formats.
Good report design helps stakeholders quickly see what changed, why it matters, and what action to take next. Poor design hides insights, increases confusion, and slows decisions.
Start with the most important conclusions, such as key findings, material changes, risks, and recommended actions. Then organize supporting detail underneath so readers can scan first and dive deeper when needed.
Useful metrics include time to insight, scanability, consistency, accessibility, stakeholder relevance, and production efficiency. These measures show whether a report is clear, credible, and practical to maintain.
Yes, each report type has different priorities and audiences. Annual reports emphasize strategic clarity and investor confidence, sales reports support quick operational action, ESG reports require transparency, and internal strategy reports need alignment around priorities and trade-offs.
Product Trial
FineReport
Pixel-perfect reports · Interactive dashboards · Easy data entry · Digital twins