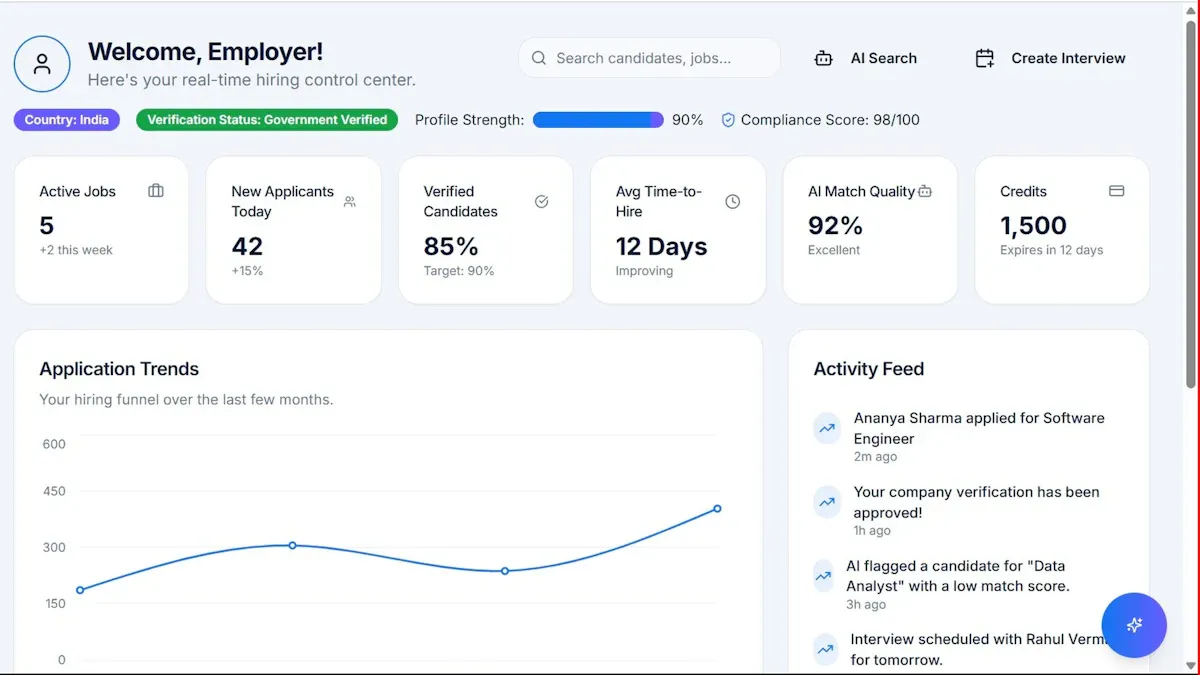
A strong performance marketing report template gives executives exactly what they need in weekly reviews: fast visibility into growth, efficiency, risk, and the next decisions that matter. For CMOs, performance leads, revenue operations managers, and marketing directors, the problem is rarely a lack of data. It is the opposite. Most teams drown leadership in channel exports, platform screenshots, and disconnected metrics that do not answer the real questions: Are we on target? What changed? What should we do next? A weekly executive report must turn raw marketing activity into decision-ready insight.
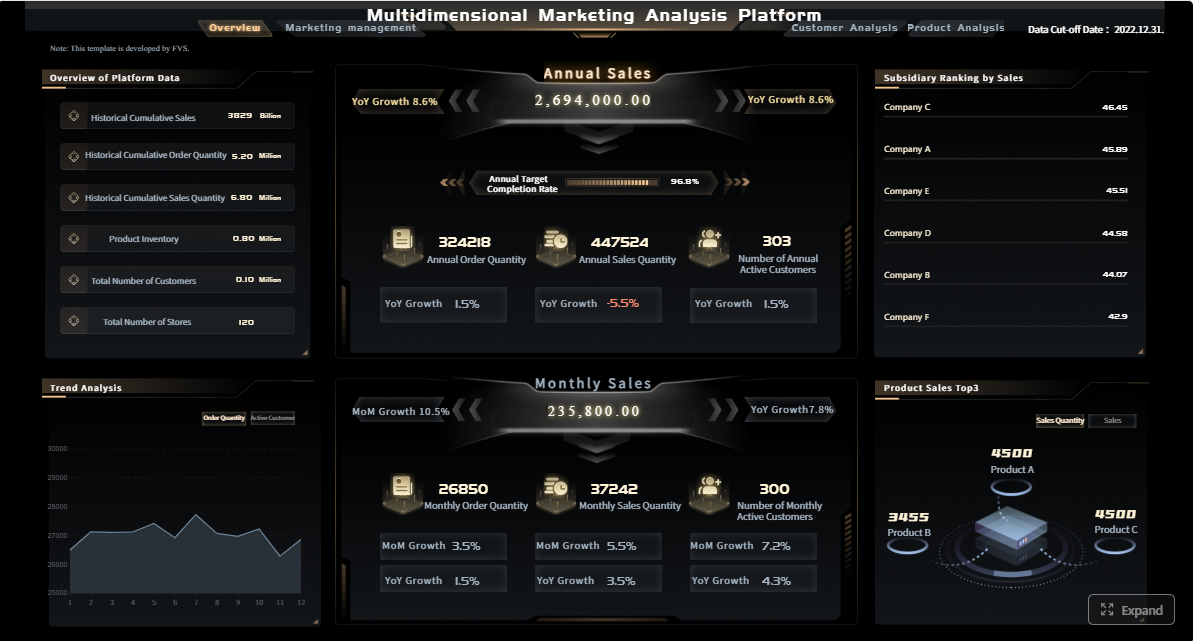 Click To Try The Dashboard
All reports in this article are built with FineReport
What a Performance Marketing Report Template Should Achieve in Weekly Executive Reviews
A weekly executive review is not a campaign log. It is a management tool. The structure should help leadership assess performance in minutes, not force them to interpret dozens of channel metrics from scratch every week.
A high-performing performance marketing report template should do three things well:
- Create immediate clarity: Show whether performance is above, below, or on target.
- Maintain consistency: Keep the same structure each week so trends are obvious.
- Drive decisions: Emphasize actions, risks, and support needed from leadership.
Key Metrics (KPIs) every weekly executive report should include
Below is the core KPI set most teams need in a leadership-facing report. The exact mix varies by business model, but the definitions should stay consistent.
- Revenue: Total revenue influenced or generated by performance marketing during the reporting period.
- Pipeline: Qualified opportunity value created from marketing-sourced or marketing-assisted demand.
- Leads: Total new leads generated, typically segmented by source or qualification stage.
- CAC: Customer acquisition cost, measuring total acquisition spend divided by new customers acquired.
- ROAS: Return on ad spend, showing revenue generated for every unit of advertising spend.
- CPA: Cost per acquisition or cost per action, used to evaluate efficiency at a conversion level.
- Conversion Rate: Percentage of users who completed the target action from click to lead, lead to opportunity, or opportunity to sale.
- Spend: Total paid media investment for the week and its pacing versus plan.
- CPC: Cost per click, useful for monitoring traffic cost changes and auction pressure.
- CPM: Cost per thousand impressions, often used to interpret reach efficiency and media inflation.
- Lead-to-Opportunity Rate: Measures lead quality and sales progression.
- Opportunity-to-Customer Rate: Reveals downstream conversion effectiveness and funnel health.
These KPIs make the report useful for executives because they connect media activity to business outcomes, not just platform performance.
1. Executive Summary and Top-Line Performance
The first section of any performance marketing report template should answer the executive question: "What happened this week, and what do I need to know now?"
Snapshot of this week’s most important outcomes
This summary should fit into a concise block at the top of the report. Avoid writing a narrative paragraph when three to five bullets will do the job better.
Include:
- Overall status versus target
- The biggest positive movement
- The largest risk or gap
- The immediate recommendation
A useful executive snapshot might look like this in practice:
- Revenue finished 8% above weekly target, driven by stronger branded search conversion.
- Paid social leads increased 22% week over week, but lead quality declined.
- CAC rose 11% due to higher display spend and lower landing page conversion.
- Recommendation: shift budget from low-efficiency prospecting display into high-intent search and retargeting.
Key business metrics at a glance
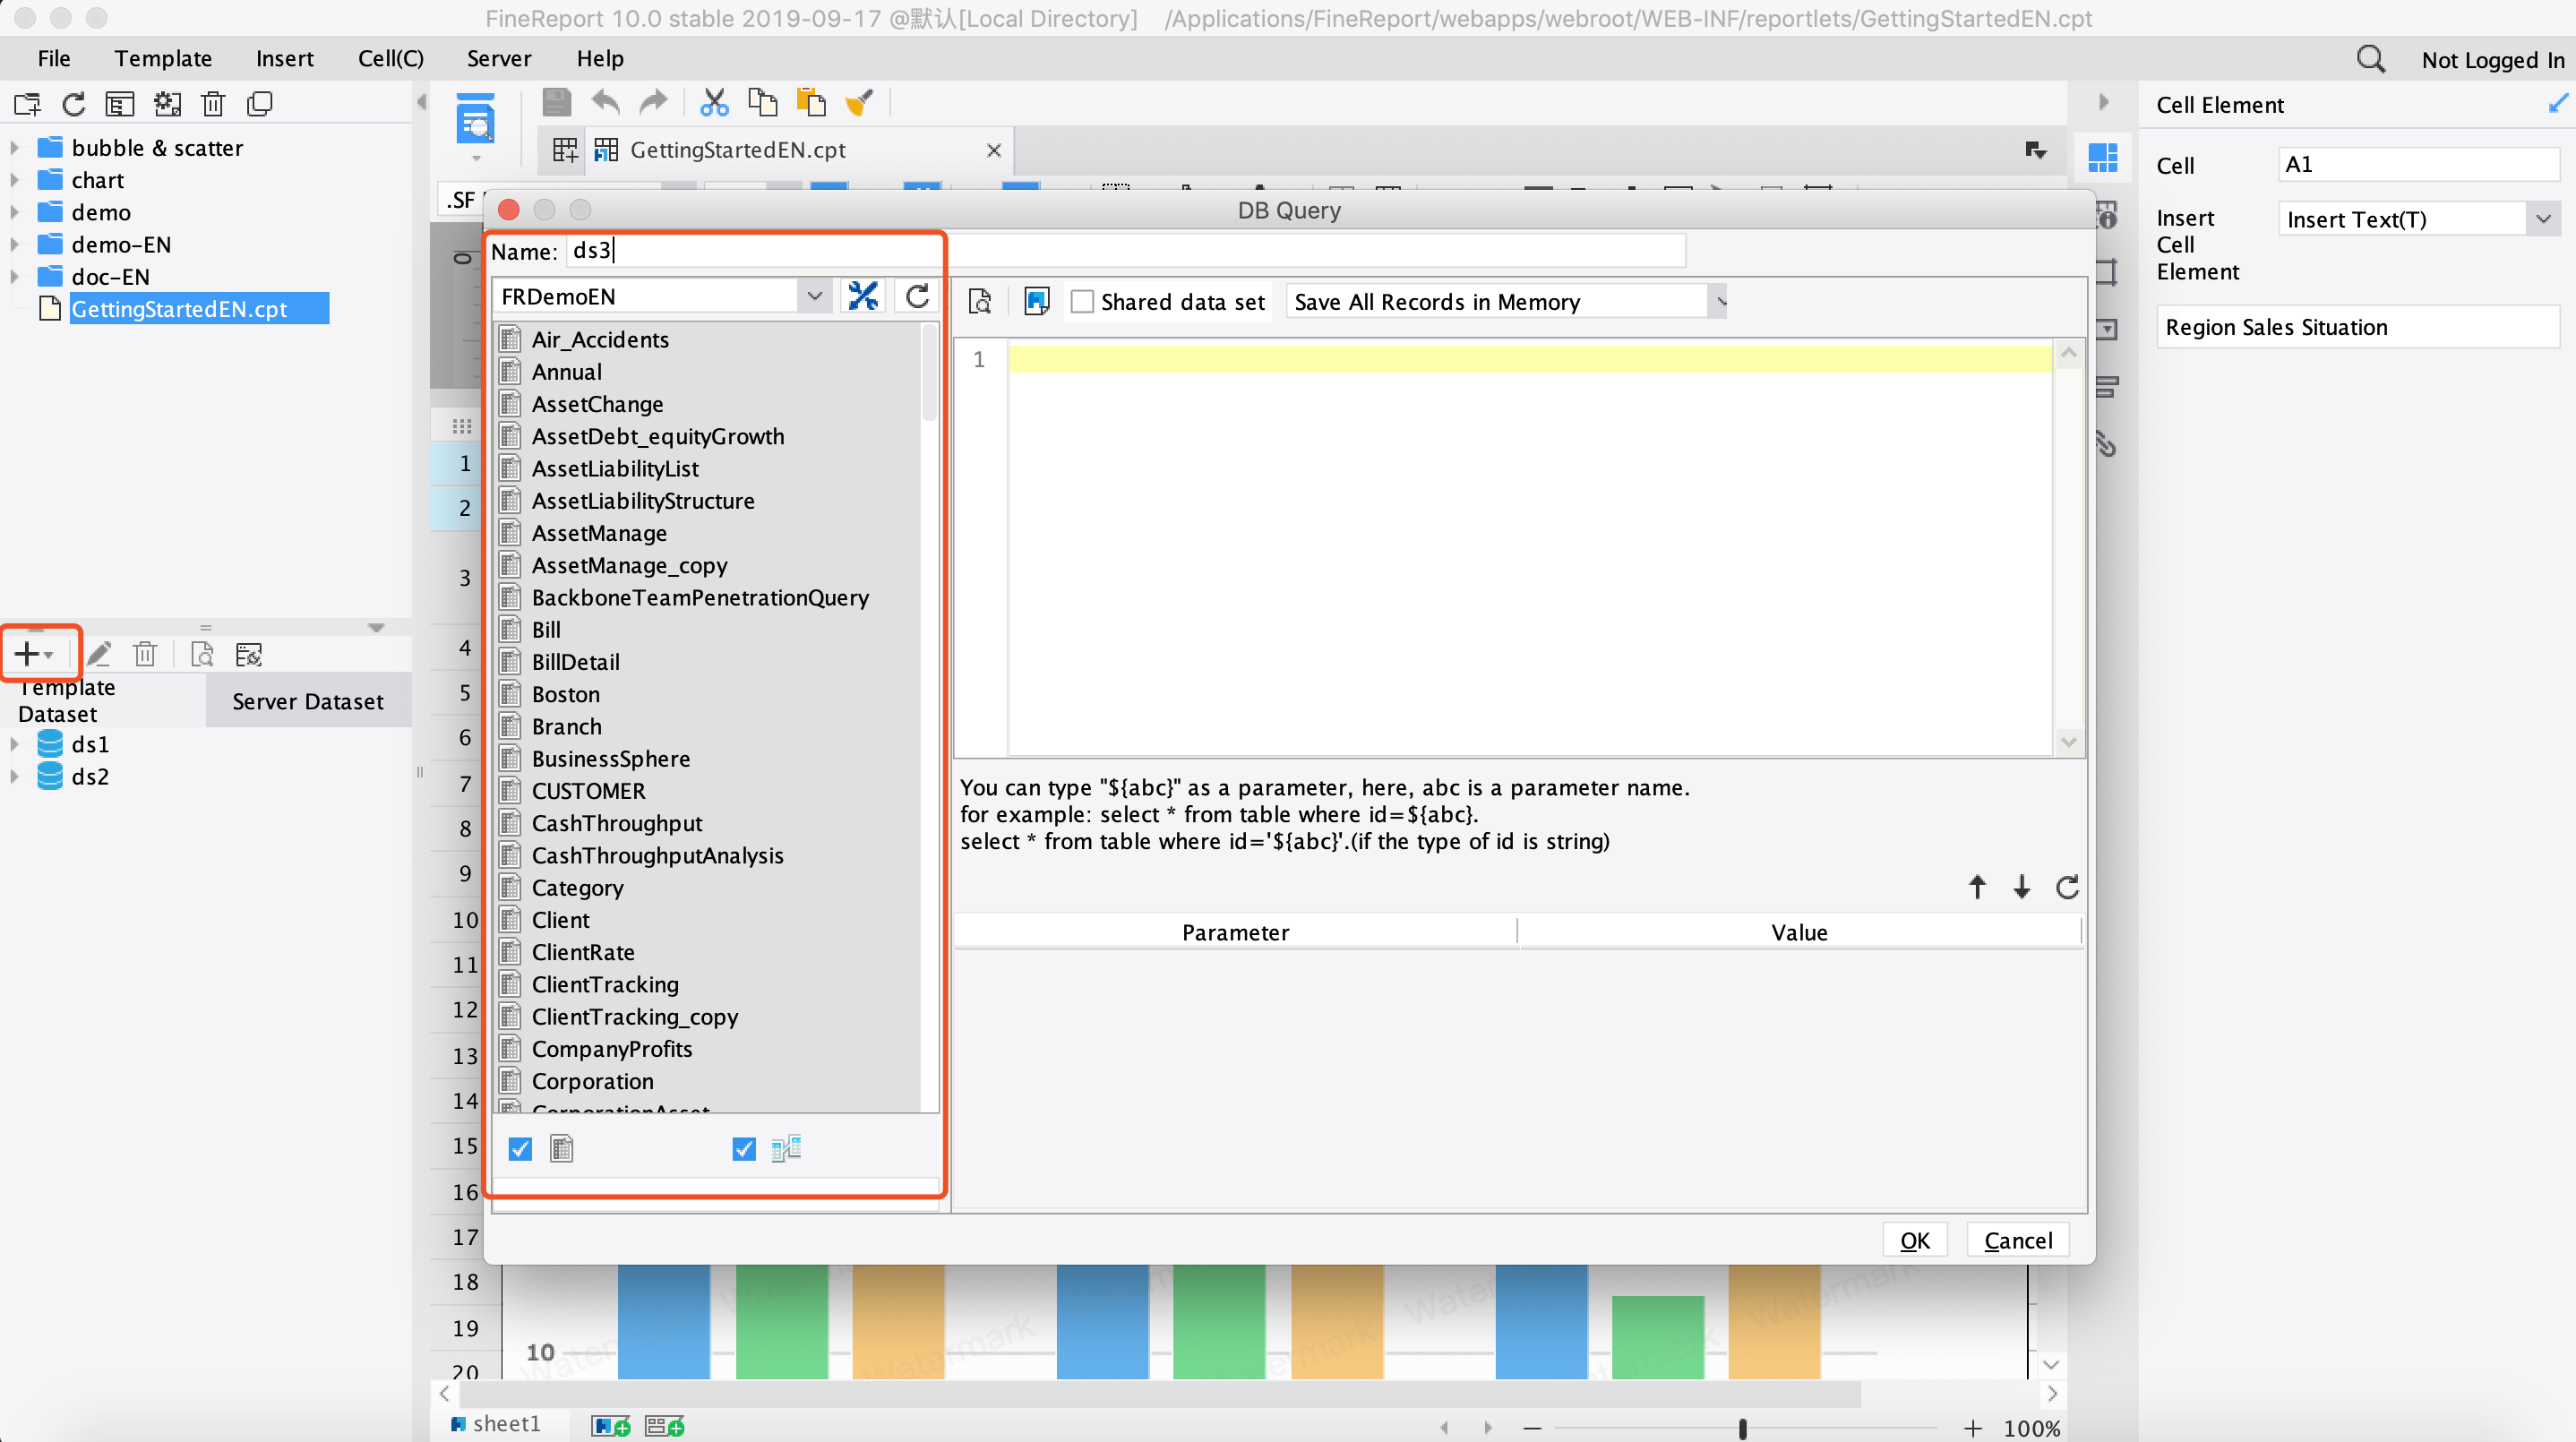
This section should present core performance in one visual block so leaders can compare the current week against context, not just absolute values.
Use side-by-side comparisons for:
- This week
- Last week
- Target
- 4-week or 8-week average
The most important fields usually include:
- Revenue
- Pipeline
- Leads
- CAC
- ROAS
- CPA
- Conversion rate
- Spend
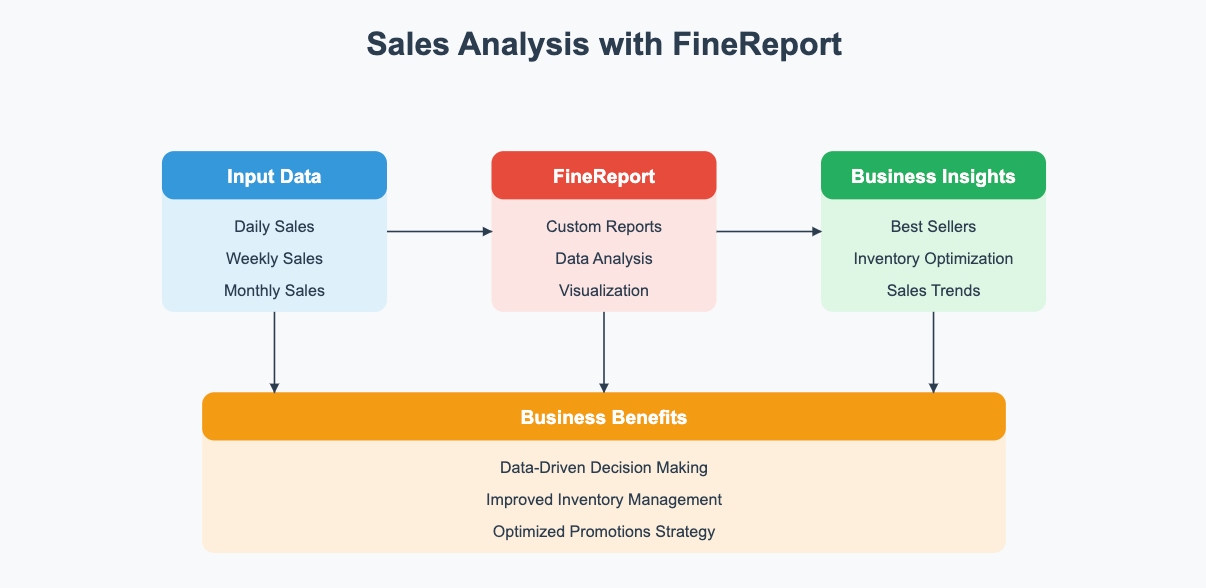
A well-designed table or scorecard here gives leadership a fast read on whether the business is accelerating, stabilizing, or slipping.
2. Budget, Spend, and Efficiency Trends
Executives do not just want to know whether marketing spent money. They want to know whether that spend was disciplined, on pace, and productive.
Spend pacing and budget allocation
This section should show how budget moved across major channels and whether total spend is aligned with plan.
Focus on three questions:
- Are we spending too fast or too slowly?
- Where did allocation shift this week?
- Did those shifts improve business outcomes?
A strong report should call out:
- Budget increases or reductions by major channel
- Spend pacing versus weekly and monthly targets
- Reallocations made in response to performance changes
- Any risk of underdelivering or overspending against plan
Efficiency by channel or campaign group
This is where the report connects spend to output. It should compare efficiency across the channel groups that matter to leadership, not bury executives in every ad set.
Common comparisons include:
- CPA by channel
- ROAS by channel
- CPC trends
- CPM inflation or stabilization
- Conversion rate by campaign group
The goal is not operational detail. The goal is identifying where efficiency is improving, where it is deteriorating, and where budget should move next.
For example:
- Search CPA improved after brand and non-brand were separated.
- Paid social CPM increased due to audience saturation.
- Retargeting ROAS remained the strongest across all paid channels.
- Affiliate volume stayed flat, but efficiency outperformed prospecting display.
3. Conversion Performance Across the Funnel
A weekly executive report becomes far more valuable when it explains not just lead generation, but progression through the funnel.
Lead, opportunity, and sales progression
This section should map the movement from click to conversion to revenue outcome. Many performance reports stop at top-of-funnel metrics, which leaves leadership unable to judge quality.
A practical funnel view should include:
- Clicks or sessions
- Leads
- Marketing qualified leads if applicable
- Opportunities
- Closed sales
- Revenue or pipeline contribution
This structure helps executives spot where performance breaks down. Strong click growth with weak downstream progression points to a quality problem. Flat lead volume with stronger opportunity creation suggests better targeting or stronger qualification.
Quality versus volume
This is one of the most important parts of a modern performance marketing report template. Executive teams care less about cheap volume than they do about scalable, profitable growth.
Your report should clearly answer:
- Did lead growth produce better pipeline or just more form fills?
- Did conversion quality improve after audience or creative changes?
- Did landing page updates increase both conversion rate and lead quality?
- Which channels are driving high-value outcomes, not just high counts?
Use concise commentary to explain whether gains came from:
- Better targeting
- Stronger creative
- Improved offer positioning
- Landing page optimization
- Sales follow-up improvements
- Seasonal demand shifts
4. Channel and Campaign Insights
This is the section where executives get meaningful context on what is actually driving the weekly shifts. The key is to stay strategic.
Best-performing channels this week
The best channel insights explain both performance and cause. Rather than saying "search did well," say why it did well.
Examples of useful executive-level interpretation:
- Branded search outperformed due to elevated demand from a concurrent product launch.
- Non-branded search improved because lower-intent terms were paused and budget shifted to higher-converting themes.
- Paid social drove reach and lead volume, but quality softened in upper-funnel audiences.
- Retargeting delivered the highest ROAS because of stronger audience recency and refreshed creative.
- Affiliate remained stable and efficient, supporting low-risk incremental volume.
If useful, break channels into categories such as:
- Branded search
- Non-branded search
- Paid social
- Display
- Affiliate
- Retargeting
- Partner campaigns
Campaign-level winners and underperformers
Campaign detail should stay selective. Executives do not need all campaign rows. They need the few campaigns, audiences, creatives, or offers that materially changed results.
Highlight:
- Top campaign winners and what drove success
- Underperforming campaigns and likely root causes
- Audiences with significant conversion or quality changes
- Creatives showing fatigue or uplift
- Offers or landing pages behind major swings
A strong summary here might say:
- The top-performing campaign this week was a bottom-funnel search campaign tied to high-intent keywords.
- A paid social lookalike audience increased lead volume but reduced opportunity rate.
- Display prospecting underdelivered due to high CPM and weak landing page engagement.
- New creative variants improved CTR but did not yet improve downstream conversion.
5. Risks, Anomalies, and What Changed
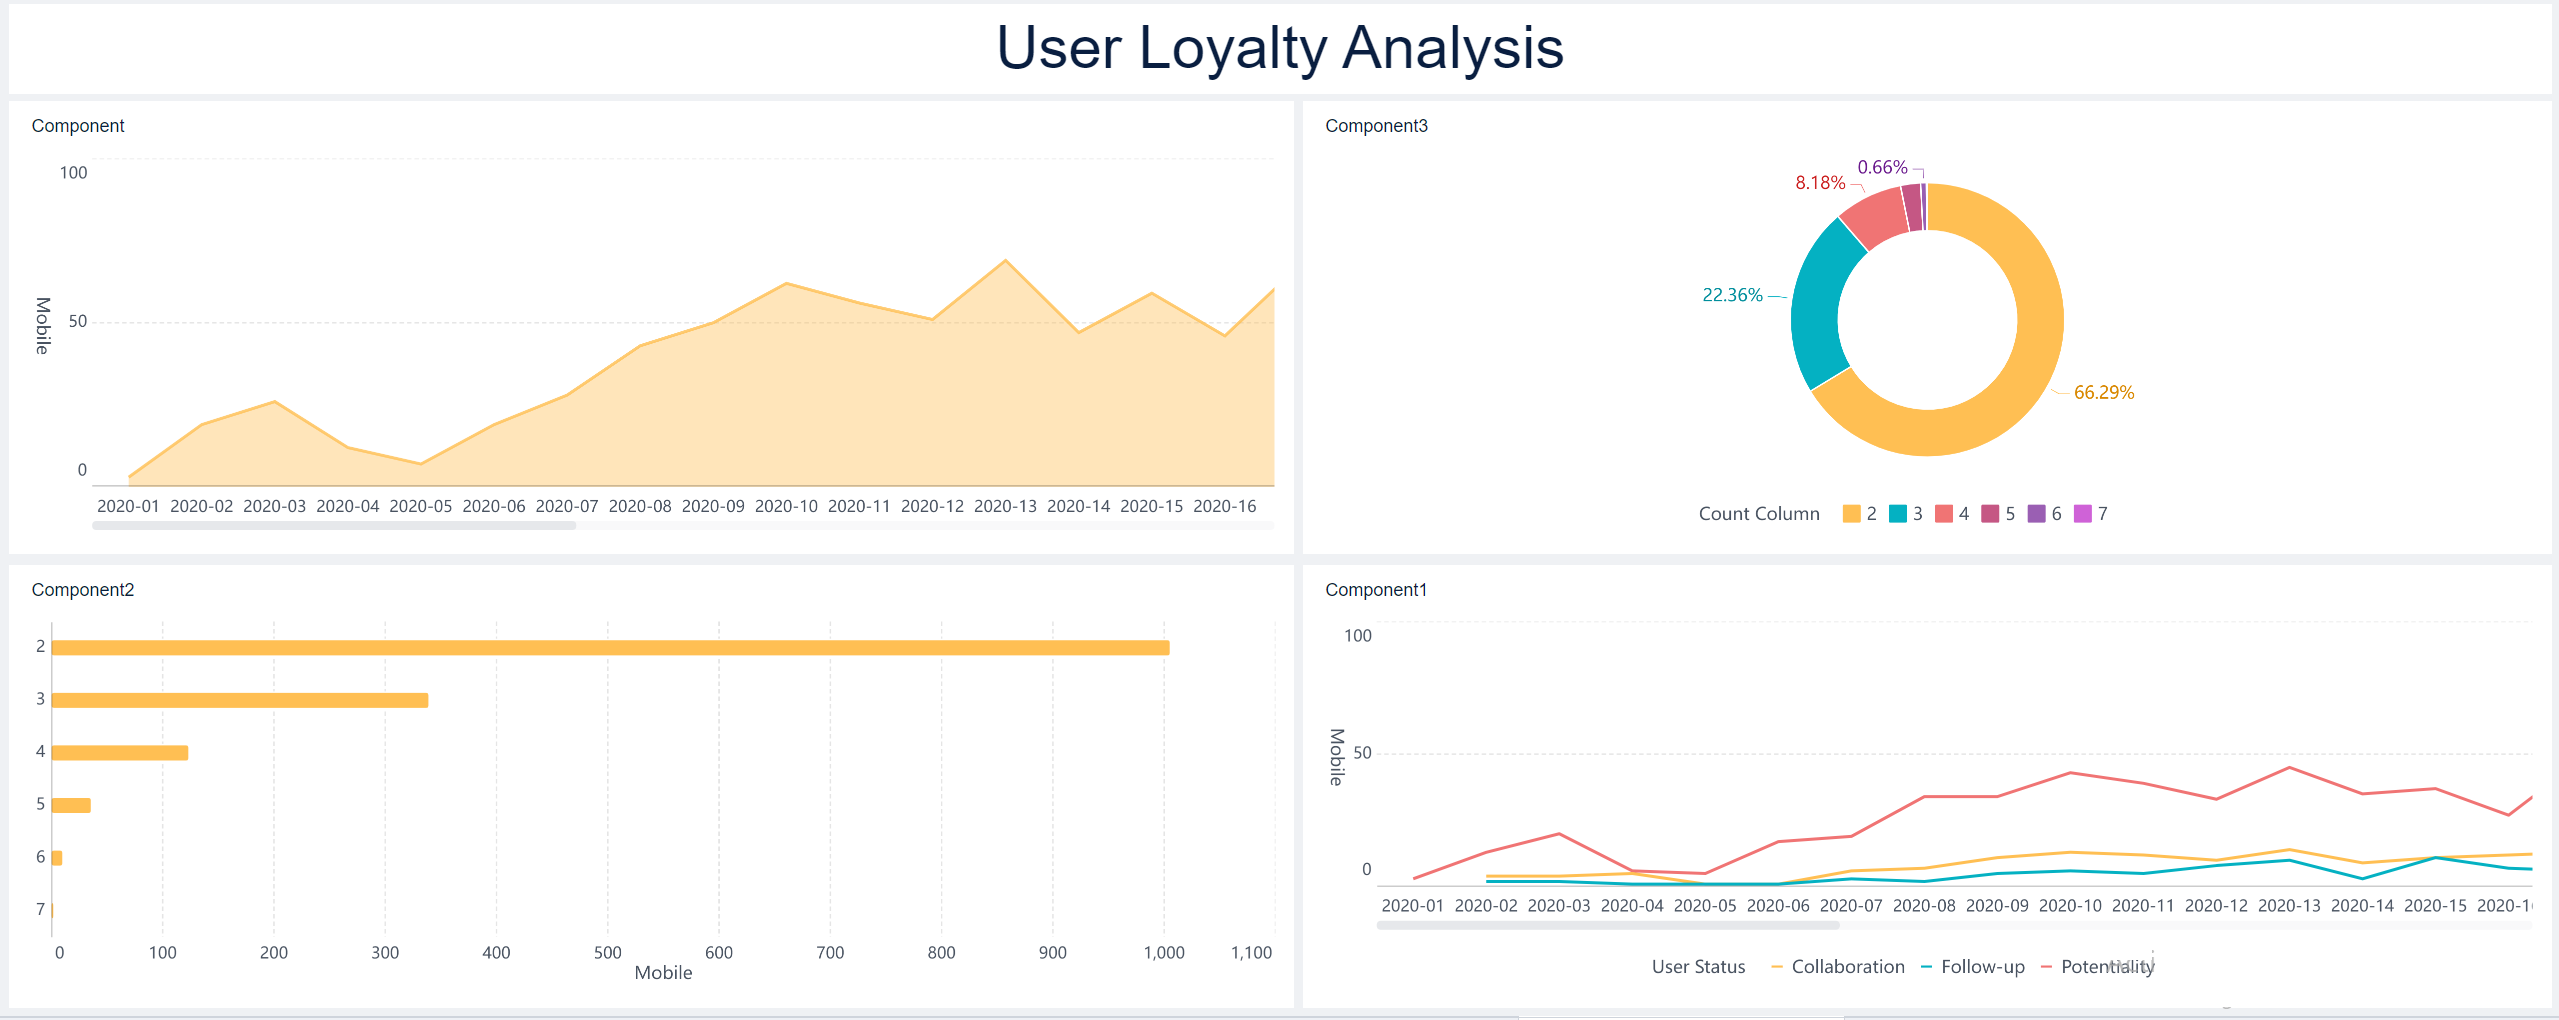
This is the section that builds executive trust. It shows that the team understands what the numbers mean and can separate signal from noise.
External or internal factors affecting results
Weekly performance can change for reasons beyond optimization alone. Good executive reporting surfaces these drivers early so leadership does not misread the data.
Common factors to flag include:
- Seasonality
- Promotions or pricing changes
- Website outages or page-speed issues
- Tracking changes
- Attribution model adjustments
- Auction pressure
- Creative fatigue
- Inventory or product availability constraints
- CRM sync issues or lead routing problems
When a number is distorted by a data issue, say so clearly. Ambiguity damages trust more than a short-term miss.
Variance explanation
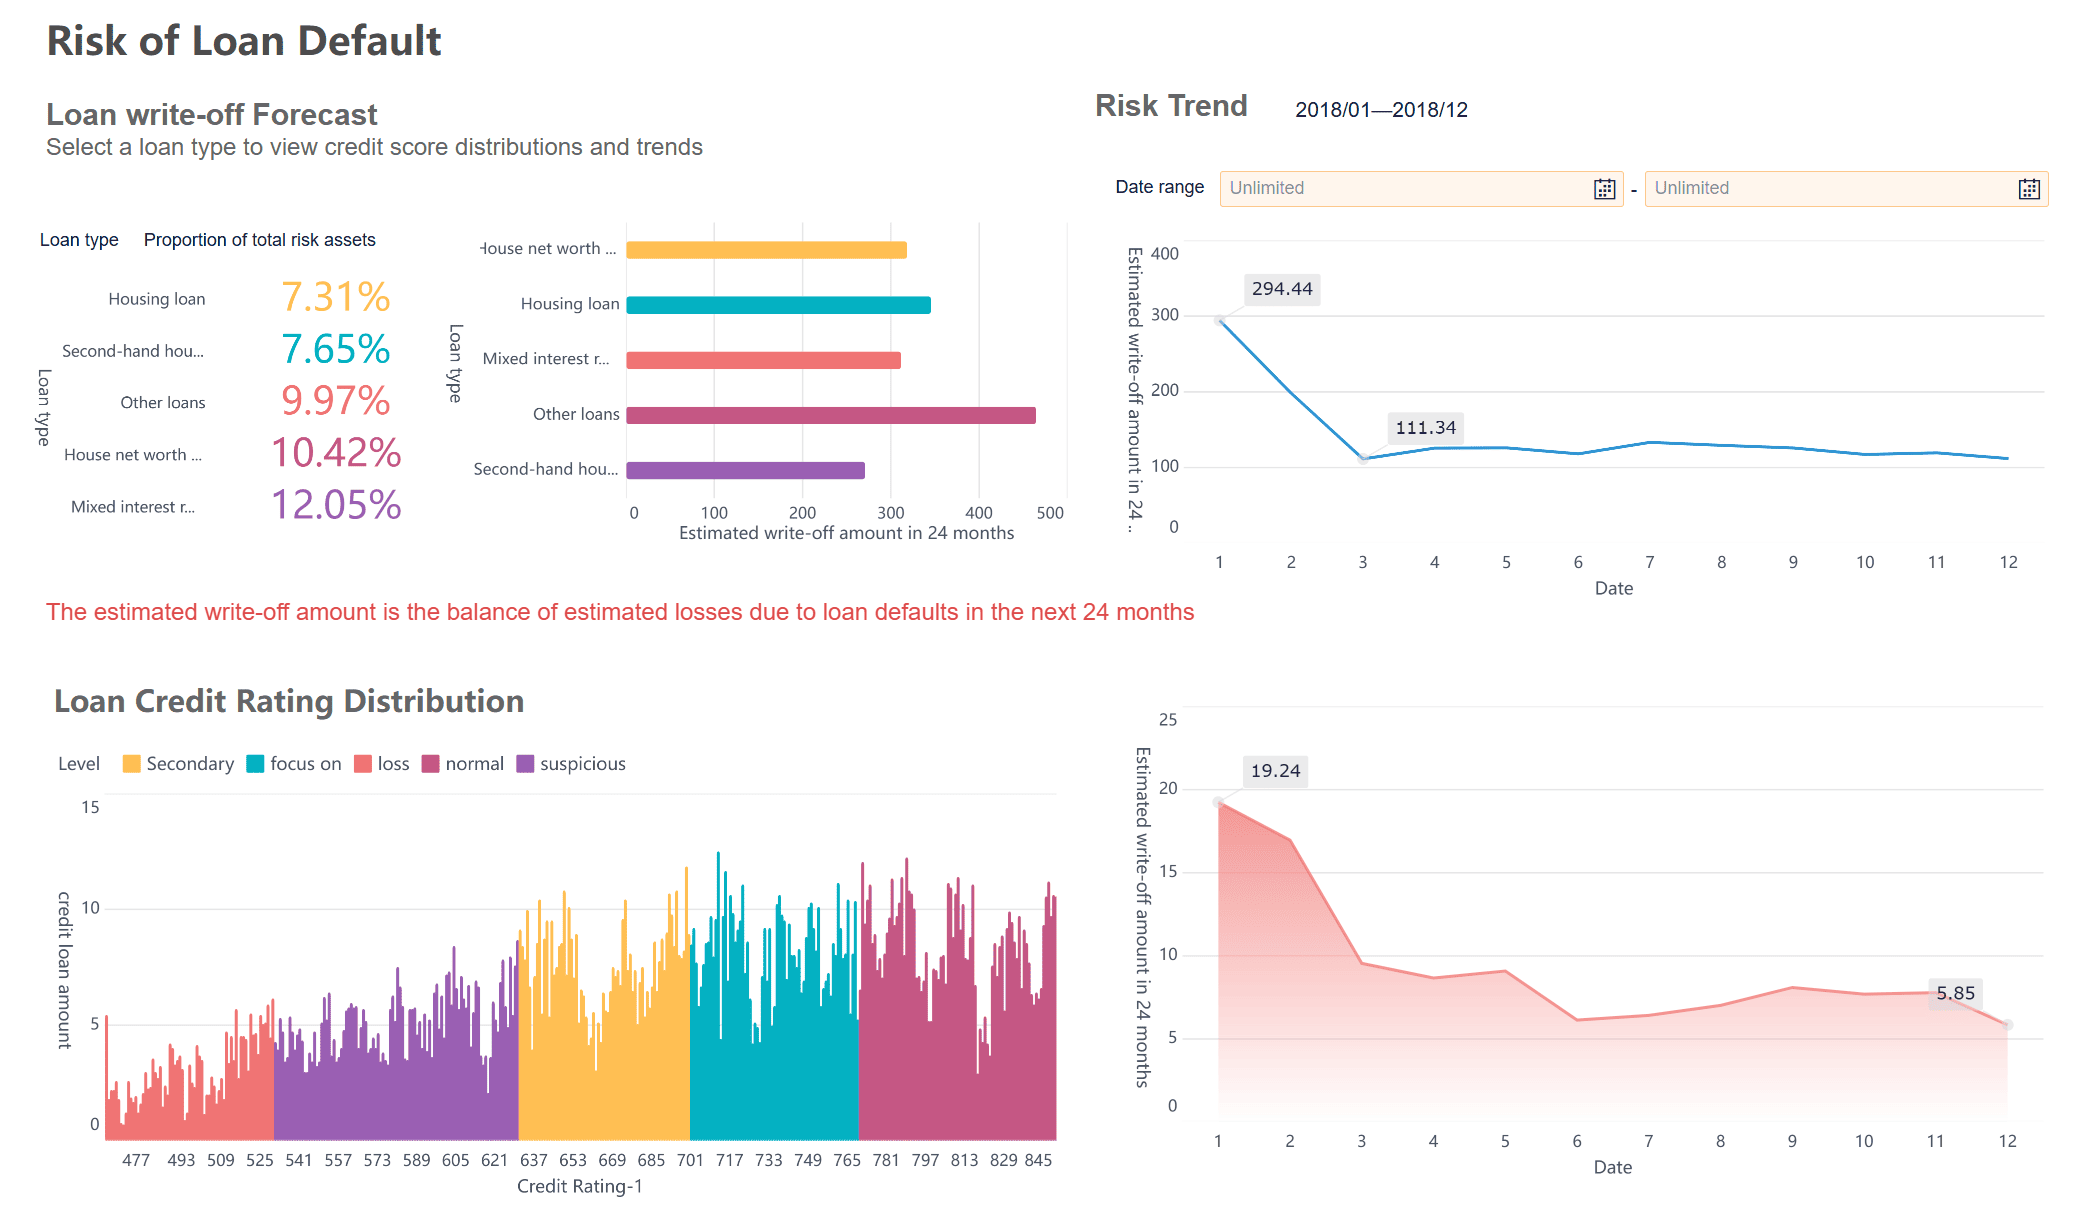
A useful executive report explains why results moved materially versus forecast, target, or prior week.
This commentary should distinguish between:
- Temporary fluctuations: Short-lived impacts such as holidays, promotions, or one-off tracking anomalies
- Structural changes: Meaningful shifts such as higher auction costs, degraded conversion rates, or sustained audience fatigue
Use plain business language:
- Spend was 5% under plan because campaigns were throttled after conversion quality dropped midweek.
- ROAS declined due to a mix shift toward upper-funnel prospecting, not because search performance weakened.
- Lead volume rose from promotional activity, but downstream opportunity creation will need another week to validate quality.
- Conversion rate fell because of a landing page issue introduced during a site release.
This is where a report becomes a decision document rather than just a scorecard.
6. Actions, Decisions, and Next Week’s Priorities
Every executive review should end with clear action. If the report does not specify what the team is doing next, it is incomplete.
Recommended actions for the team
This section should show that optimization is already underway and tied to expected impact.
Strong action items include:
- Reallocate budget from low-efficiency campaigns into top-performing high-intent segments
- Refresh fatigued creative in audiences where CTR and conversion rate are falling
- Tighten keyword coverage and match types to reduce wasted spend
- Improve landing page speed or message alignment for weak conversion paths
- Launch controlled tests on bidding strategy, audience segmentation, or offer framing
Present each action with:
- Owner
- Timing
- Expected business impact
Decisions or support needed from leadership
This is often the most overlooked section in a performance marketing report template, but it is one of the most valuable. Executives need to know where their input is required.
Examples include:
- Approval to shift budget between channels
- Extra creative resources for high-priority campaigns
- Landing page development support
- Sales alignment on lead qualification definitions
- Agreement on efficiency trade-offs during growth pushes
End the report with a short, direct list:
- Decision needed: Approve 15% budget shift from display to branded and retargeting
- Owner: VP Marketing
- Deadline: Before next Tuesday’s launch window
Best Practices for Building a Weekly Executive Reporting Process
A template is only useful if the reporting process behind it is disciplined. As a consultant, I recommend building weekly executive reporting around a few non-negotiable operating principles.
1. Standardize definitions before you automate anything
Agree on the exact definitions for revenue, pipeline, CAC, ROAS, CPA, and qualified lead stages. Misaligned metrics create more executive friction than bad performance.
2. Design for decision speed, not data completeness
Executives do not need every breakdown. They need the minimum set of views that reveal performance, variance, risk, and action. If a chart does not help someone decide something, remove it.
3. Compare against multiple benchmarks
Do not report this week in isolation. Always compare against:
- Last week
- Target
- Period average
- Forecast when relevant
This prevents overreaction to normal weekly volatility.
4. Build a variance commentary layer into the report
Do not force leaders to interpret swings by themselves. Add short explanations beside material changes so the report tells the story immediately.
5. Separate executive reporting from channel operations reporting
Your growth team may need deep campaign diagnostics, but the executive team does not. Keep the weekly executive deck focused on business outcomes and strategic actions.
Use FineReport to Build a Performance Marketing Report Template That Executives Actually Use
Building this manually is complex; use FineReport to utilize ready-made templates and automate this entire workflow.
If your team is still stitching together spreadsheets, ad platform exports, CRM data, and slide decks every week, the reporting burden will only grow as channels and stakeholders multiply. FineReport helps teams build automated, executive-ready reporting with live dashboards, KPI scorecards, funnel views, variance tracking, and cross-source integration in one place.
That matters because a high-value performance marketing report template is not just about layout. It depends on consistent data pipelines, visual clarity, weekly comparability, and the ability to drill from executive summary into root-cause analysis without rebuilding reports every Friday.

Get Ready-to-Use Dashboard Templates in Fine Gallery
With FineReport, teams can:
- Consolidate paid media, CRM, and revenue data into one executive view
- Build reusable weekly report templates with consistent KPI logic
- Automate trend tracking, target comparisons, and variance alerts
- Create drill-down dashboards for channel, campaign, and funnel analysis
- Speed up executive reviews with clear, presentation-ready visuals
For enterprise teams, that means less manual reporting effort, faster weekly decision cycles, and greater confidence in the numbers used by leadership.
A strong weekly executive report should make one thing easy: knowing what happened, why it happened, and what to do next. That is exactly the kind of workflow FineReport is built to support.
FAQs
It should include an executive summary, KPI scorecards, spend pacing, efficiency metrics, trend comparisons, risks, and recommended actions. The goal is to help leadership see performance, understand what changed, and decide what to do next.