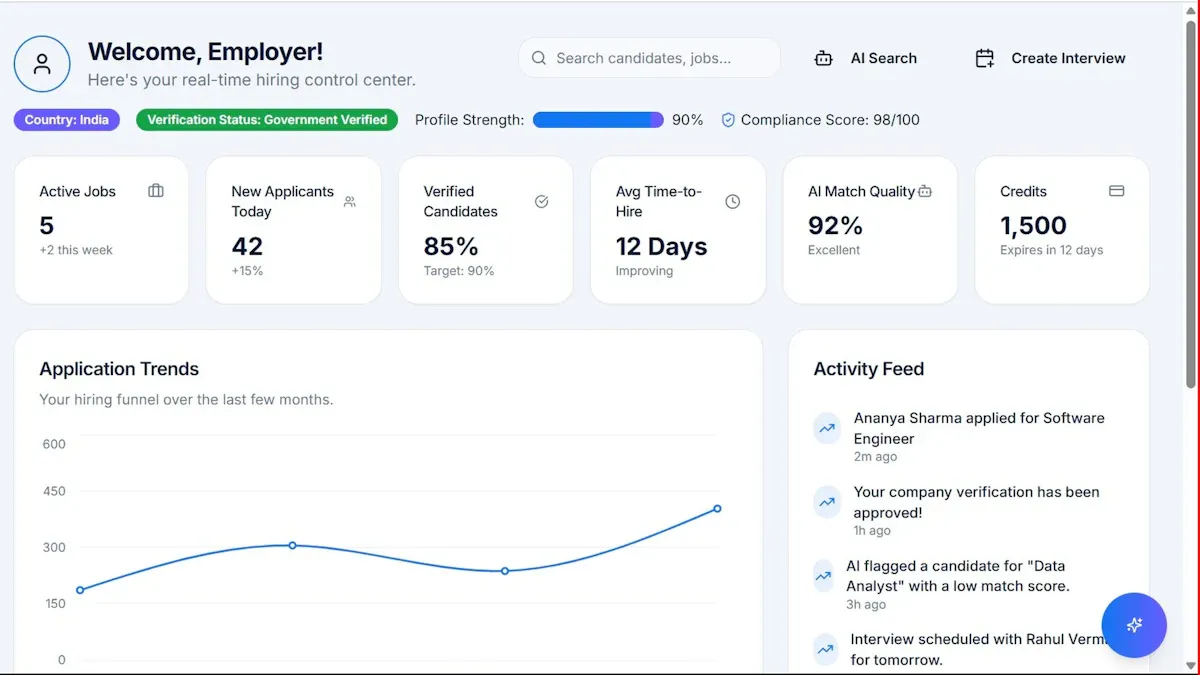
Knowing how to write a business report for executives is not the same as compiling data, summarizing activity, or pasting charts into slides. Executive-facing reports exist to support a decision under time pressure. Senior leaders want to know what happened, why it matters, what risks are emerging, and what action should be taken now. If you are an analyst, department lead, finance manager, or operations director, the real challenge is turning messy performance data into a credible recommendation that can survive scrutiny and move a decision forward.
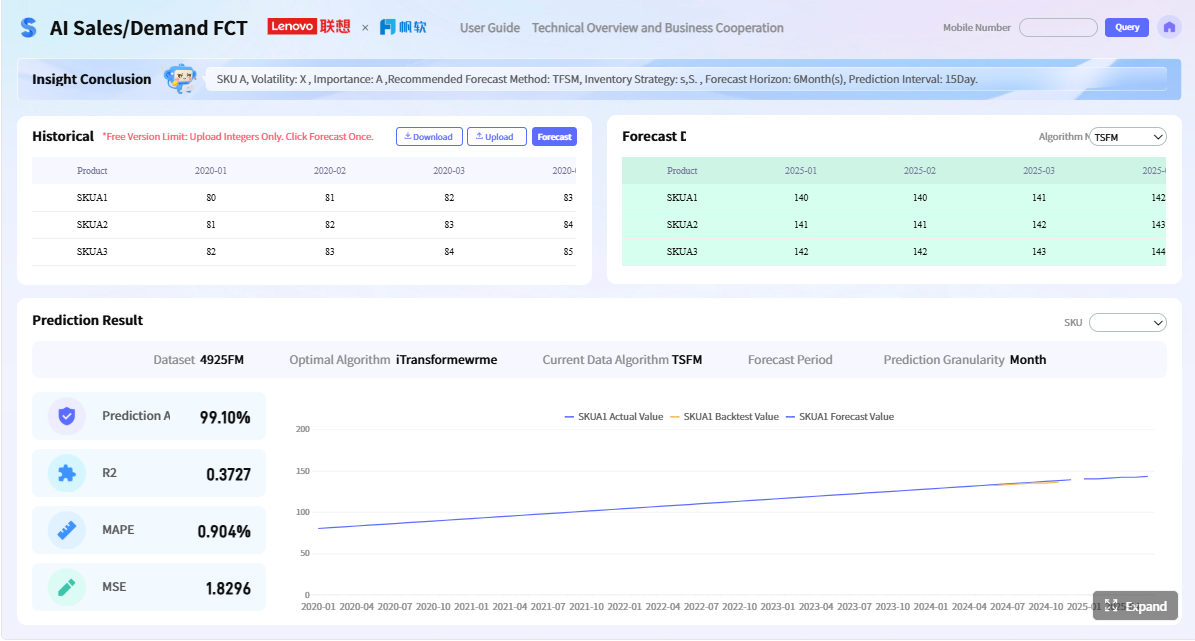 Click To Try The Dashboard
All reports in this article are built with FineReport
How to write a business report for executives: what makes it different
An executive-facing business report is a decision tool. Its purpose is not to document everything you found. Its purpose is to help a specific leader make a specific decision with enough confidence to act.
Executives read differently from operational teams. They scan for outcomes, material variances, financial or strategic risk, and the recommendation. If your report buries the answer under background detail, it will be ignored or pushed back for revision.
That is why it helps to distinguish three very different deliverables:
- Raw analysis: Detailed exploration of data, assumptions, anomalies, and methods.
- Operational update: Status reporting on activities, milestones, and execution progress.
- Decision-ready reporting: A concise, evidence-backed case for choosing one path over alternatives.
The scenario used throughout this guide is simple and realistic: your company has messy performance data across business units, channels, or periods, and leadership wants a clear recommendation. Perhaps sales are up but margin is down. Perhaps service levels improved while costs rose. Your task is to convert fragmented data into a report that tells executives what changed, why it changed, and what should happen next.
Key Metrics (KPIs) executives expect in a decision-ready business report
To rank well for featured snippets and to be practically useful, it is worth spelling out the core elements that make an executive report credible.
- Decision Objective: The exact question the report must answer.
- Business Impact: Revenue, cost, profit, risk, or customer effect tied to the issue.
- Variance: The difference between actual and target, forecast, or prior period.
- Trend Direction: Whether performance is improving, stable, or deteriorating over time.
- Root Cause: The primary drivers behind the result, not just the symptom.
- Risk Exposure: What could go wrong if no action is taken.
- Options Assessed: The realistic paths available to leadership.
- Recommended Action: The preferred option and why it is strongest.
- Implementation Timing: When action should begin and how quickly results are expected.
- Owner and Accountability: Who is responsible for execution and monitoring.
- Confidence Level: How strong the evidence is, including key assumptions and limitations.
- Success Measures: The metrics that will confirm whether the decision worked.
Start with the decision, audience, and scope
Clarify the executive question
The fastest way to write a weak report is to start with data instead of the decision. Start by identifying the business problem, the decision owner, and the deadline. Without those three inputs, your report will drift.
Ask practical questions such as:
- What decision must be made?
- Who will sign off on it?
- What deadline is driving the report?
- What happens if the decision is delayed?
- What outcome matters most: growth, savings, speed, risk reduction, or compliance?
A common executive request sounds broad: “Can you prepare a performance report for leadership?” That is not a reporting objective. A strong objective sounds like this: “Assess whether declining margin in the enterprise segment is driven by discounting, product mix, or service cost, and recommend the highest-impact corrective action before next quarter planning.”
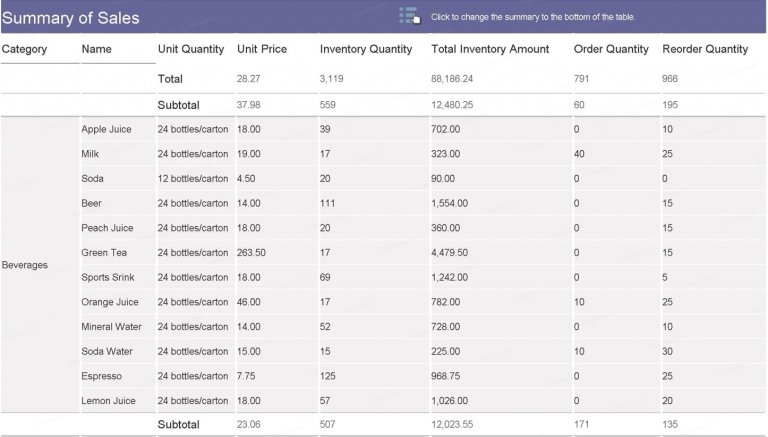
That single reframing changes the entire report. It tells you what data to collect, what to exclude, and what kind of recommendation the reader expects.
Decide what belongs in the report
Once the question is clear, decide what must be included for the executive to act confidently. Separate must-know facts from useful background.
Must-know content usually includes:
- Material performance changes
- Relevant financial implications
- Root causes
- Risk factors
- Feasible options
- Recommended action
- Next steps and ownership
Useful background may include methodology details, historical context beyond the active decision window, or supporting data cuts. These belong in appendices or backup materials, not in the main narrative.
Set firm scope boundaries around:
- Time period: Last month, quarter, rolling 12 months, year-over-year
- Business unit: Enterprise, retail, region, product line, plant, function
- Data sources: ERP, CRM, finance system, supply chain platform, surveys, manual files
- Decision threshold: What size of impact is material enough to report
Scope control is not a writing trick. It is what protects the report from becoming a data dump.
Choose the right report format and level of detail
Executives reward clarity, not volume. That means your structure, tone, and length should fit senior stakeholders.
For most decision-oriented reports, the best format is:
- Executive summary
- Context and objective
- Method and scope
- Findings
- Options
- Recommendation
- Next steps
Your executive summary should stand on its own. If a leader reads nothing else, they should still understand the situation, the recommendation, and the expected impact.
Turn raw data into findings executives can trust
Clean, validate, and organize the evidence
A persuasive report can still fail if the underlying data looks unreliable. Before drafting, test the evidence.
Check for:
- Missing periods or incomplete records
- Conflicting totals across systems
- Changes in definitions or business rules
- Outliers caused by one-time events
- Manual data-entry errors
- Duplicate records
- Timing mismatches between financial and operational data
Executives may not inspect every row, but they will challenge any number that appears inconsistent. Your report must be defensible.
A practical consultant approach is to organize the data into themes that directly answer the executive question. For example, if margin is under pressure, sort evidence into:
- Price and discount effects
- Product or customer mix shifts
- Cost-to-serve changes
- Regional or channel variance
- Operational inefficiencies
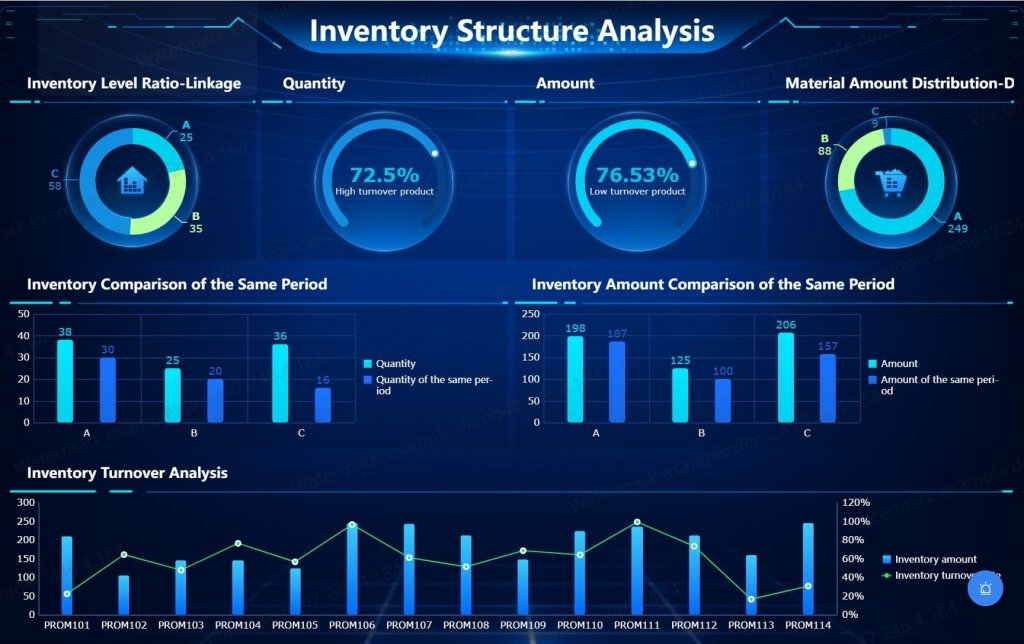
This thematic grouping makes the report easier to follow and keeps analysis tied to decisions rather than random observations.
Analyze for insight, not just description
Descriptive reporting says, “Revenue increased 8%.” Executive reporting says, “Revenue increased 8%, but gross margin declined 3.2 points due to heavier discounting in the enterprise segment and rising fulfillment cost, reducing the net value of top-line growth.”
That difference is everything.
Focus analysis on three questions:
- What changed?
- Why did it change?
- Why does it matter now?
Strong insight usually includes:
- Trends over time
- Variance versus target or forecast
- Root causes
- Business impact
- Urgency or timing implications
When possible, quantify the consequence. Saying “service costs increased” is weaker than saying “service costs rose 14% quarter over quarter, offsetting 60% of new revenue gains in the segment.”
Use visuals and tables selectively
Executives do not need more charts. They need the right charts.
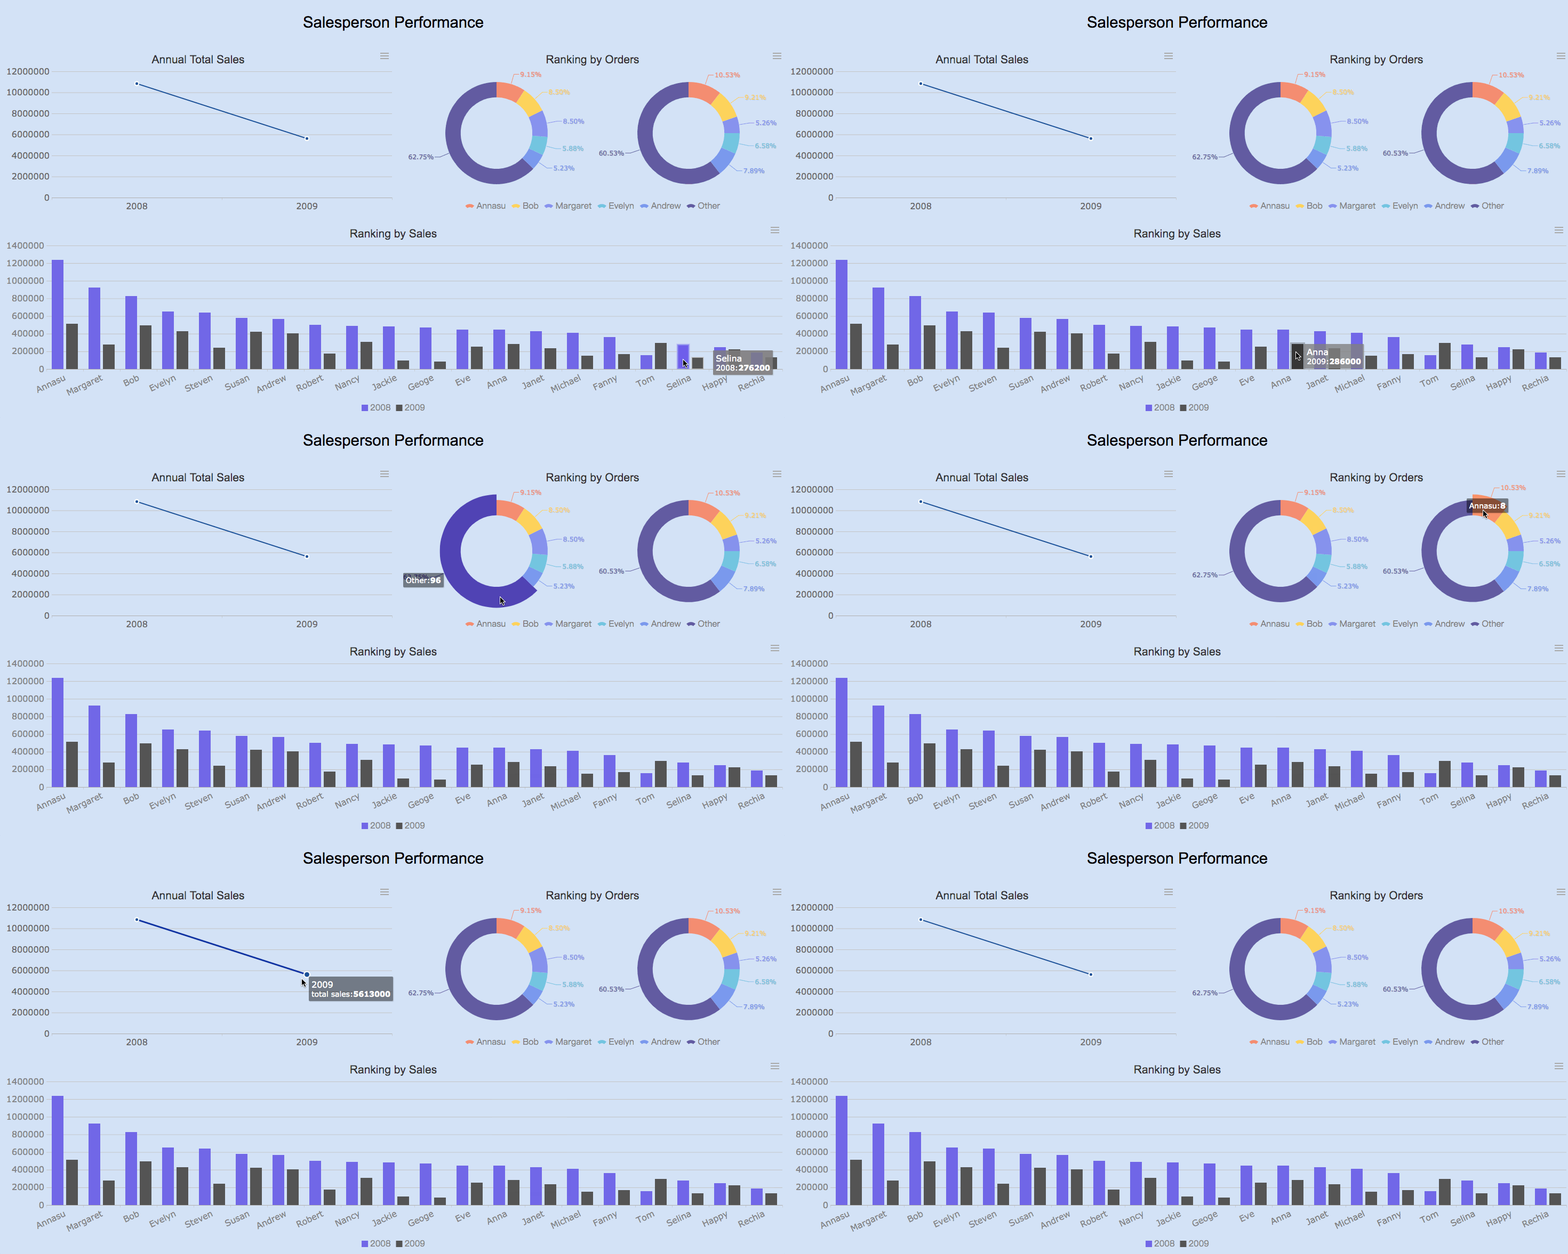
Use visuals only when they make trade-offs, comparisons, or exceptions obvious. The best choices are often simple:
- Line charts for trends
- Bar charts for comparisons across units or periods
- Waterfall charts for variance drivers
- Heatmaps for risk or exception concentration
- Short tables for ranked items or scenario comparison
Keep every label explicit. Define units, periods, assumptions, and terms. If “margin” means contribution margin in one chart and gross margin in another, your report loses trust fast.
A good rule: every chart should answer a decision question in under ten seconds.
Structure the report from summary to recommendation
Write a sharp executive summary
If you want to master how to write a business report for executives, master the summary first. It is the highest-value section in the document.
A strong executive summary contains four parts:
- Situation: What issue or opportunity triggered the report
- Key findings: The most important evidence
- Recommendation: The action leadership should take
- Expected impact: What result the business should expect
Example structure:
- Margin in the enterprise segment declined 3.2 points over the past two quarters despite revenue growth.
- Analysis shows the decline is primarily driven by discount expansion and increased service cost in two major accounts.
- We recommend tightening discount approval thresholds and redesigning service packages for low-margin contracts.
- This is expected to recover 1.8 to 2.4 margin points within the next two quarters, with limited revenue downside.
That is concise, specific, and decision-oriented.
Build the main body logically
The main body should explain the evidence in a sequence that feels inevitable.
A practical order is:
- Context: Why the report exists
- Scope and method: What was examined and how
- Findings: What the data shows
- Implications: What the findings mean for the business
- Options: What can be done
- Recommendation: What should be approved
Use headings that reflect decisions, not generic topics. Compare these two approaches:
- Weak: “Data Analysis”
- Strong: “Margin Erosion Is Concentrated in Discounted Enterprise Accounts”
Decision-oriented headings help busy executives skim and still understand the story.
Present options and recommend one path
Executives do not want a report that only describes problems. They want choices with a clear point of view.
Compare alternatives using a consistent framework:
- Cost
- Benefit
- Risk
- Timing
- Feasibility
For example, if your report is addressing declining profitability, your options may be:
- Reduce discounting immediately
- Reprice selected accounts at renewal
- Redesign service levels for costly accounts
- Exit unprofitable segments
Your job is not just to list these. It is to explain why one path is strongest given business priorities, constraints, and timing.
Make recommendations specific, credible, and actionable
Link every recommendation to evidence
Recommendations fail when they sound generic or unsupported. Every action must tie back to findings already established in the report.
If you recommend changing pricing policy, show the discount analysis. If you recommend consolidating vendors, show the cost variance. If you recommend reallocating headcount, show the utilization or productivity trend.
A recommendation becomes credible when it includes:
- The exact action
- The business rationale
- The evidence supporting it
- The expected impact
- The assumptions behind the estimate
Also state limitations openly. If the analysis is based on partial quarter data, small samples, or provisional cost allocations, say so. Transparency increases confidence.
Anticipate executive concerns
Senior stakeholders will test the recommendation quickly. Your report should answer the obvious questions before they are asked.
Common executive concerns include:
- What are the biggest risks?
- What dependencies could delay execution?
- What budget is required?
- What resistance should we expect from teams or customers?
- What if the recommendation underperforms?
- How fast can we measure results?
Addressing these directly shows maturity and reduces the back-and-forth that slows approval.
End with next steps and ownership
A report is only decision-ready if it defines what happens next.
End with a short action plan that states:
- What should happen next
- Who owns each step
- When each step is due
- What success measures will be used
For example:
- Finance and Sales Operations revise discount thresholds by May 15
- Account Management reviews top 20 low-margin accounts by May 22
- Operations redesigns premium service bundles by June 1
- CFO reviews first impact checkpoint in the July monthly business review
These details convert analysis into execution.
Review, polish, and learn from a sample business report
Edit for clarity and executive readability
Most weak reports are not weak because the analysis is wrong. They are weak because the writing hides the insight.
Edit aggressively for:
- Long introductions that delay the point
- Repetition across sections
- Jargon that obscures meaning
- Passive phrasing
- Unclear pronouns such as “this,” “it,” or “they”
- Paragraphs that mix multiple ideas
A useful test is simple: can an executive skim the first line of each paragraph and still grasp the recommendation?
Check format and professionalism
Presentation affects credibility. Even strong findings lose authority if the report looks inconsistent or unfinished.
Verify:
- Heading hierarchy and numbering
- Consistent chart titles and units
- Accurate appendix references
- Matching totals across text and visuals
- Standard terminology throughout
- Clean spacing and page layout
- Formal, circulation-ready formatting
This is especially important in enterprise environments where reports move across departments, leadership teams, and audit trails.
Use a sample business report as a final benchmark
Before sending your report, compare it against a strong internal or external example. A good sample business report helps you spot missing sections, weak transitions, unsupported claims, or formatting gaps.
Create a repeatable final checklist such as:
- Does the report answer one clear executive question?
- Is the recommendation stated early and clearly?
- Are the findings limited to material issues?
- Are the visuals easy to interpret in seconds?
- Are options compared consistently?
- Are risks and assumptions disclosed?
- Are next steps, owners, and timing explicit?
That checklist reduces rewriting in future reporting cycles and helps standardize quality across teams.
Best practices for implementing an executive business report workflow
If you need a repeatable process for how to write a business report, use the workflow below. This is the approach experienced consultants use to turn fragmented data into an executive-ready document.
1. Start every report with a decision brief
Before analysis begins, create a one-page intake that captures:
- Decision to be made
- Executive owner
- Deadline
- Scope
- Required KPIs
- Materiality threshold
This prevents scope drift and aligns expectations early.
2. Build a single source of validated reporting data
Do not write from disconnected spreadsheets if the report will influence executive action. Reconcile financial, operational, and commercial data first. Standardize definitions and flag exceptions before drafting any narrative.
3. Draft the summary before the full narrative
Write a provisional executive summary as soon as the core findings emerge. This forces clarity. If you cannot summarize the issue, insight, and recommendation in a few lines, the analysis is probably not decision-ready yet.
4. Use a fixed recommendation template
Standardize how options are assessed. For example:
- Problem
- Evidence
- Options
- Recommended action
- Cost/benefit
- Risks
- Owner
- Timeline
This creates consistency across reports and makes executive review much faster.
5. Review with a challenger before circulation
Have one stakeholder test the report as a skeptical executive would. Ask them where the argument feels weak, where data looks uncertain, and what questions remain unanswered. This final challenge review dramatically improves report quality.
Build executive-ready business reports faster with FineReport
Building this manually is complex; use FineReport to utilize ready-made templates and automate this entire workflow.
When organizations try to manage executive reporting with fragmented spreadsheets, copied charts, and manual commentary, the result is slow, inconsistent, and difficult to trust. FineReport helps teams centralize data, standardize KPI definitions, build decision-ready dashboards, and generate polished business reports for leadership without recreating the process every reporting cycle.
FineReport is especially valuable when you need to:
- Connect multiple enterprise data sources
- Clean and unify reporting inputs
- Create reusable executive report templates
- Automate dashboard refreshes and scheduled distribution
- Present top-line summaries with drill-down support
- Maintain consistency across departments and reporting periods

Get Ready-to-Use Dashboard Templates in Fine Gallery
Instead of spending days assembling charts and formatting slides, teams can focus on the high-value work: framing the decision, interpreting the findings, and recommending action with confidence.
For any team serious about learning how to write a business report that executives actually use, the winning formula is clear:
- Start with the decision
- Limit scope to what matters
- Validate data before drafting
- Highlight insight, not just activity
- Recommend one path with evidence
- Assign ownership and next steps
- Use a reporting platform that makes this scalable
FAQs
An executive business report should include the decision objective, the most important performance changes, root causes, risks, options considered, and a clear recommendation. It should also show the expected business impact, timing, and ownership for next steps.