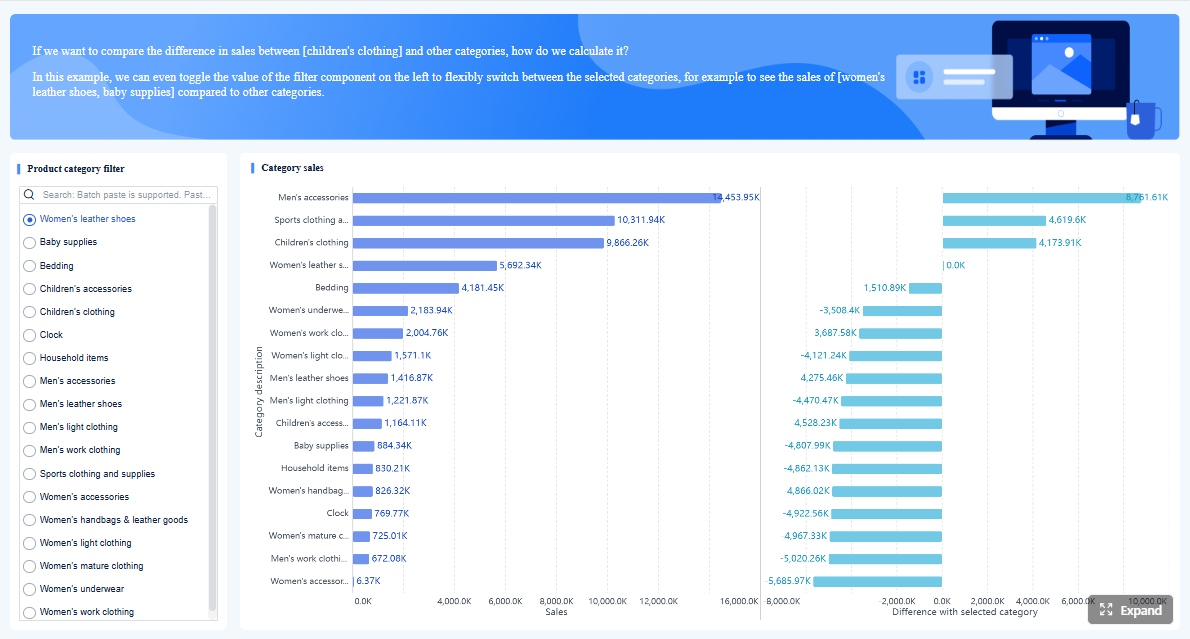
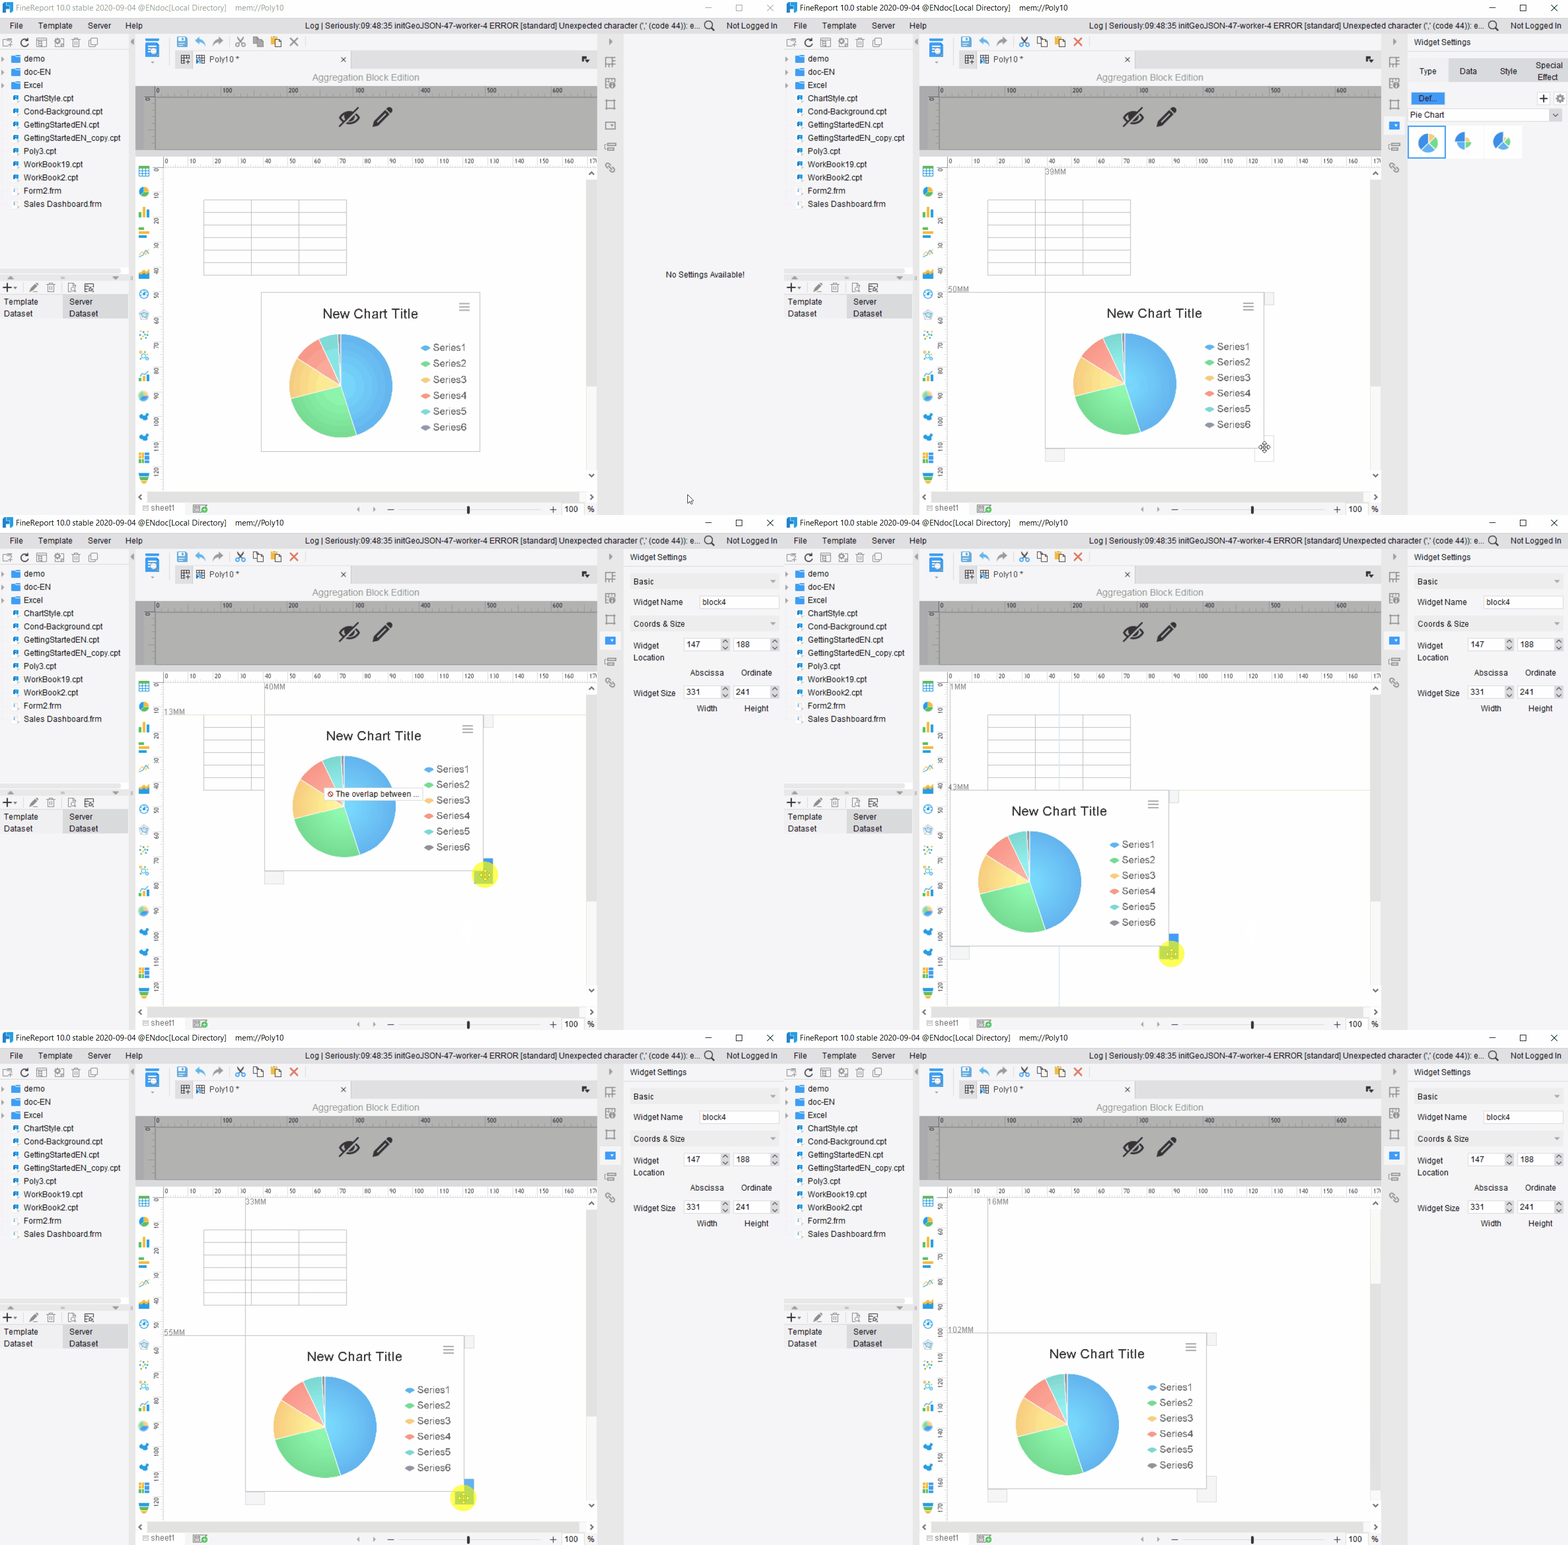
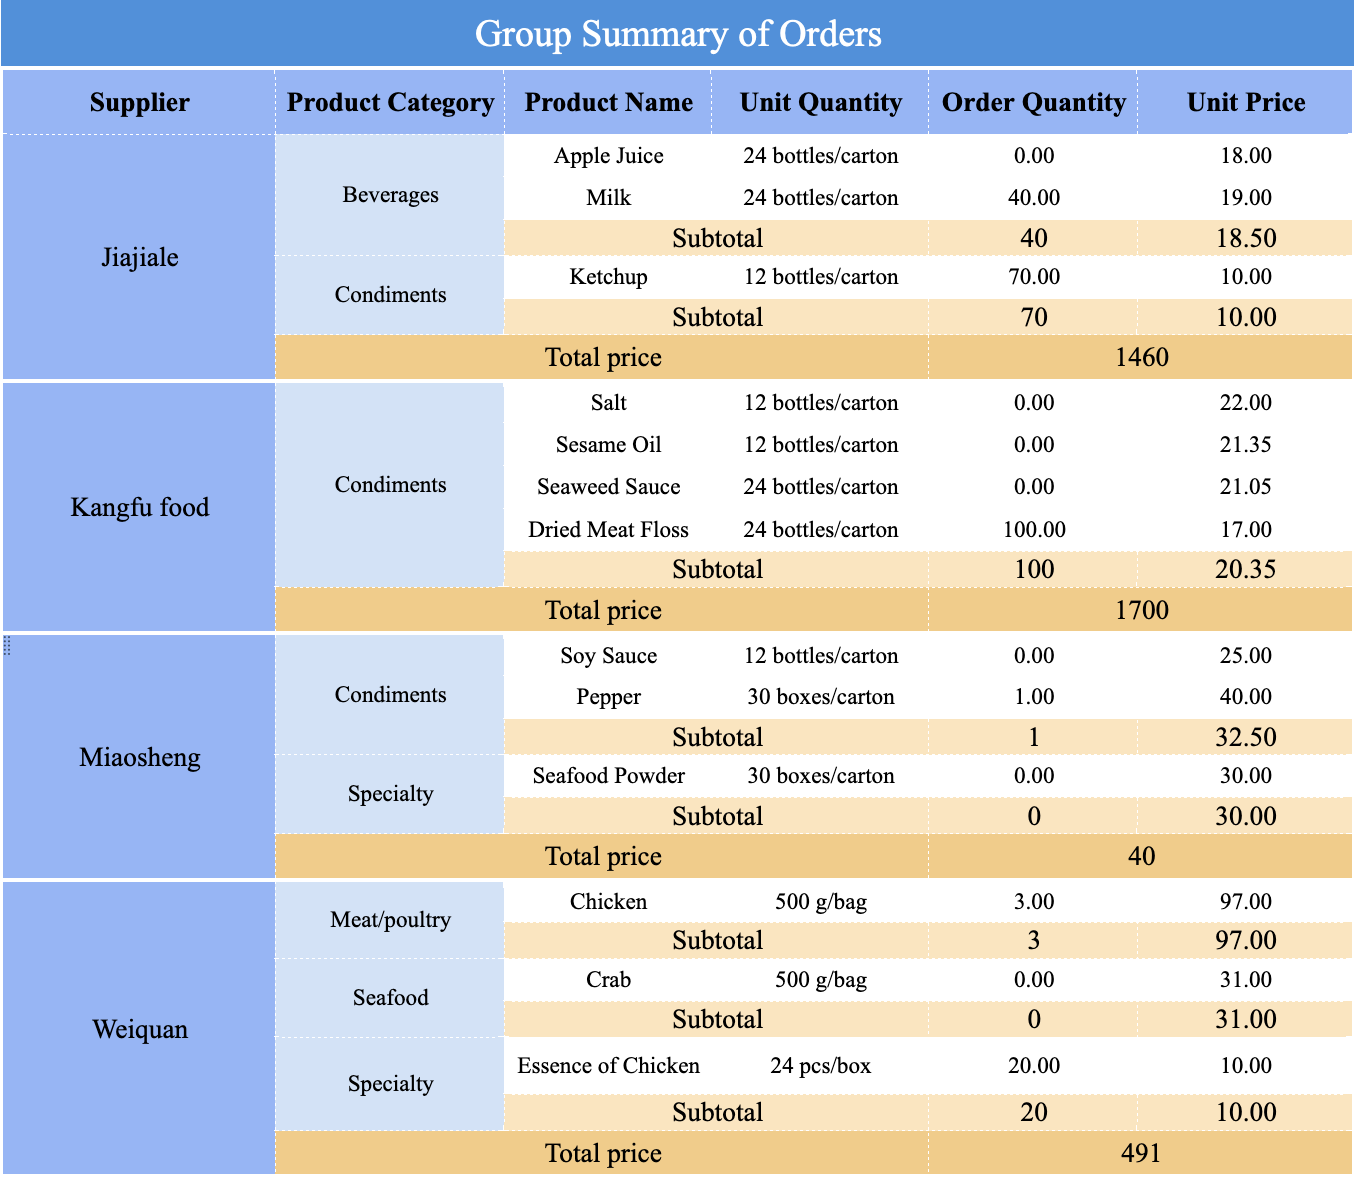
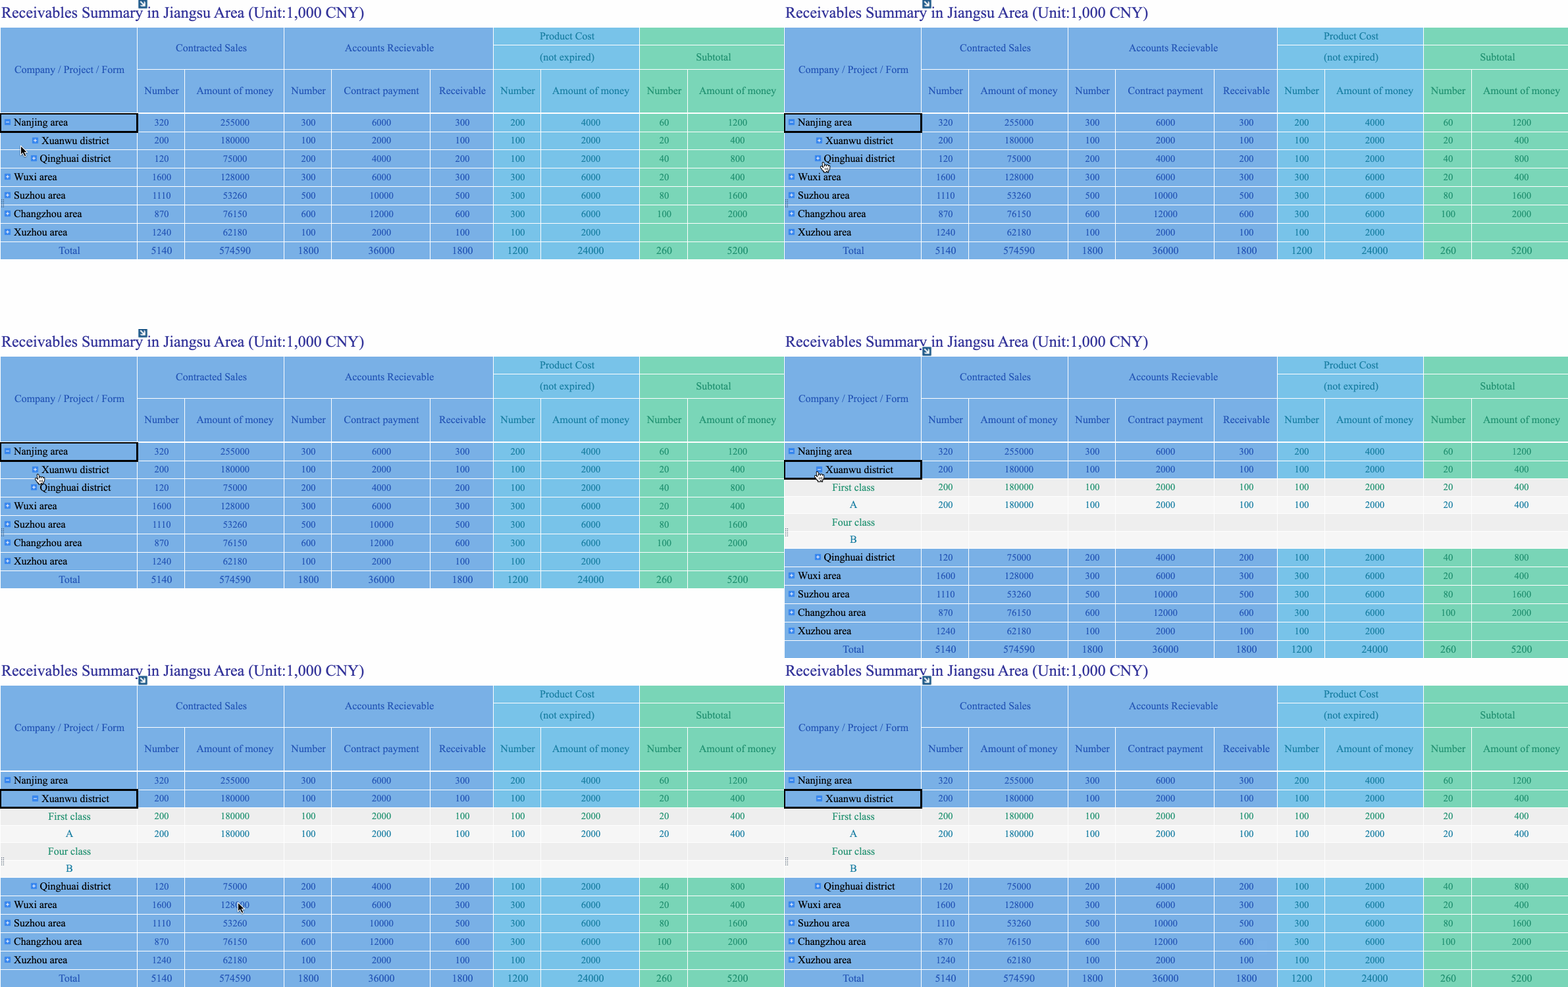
A small business daily sales report sample is not just a record of what you sold today. It is a practical control tool that helps owners, store managers, operations leads, and bookkeepers see whether the business is making money, where sales are coming from, and what needs attention before small issues become costly problems. If you run a retail shop, café, salon, service business, or local chain, a simple daily report gives you fast visibility into revenue, transactions, payment mix, product performance, staff output, and unusual events that affect the day’s results.
Click To Try The Dashboard
All reports in this article are built with FineReport
Small Business Daily Sales Report Sample: what it is and why it matters
A daily sales report shows the most important sales activity for a single business day. In most cases, it summarizes total revenue, number of orders, average sale size, item or category performance, payment methods, discounts, refunds, and operational notes.
For a small business, this report matters because it turns raw sales data into a daily management routine. Instead of waiting for a weekly or monthly summary, you can immediately spot whether traffic is down, whether a promotion worked, or whether too many refunds are eating into profit.
A well-designed report helps track:
Revenue: How much money came in today
Transactions: How many individual sales were completed
Trends: Whether performance is improving or slipping
Team performance: Which employee, shift, or channel drove results
For most small businesses, these are the essential KPIs to include in a daily sales report:
Total Sales: Gross or net revenue generated during the reporting period.
Number of Transactions: Total completed orders or customer purchases.
Average Order Value (AOV):Total sales divided by number of transactions.
Sales by Product or Service: Revenue generated by each item sold.
Sales by Category: Performance grouped by product line, service type, or department.
Payment Method Mix: Breakdown of cash, card, mobile wallet, transfer, or other payment types.
Discount Amount: Total value reduced from listed prices due to promotions or manual discounts.
Refunds and Returns: Money returned to customers or reversed from sales.
Tax Collected: Taxes charged on sales during the day.
New vs. Repeat Customers: Basic view of customer acquisition and retention if tracked.
Top-Selling Items: Products or services driving the highest volume or revenue.
Slow-Moving Items: Low-demand items that may need promotion, repricing, or stocking review.
Staff or Shift Performance: Sales by employee or shift where accountability matters.
Sales Variance: Comparison of today’s results against yesterday, last week, or target.
Operational Notes: Context behind the numbers such as weather, stockouts, local events, or promotions.
This is why the report is used by more than just finance. Owners use it to protect margins, managers use it to guide staffing and inventory, sales staff use it to understand targets, and bookkeepers use it to reconcile payments and records.
What to include in a daily sales report
The best small business daily sales report sample is detailed enough to support decisions but simple enough to complete every day without resistance.
Core sales figures
Start with the numbers that give an immediate snapshot of daily performance.
These four data points answer the first management question: Did we have a good day, and why? If sales are up but transactions are flat, your average order value likely improved. If transactions are up but revenue is not, pricing or basket size may be weakening.
Average Order Value = Total Sales / Number of Orders
Category Contribution % = Category Sales / Total Sales
Item Sales Rank = Units Sold or Revenue by Item
Payment and customer details
Revenue alone does not show whether cash flow and settlements are clean. Your report should also track how customers paid and whether deductions affected final earnings.
Include:
Payment methods used, such as cash, card, and digital payments
Discounts, refunds, returns, and taxes
New customers, repeat customers, or basic customer notes if relevant
This layer is especially important for businesses with mixed payment channels or frequent promotions. A day with strong sales but high discounts may look good on the surface and still hurt profit.
At a minimum, managers should be able to answer:
Did card payments dominate today?
Were discounts unusually high?
Were there more refunds than normal?
Did customer behavior suggest loyalty or one-time purchases?
Operational notes and exceptions
Numbers without context often lead to the wrong conclusion. A sales dip may have nothing to do with staff performance and everything to do with weather, delayed stock, or a local event.
Your report should include space for:
Top-selling items and slow-moving items
Staff, shift, or location performance if tracked
Unusual events that affected sales, such as promotions, stock issues, or weather
These notes turn a report into a management tool rather than a bookkeeping exercise.
Most small businesses do not struggle with collecting numbers. They struggle with turning those numbers into daily decisions. The report only adds value if someone knows how to interpret it quickly and consistently.
Spot daily patterns quickly
Start by comparing today’s results against a useful baseline:
Yesterday
The same weekday last week
A rolling 7-day average
A daily target or budget
This comparison helps remove noise. Monday should not always be judged against Saturday. A better habit is to compare like-for-like periods.
Focus first on:
Sales volume changes
Transaction count changes
Average order size
Best-selling item shifts
If transactions fell but AOV rose, your team may be selling fewer but larger orders. If one category spiked, it may signal demand worth repeating through promotion or merchandising.
Identify problems and opportunities
Once the patterns are clear, move to performance drivers and profit risks.
Check whether:
Discounts are too high
Refunds are increasing
A low-performing category is dragging the total
One staff member or shift is underperforming
Inventory shortages limited sales
This is where the report becomes operationally valuable. You are not just observing results. You are identifying the reason behind them.
If you are looking for a practical small business daily sales report sample, the easiest approach is to use a simple, repeatable structure with summary fields, breakdown tables, and a notes section.
Basic template fields
Your daily sales report template should include the following fields:
The notes section is where the report becomes actionable.
Include space for:
Key wins, issues, and unusual events
Inventory concerns or follow-up actions
End-of-day summary and owner or manager comments
This section is essential for preserving context. Six weeks later, when you review trends, you will know whether a sales spike came from a campaign, holiday traffic, or temporary stock changes.
Free formats and template options to use
Not every small business needs the same reporting format. The best choice depends on sales volume, staff habits, and how quickly you need to review data.
Spreadsheet and printable formats
Common daily sales report formats include:
Excel and Google Sheets for automatic calculations and easy editing
Printable forms for stores that prefer handwritten end-of-day reporting
Simple digital layouts that work for retail, service, and food businesses
Spreadsheets work well when you need formulas, simple charts, and easy sharing. Printable forms are useful in low-tech environments or when closing staff complete reports manually before finance enters them later.
Choose a template based on how your business actually runs.
Use a lighter template if you:
Have low daily sales volume
Sell only a few products or services
Need fast manual completion
Use a more detailed template if you:
Need category, employee, or location breakdowns
Run promotions often
Track inventory closely
Need owner, manager, and finance visibility from the same report
The guiding principle is simple: make it complete enough to support action, but simple enough to be used every day without fail.
Common mistakes to avoid and final tips
Daily sales reports fail for predictable reasons. In most cases, the issue is not the template. It is inconsistency, overcomplication, or missing context.
Common mistakes include:
Recording sales totals without noting refunds, discounts, or taxes
Using too many fields that make the report hard to complete every day
Failing to review trends over time instead of only looking at one day in isolation
Not standardizing definitions, which creates inconsistent reporting across staff or locations
Ignoring notes and exceptions, which removes useful operational context
To improve reporting quality, follow these consultant-level best practices:
1. Standardize the format and definitions
Use one fixed template and define each field clearly. Everyone should know what counts as a sale, refund, discount, return, and completed transaction. This avoids daily confusion and improves comparison over time.
2. Automate calculations first, not analysis last
Start by automating repetitive formulas such as total sales, AOV, and category totals. This reduces manual error and gives managers more time to review the results rather than build the report.
3. Build a same-day review habit
Do not let the report sit unread. Review it at the end of the day or before opening the next day. Immediate review leads to immediate correction.
4. Keep commentary short and operational
Notes should answer: what happened, why it happened, and what should happen next. Avoid vague comments like “sales were okay.” Be specific.
5. Compare trends weekly, not just daily
Daily reports are tactical. Weekly review is strategic. Look at multiple days together to see whether changes are real patterns or just noise.
Build a smarter daily sales reporting workflow with FineReport
Building this manually is complex; use FineReport to utilize ready-made templates and automate this entire workflow.
For many small businesses, reporting starts in spreadsheets but quickly becomes difficult to maintain. Data comes from POS systems, payment tools, manual logs, and separate staff notes. As the business grows, version control, delayed updates, and inconsistent formatting create reporting friction.
FineReport solves this by helping teams turn daily sales data into a structured, automated dashboard and reporting process. Instead of spending time copying numbers into a sheet every evening, you can centralize data, standardize templates, visualize KPIs, and deliver consistent daily reports to managers and owners.
Easy customization for retail, food, service, and mixed business models
Get Ready-to-Use Dashboard Templates in Fine Gallery
If you want a small business daily sales report sample that is not only easy to use but also scalable as your business grows, FineReport is a practical next step. It helps you move from manual end-of-day reporting to a more reliable operating rhythm built on real-time visibility and standardized analysis.
A useful daily sales report should include total sales, transaction count, average order value, sales by product or category, payment methods, discounts, refunds, taxes, and brief operational notes. These fields give a clear picture of both performance and exceptions for the day.
Start with total sales, number of transactions, and average order value to judge overall performance. Then review product mix, payment split, refunds, and notes to understand what drove the results and whether any issues need action.
It helps owners and managers catch problems early instead of waiting for weekly or monthly reports. Daily visibility makes it easier to manage cash flow, staffing, inventory, promotions, and margin risks.
Divide total sales by the number of completed orders or transactions. This metric shows whether customers are spending more or less each time they buy.
Yes, the template should be adjusted to fit the business model, such as retail, restaurants, salons, or service companies. Most businesses keep the same core KPIs but add fields like shift performance, appointments, or register reconciliation when needed.
Product Trial
FineReport
Pixel-perfect reports · Interactive dashboards · Easy data entry · Digital twins