A budget variance report is only valuable when it helps finance leaders act faster, not when it just explains what already happened. CFOs, FP&A teams, controllers, and department heads need a report that isolates material gaps between plan and actuals, explains the business drivers, and points to the next decision—whether that means tightening spend, revising forecasts, or reallocating resources. If your current process produces a static budget-to-actual file with too many rows and too little insight, it is not a reporting problem alone; it is a decision-support problem.
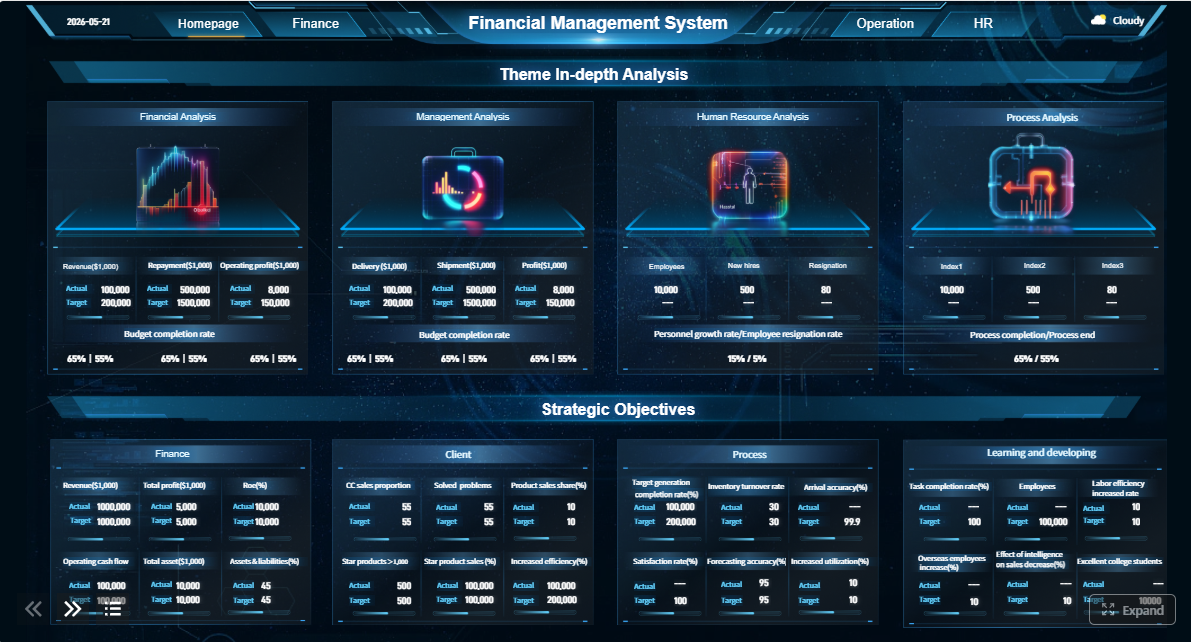 Click To Try The Dashboard
All reports in this article are built with FineReport
What a budget variance report is and why finance leaders rely on it
A budget variance report compares planned financial performance with actual results for a defined period and shows the gap in both amount and percentage terms. In practice, it helps leaders answer three critical questions:
- Where are we off plan?
- Why did it happen?
- What decision should we make next?
That is why finance leaders rely on it in planning, control, and decision-making. It turns budgets from static targets into active management tools.
A simple budget-to-actual comparison tells you whether spending or revenue missed the plan. A true budget variance report goes further. It adds context, categorization, thresholds, ownership, and commentary so leaders can distinguish a routine fluctuation from a problem that affects cash flow, margin, or forecast accuracy.
An actionable report for CFOs and FP&A teams usually includes:
- A clear view of material variances, not every minor fluctuation
- Drill-downs by department, cost center, account, project, or region
- A distinction between timing issues and structural issues
- Short commentary that explains cause, impact, and action
- A workflow for follow-up, not just review
If the report cannot help a department leader understand what changed and what must happen before the next review cycle, it is not actionable enough.
Core elements every useful budget variance report should include
The most effective budget variance reports are built around a small set of consistent fields that make interpretation fast and repeatable. Finance leaders do not want to decode the structure every month. They want a familiar framework that highlights exceptions and supports confident decisions.
Key Metrics (KPIs)
-
Actual Amount
The real revenue, cost, or profit recorded for the reporting period. -
Budget Amount
The approved target or planned figure used as the comparison baseline. -
Variance Amount
The numeric difference between actual and budget. -
Variance Percentage
The variance amount divided by budget, used to compare deviations across categories of different sizes. -
Favorable / Unfavorable Status
A business-friendly label that shows whether the variance benefits or harms performance. -
Materiality Threshold
A rule that flags only variances large enough to require management attention. -
Time Period
Month, quarter, year-to-date, or rolling period used for review. -
Department / Cost Center / Account View
The reporting dimension that identifies where the variance occurred. -
Project or Business Unit View
A secondary lens for tracing variance to strategic initiatives or operating segments. -
Root Cause Category
A standardized tag such as volume, price, timing, mix, or one-time event. -
Owner
The person or team accountable for investigating and responding. -
Management Commentary
A concise explanation of what changed, why it matters, and what action is planned. -
Trend Direction
A period-over-period view showing whether the variance is improving, worsening, or recurring. -
Forecast Impact
An indicator of whether the variance should trigger a reforecast or plan update.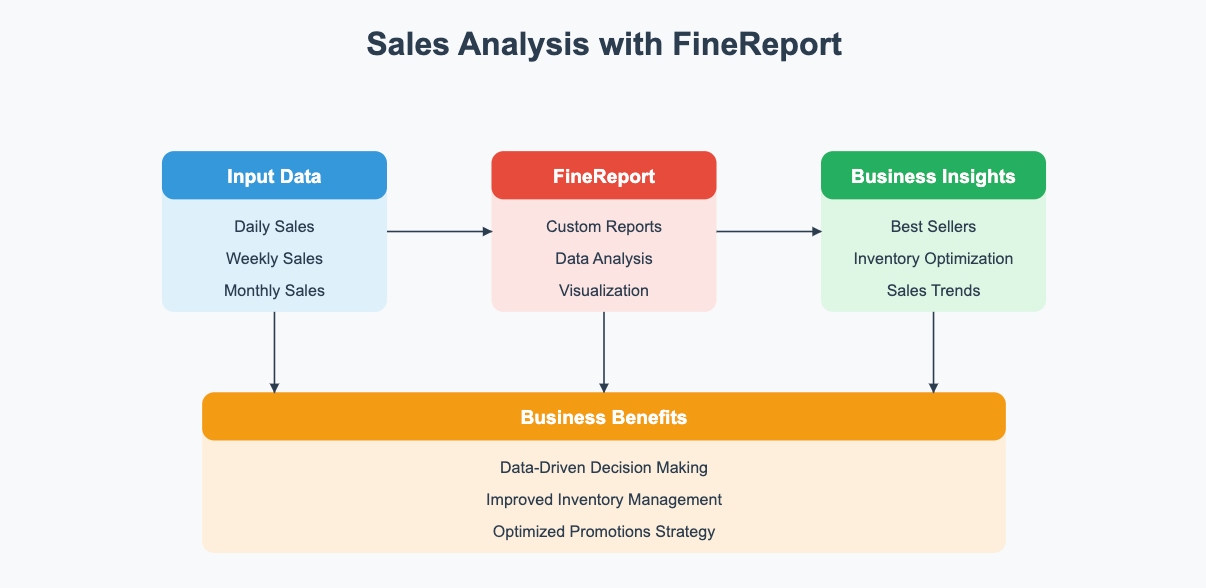
At a minimum, your report should display actuals, budget, variance amount, and variance percentage. But finance leaders usually need more than a single-period comparison. They also need filters for time period, department, account, project, or cost center.
Commentary fields are equally important. Without written explanation, a report becomes a list of deviations without business meaning. The strongest reports pair numbers with short, standardized commentary such as:
- What changed
- Why it changed
- Whether it is temporary or recurring
- What action is being taken
Clear thresholds are also essential. If everything is flagged, nothing is urgent. Good variance reporting filters out small noise and escalates only material gaps.
The basic variance formula and how to present it clearly
The basic formulas are straightforward:
- Variance Amount = Actual - Budget
- Variance Percentage = (Actual - Budget) / Budget
These formulas should be applied consistently across the report. That consistency matters more than many teams realize. When departments use different logic for revenue, labor, or overhead categories, trust in the report declines quickly.
For presentation, keep the formulas simple and visible in design:
- Show budget and actual side by side
- Display variance amount in a dedicated column
- Add variance % next to it for scale
- Use visual labels such as Favorable (F) and Unfavorable (U) where useful
- Apply conditional formatting for material issues only
Be careful with favorable and unfavorable labeling. For expenses, spending above budget is usually unfavorable. For revenue, actuals above budget are usually favorable. The report should reflect that logic clearly so executives do not have to reinterpret signs line by line.
Consistent formulas improve trust because stakeholders know the same rules apply every month, across every department. That is the foundation of credible financial reporting.
Primary causes and common types of budget variance
A useful budget variance report does not stop at the number. It identifies the underlying driver. That is what turns finance reporting into decision support.
The most common variance drivers include:
- Volume variance: Changes in units sold, customers served, hours worked, or production levels
- Price variance: Differences in selling price, supplier pricing, wage rates, or input costs
- Timing variance: Revenue or expenses recognized earlier or later than expected
- Mix variance: A shift in product, service, customer, or channel composition
- One-time event variance: Non-recurring items such as legal costs, restructuring, write-offs, or special projects
Finance teams should also distinguish between:
- Favorable vs. unfavorable variances
- Controllable vs. uncontrollable variances
This distinction matters operationally. A favorable variance may not always be good if it reflects delayed hiring, underinvestment, or postponed maintenance. An unfavorable variance may be acceptable if the business intentionally accelerated spend to capture growth.
Different financial lines also require different interpretation:
- Operating expense variances may signal overspending, delayed execution, or changes in cost structure
- Revenue variances often reflect demand shifts, pricing pressure, or sales execution issues
- Labor variances can stem from headcount timing, overtime, wage inflation, or productivity changes
- Overhead variances may reveal shared-cost allocation issues or structural inefficiencies
How to calculate budget variance analysis step by step
A seasoned finance team follows a disciplined process. The math is easy; the governance is where quality is won or lost.
1. Start with clean actual and budget data
Before analyzing anything, confirm that:
- The budget version is the approved baseline
- Actuals are complete and reconciled
- Account mappings are consistent
- Timing and cut-off rules match across systems
If the data foundation is weak, the report will produce false signals.
2. Compare results at the right level of detail
Do not analyze only at the total-company level. That hides important movement. Compare results by the dimensions that matter operationally:
- Department
- Account
- Cost center
- Project
- Product line
- Region
But avoid going so granular that the review becomes noise-heavy and slow.
3. Investigate root causes before assigning ownership
A variance should be explained before it is judged. Finance should work with department leaders to understand whether the issue was caused by:
- Execution problems
- Market conditions
- Timing shifts
- Strategic choices
- Data classification errors
This is where strong commentary standards make a major difference.
4. Document assumptions for recurring monthly reviews
Each monthly cycle should leave behind usable context for the next one. Record:
- The cause of the variance
- Whether it is expected to recur
- Whether it affects the forecast
- Who owns the next action
- What deadline applies
That documentation creates institutional memory and improves future planning.
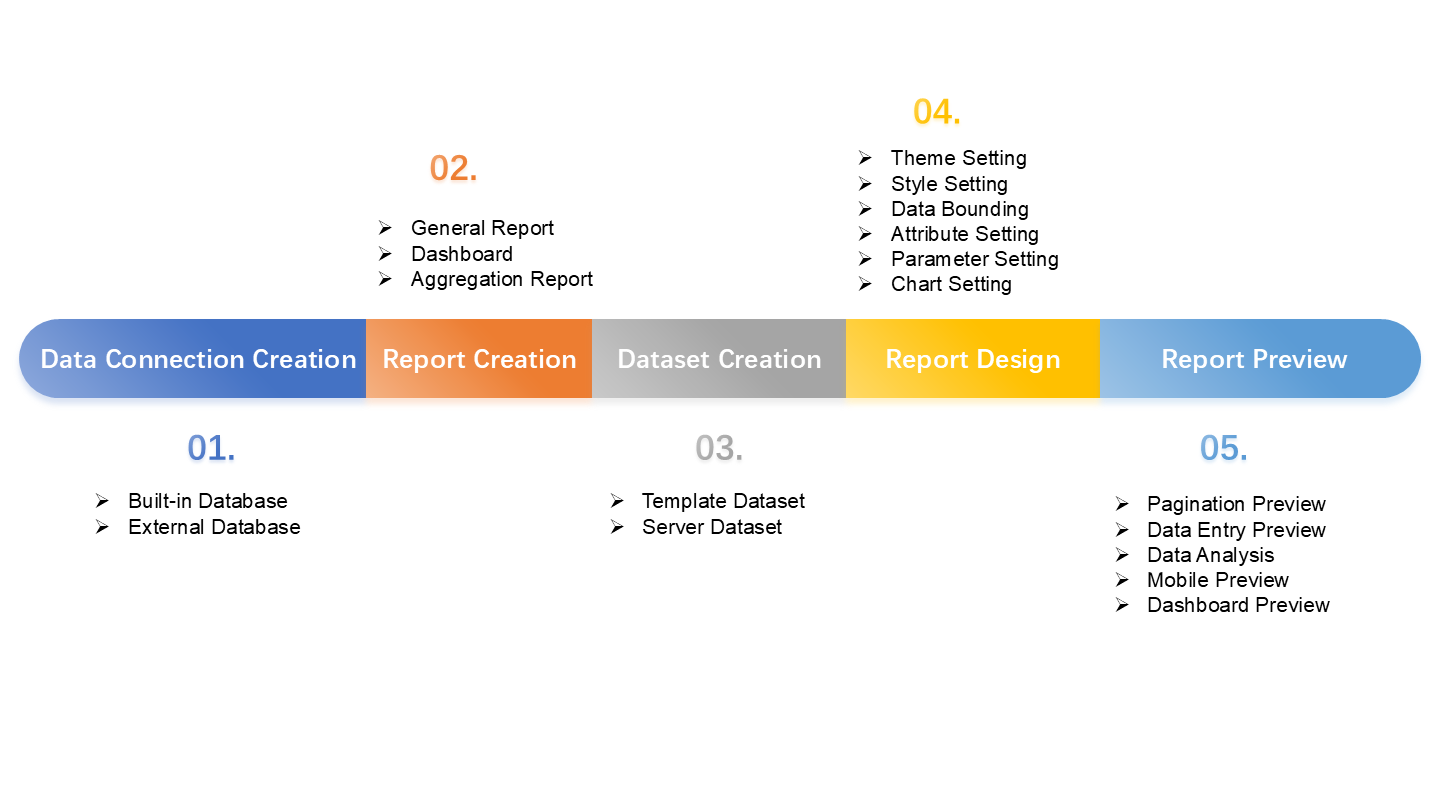
How to build a budget variance analysis process leaders will trust
Finance leaders trust a process when it is consistent, transparent, and connected to decisions. They lose trust when variance reporting feels subjective, late, or disconnected from operational reality.
A reliable process starts with cadence. Most organizations need monthly reviews at minimum, with quarterly deep dives for structural shifts. That cadence should define owners, deadlines, and approval steps clearly.
Core process requirements include:
- A fixed reporting cadence so leaders know when to expect the report
- Named owners for preparation, review, and approval
- Standard categories for variance drivers and commentary
- A workflow for escalation and corrective action
- A decision-oriented meeting format focused on what changes next
Use consistent categories over time. If one month labels a variance as “timing” and the next month calls the same issue “miscellaneous,” trend analysis becomes useless. Standardization is what allows leaders to spot patterns instead of isolated explanations.
Narrative summaries should also be concise. Finance executives do not need paragraphs of defensive language. They need a short explanation of the business impact:
- What happened
- Why it matters
- What decision is recommended
Review meetings should center on decisions, not storytelling. The most productive discussions are about reallocating budget, adjusting forecasts, pausing spend, or accelerating investment—not simply reciting numbers everyone can already see.
Moving from basics to expert insights
Expert-level variance analysis focuses on the few issues that alter planning outcomes. That means prioritizing variances that:
- Change the current forecast
- Affect resource allocation
- Create recurring risk
- Reveal a structural trend
- Signal a shift in demand or cost base
Trend analysis separates anomalies from patterns. A one-time overspend in travel may not matter. A three-month rise in contractor costs probably does. Benchmarking against prior periods, run rates, or peer departments can add useful context.
The strongest finance teams connect variance findings directly to:
- Rolling forecasts
- Headcount plans
- Spend controls
- Scenario models
- Strategic planning updates
This is where a budget variance report becomes more than retrospective reporting. It becomes an operating system for better financial decisions.
How to design a variance report finance leaders will actually use
Design matters because even strong analysis fails if executives cannot scan it quickly. A finance leader should be able to review the report in minutes, identify the top issues, and know where to drill deeper.
The best layout principles are simple:
- Put exceptions first
- Keep summary views on top
- Use clean visual hierarchy
- Limit detail to what supports action
- Make filters intuitive
A practical design often includes:
-
Executive summary at the top
High-level KPIs, major favorable and unfavorable variances, and forecast impact. -
Exception table next
Only material variances ranked by size, risk, or urgency. -
Drill-down analysis below
Department, account, cost center, or project views. -
Commentary and actions section
Owner, next step, deadline, and status.
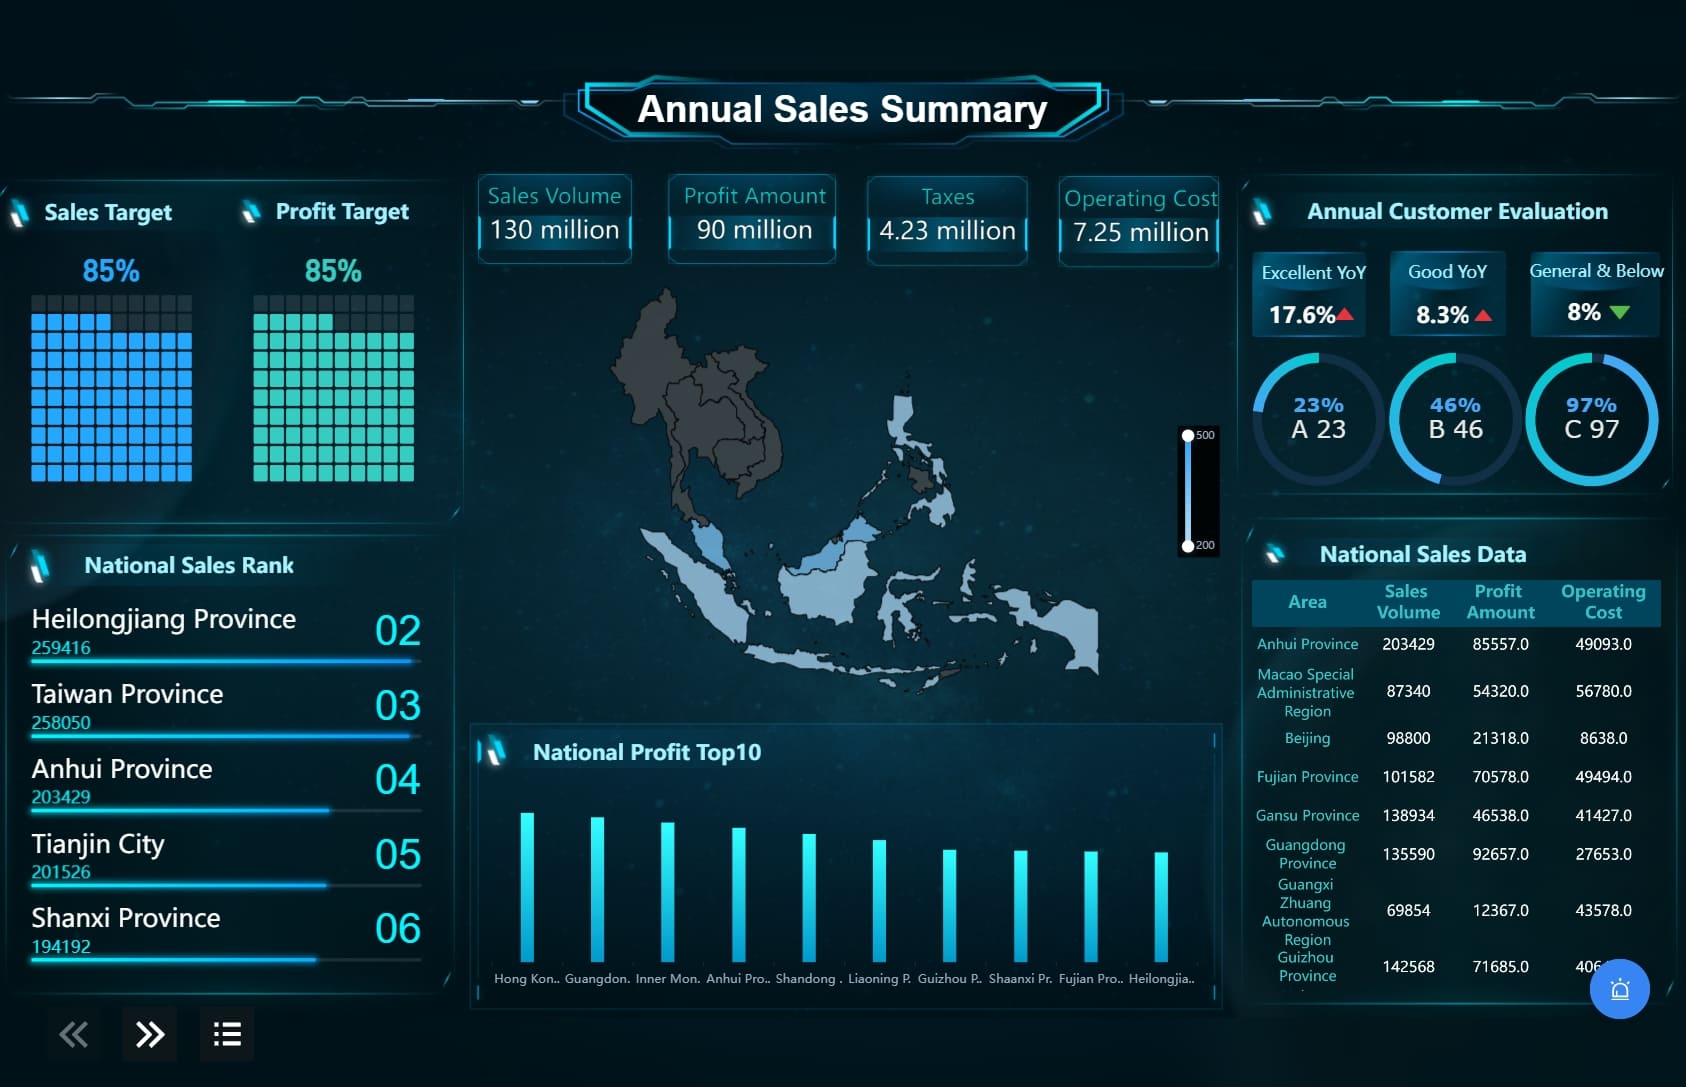
Tailor the level of detail by audience:
- Executives need top-line exceptions, trends, and business implications
- Finance teams need drill-downs, classifications, and forecast links
- Budget owners need line-item detail, accountability, and required actions
A strong report also includes recommended actions. Do not leave readers to infer the next step. If hiring should be paused, say so. If a forecast should be revised, mark it. If a one-time variance requires no action, state that clearly.
Common mistakes that make variance reports less useful
Many budget variance reports fail for predictable reasons. The most common mistakes include:
-
Too many lines, too little interpretation
When every account appears in the same view, important issues disappear in clutter. -
Inconsistent formulas or definitions
If one team calculates percentage variance differently from another, trust erodes fast. -
Numbers without context
A variance alone is not insight. Leaders need trend, cause, and impact. -
No distinction between major and minor issues
Treating every variance as equally important overwhelms reviewers and slows action. -
Weak commentary
Vague explanations like “higher than expected” do not support decision-making. -
No accountability mechanism
Without owners and deadlines, the report becomes historical documentation, not management control.
The fix is not adding more data. The fix is better structure, better thresholds, and better workflow.
Turning the report into ongoing financial decisions
The real purpose of a budget variance report is not to close the month. It is to improve the next one.
Finance teams should use variance findings to refine:
- Budgets
- Forecasts
- Spending controls
- Department plans
- Capital allocation decisions
That means building follow-up actions into monthly and quarterly review cycles. Each material variance should lead to one of a few outcomes:
- Maintain course because the issue is temporary
- Correct spending or execution immediately
- Update the forecast
- Reallocate resources
- Escalate the issue to leadership
You should also track whether prior corrective actions reduced repeat variances. This is one of the most overlooked steps in finance reporting. If the same unfavorable variance appears for three review cycles, the issue is not reporting visibility. It is failed execution or poor planning assumptions.
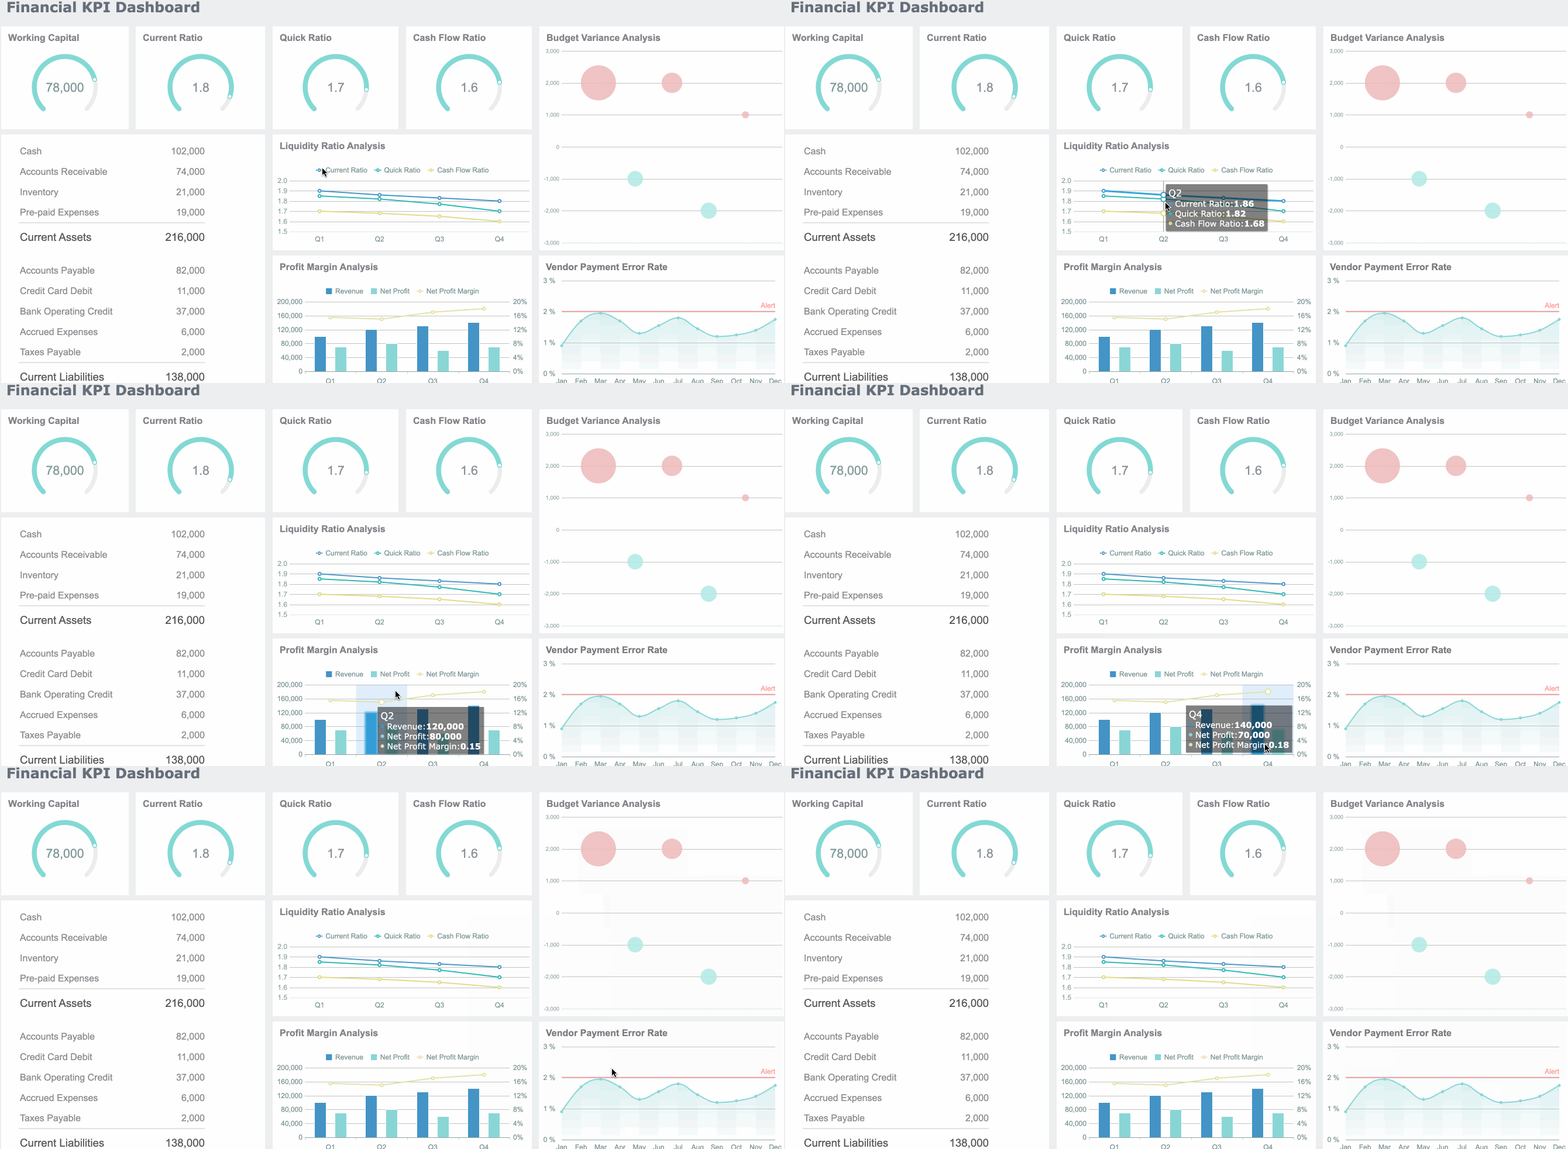
Over time, that creates a feedback loop that improves planning accuracy. Budgets become more realistic, forecasts become more responsive, and operating leaders become more accountable.
Build it faster and smarter with FineReport
Building this manually is complex; use FineReport to utilize ready-made templates and automate this entire workflow.
For most finance teams, the challenge is not understanding variance analysis. The challenge is operationalizing it across multiple entities, departments, and data sources without relying on fragile spreadsheets. FineReport helps solve that by giving teams a faster way to build, standardize, and scale budget variance reporting.
With FineReport, you can:
- Connect budget and actual data from multiple systems
- Build executive dashboards and drill-down reports
- Standardize formulas, thresholds, and commentary structures
- Automate recurring report generation and distribution
- Add workflow-ready fields for owners, actions, and approvals
- Create role-based views for executives, FP&A, and department leaders

Get Ready-to-Use Dashboard Templates in Fine Gallery
If your team is still stitching together monthly files, rechecking formulas, and manually chasing commentary, automation is the next logical step. FineReport gives finance leaders a practical way to turn a basic budget variance report into a trusted management tool.
A finance leader will actually use a variance report when it is fast to read, easy to trust, and directly tied to action. That is the standard to design for—and the standard FineReport makes far easier to achieve.
FAQs
A budget variance report compares actual results to budgeted figures so finance leaders can see where performance is off plan, why it happened, and what to do next. Its main value is helping teams make faster decisions, not just documenting past results.