A digital marketing report is the operating system for better marketing decisions. If you are a marketing leader, agency account manager, operations director, or analyst, the challenge is rarely a lack of data. The real problem is turning fragmented channel metrics into a clear view of what is driving leads, pipeline, revenue, and efficiency. A strong report helps stakeholders cut through noise, spot risks early, justify budget, and decide what to scale next.
What a digital marketing report is and why decision-makers use it
A digital marketing report is a structured summary of marketing performance across channels, campaigns, and periods. Its purpose is simple: transform raw data into decisions. Instead of forcing stakeholders to interpret disconnected dashboards from ad platforms, web analytics, CRM tools, and email systems, the report connects activity to business outcomes.
For decision-makers, that matters because budget allocation, campaign pacing, hiring, forecasting, and client communication all depend on trustworthy reporting. A report should not just show numbers. It should explain what changed, why it changed, and what action is recommended.
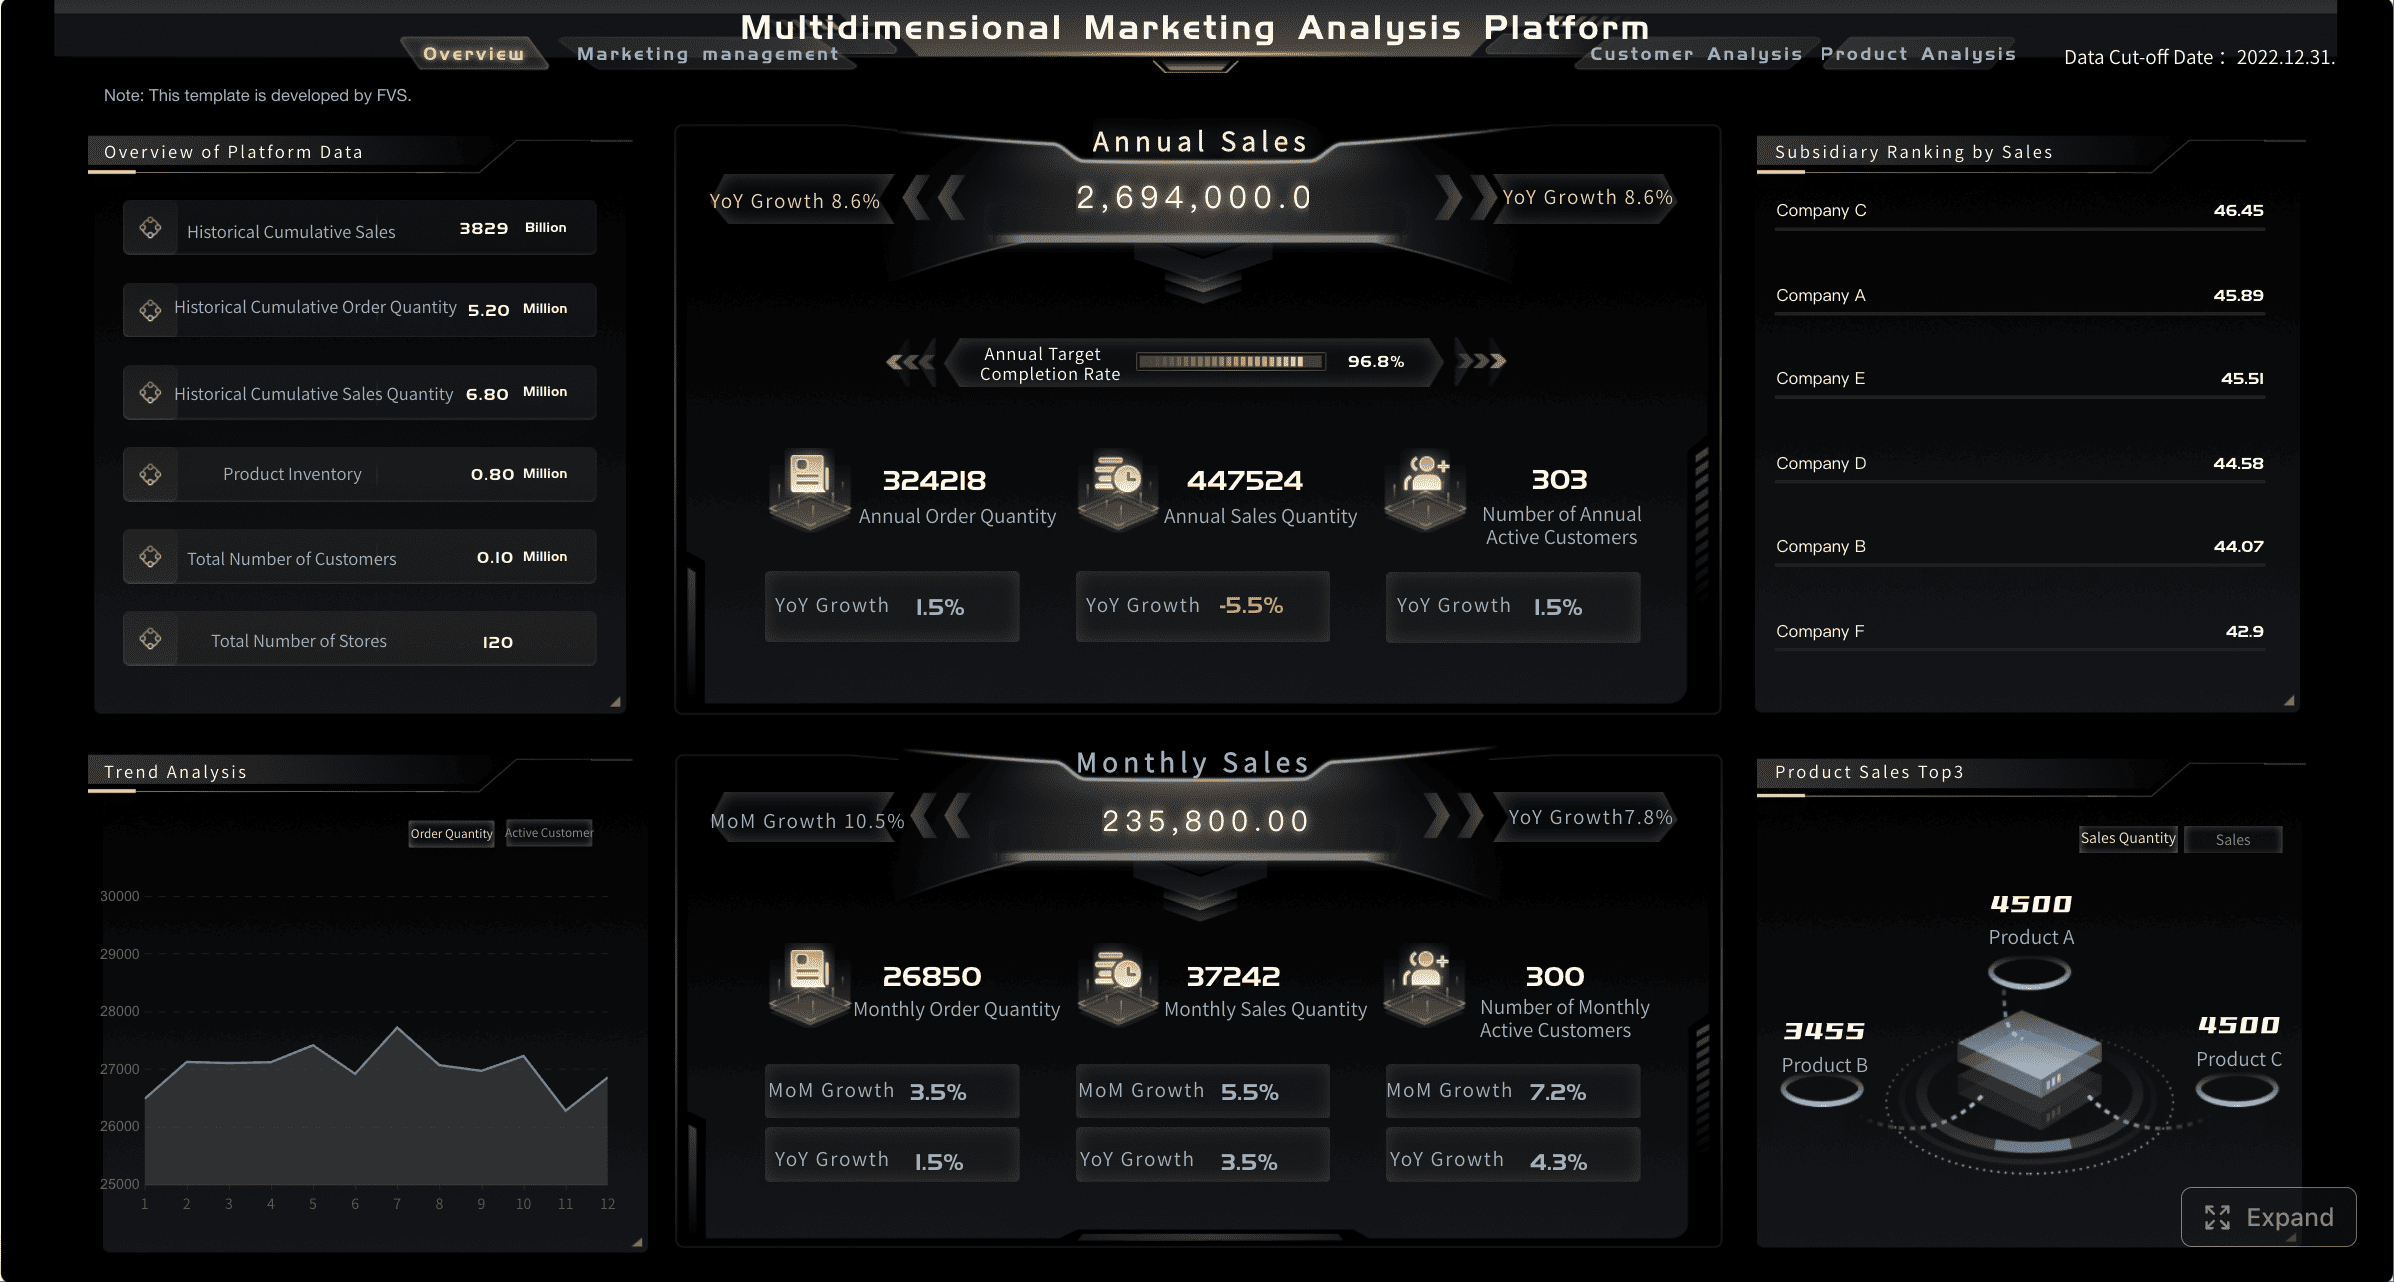
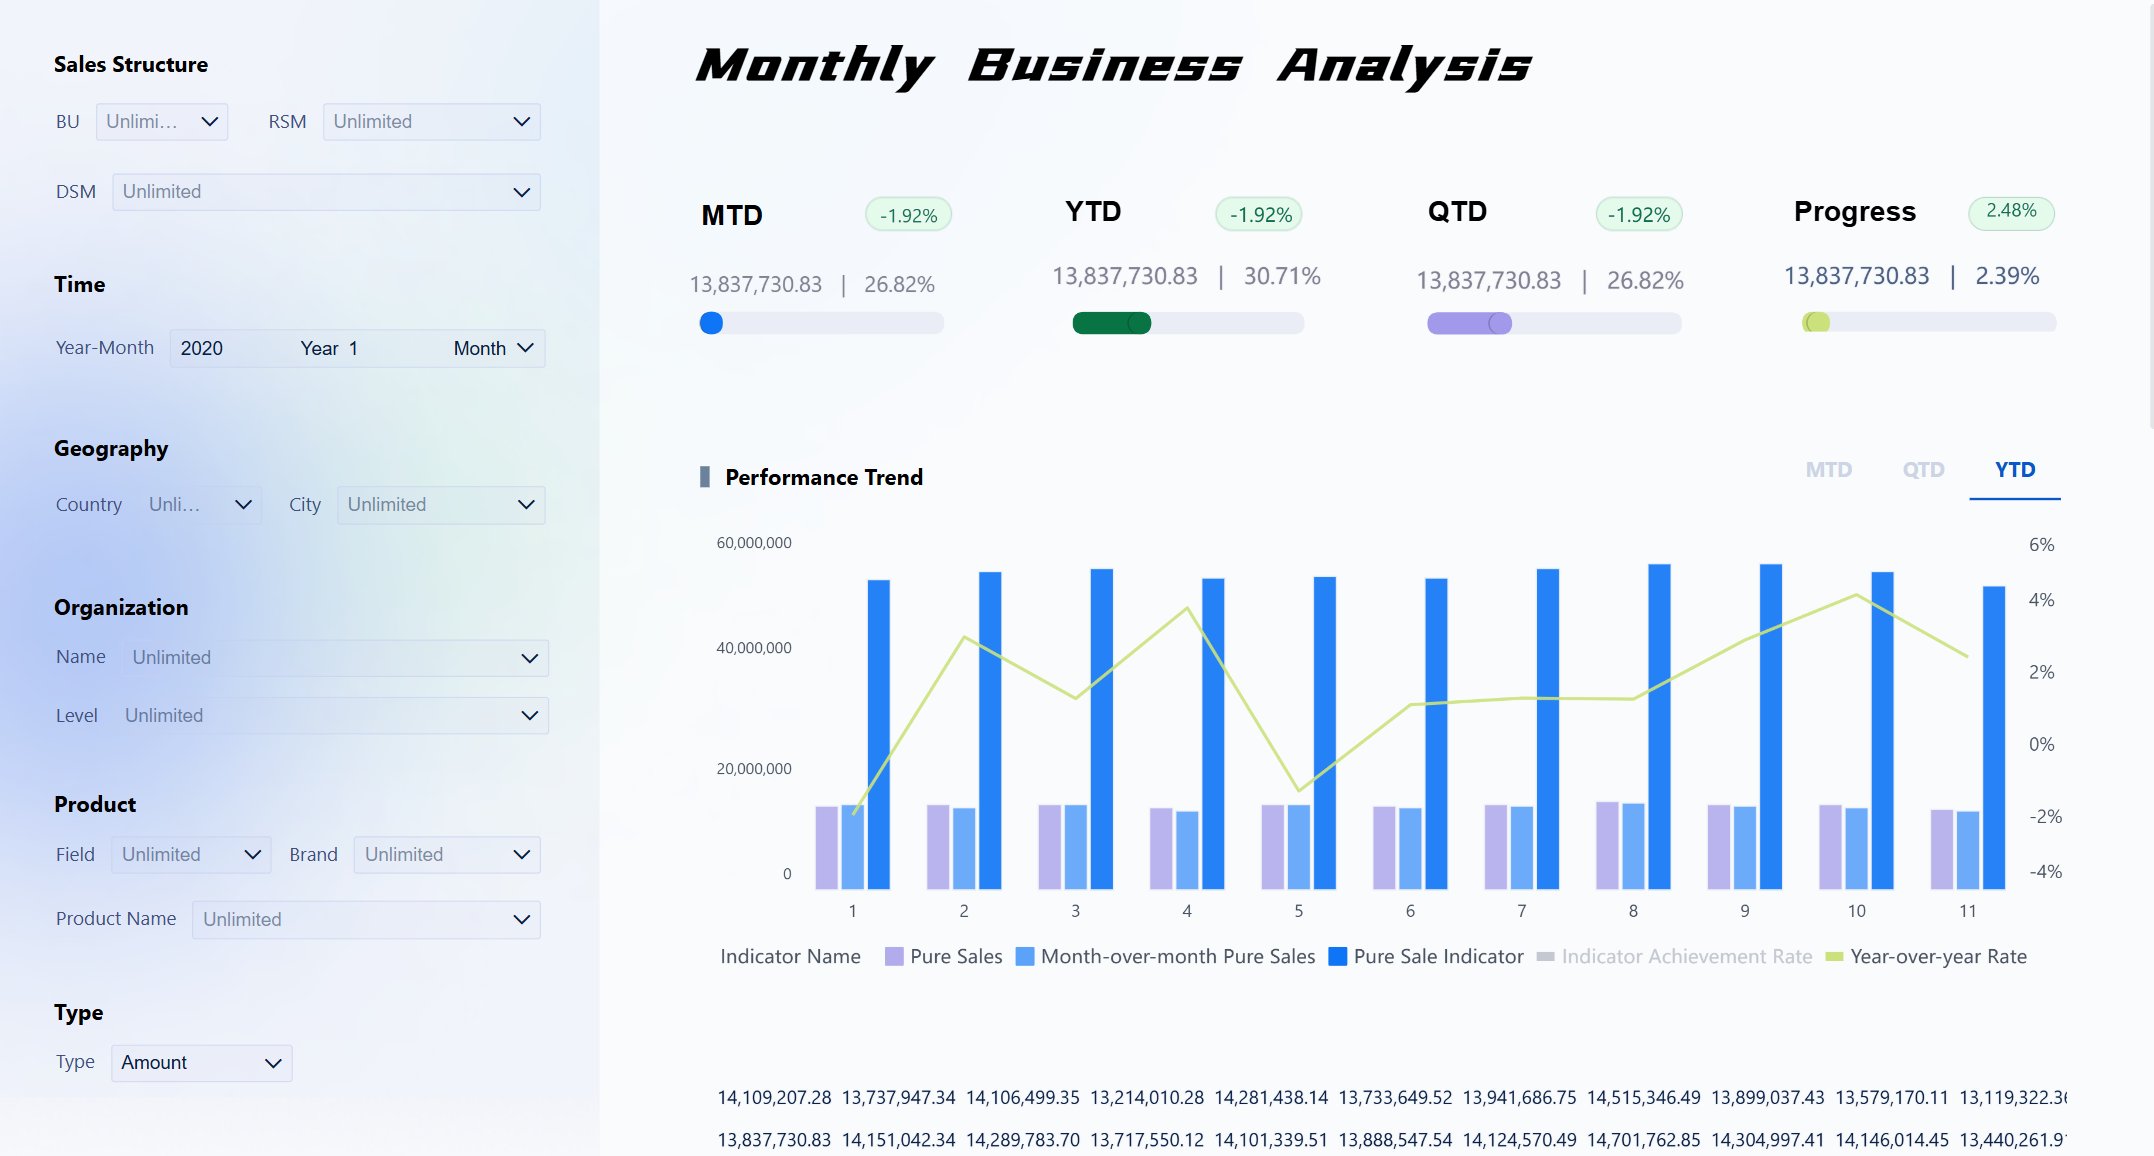
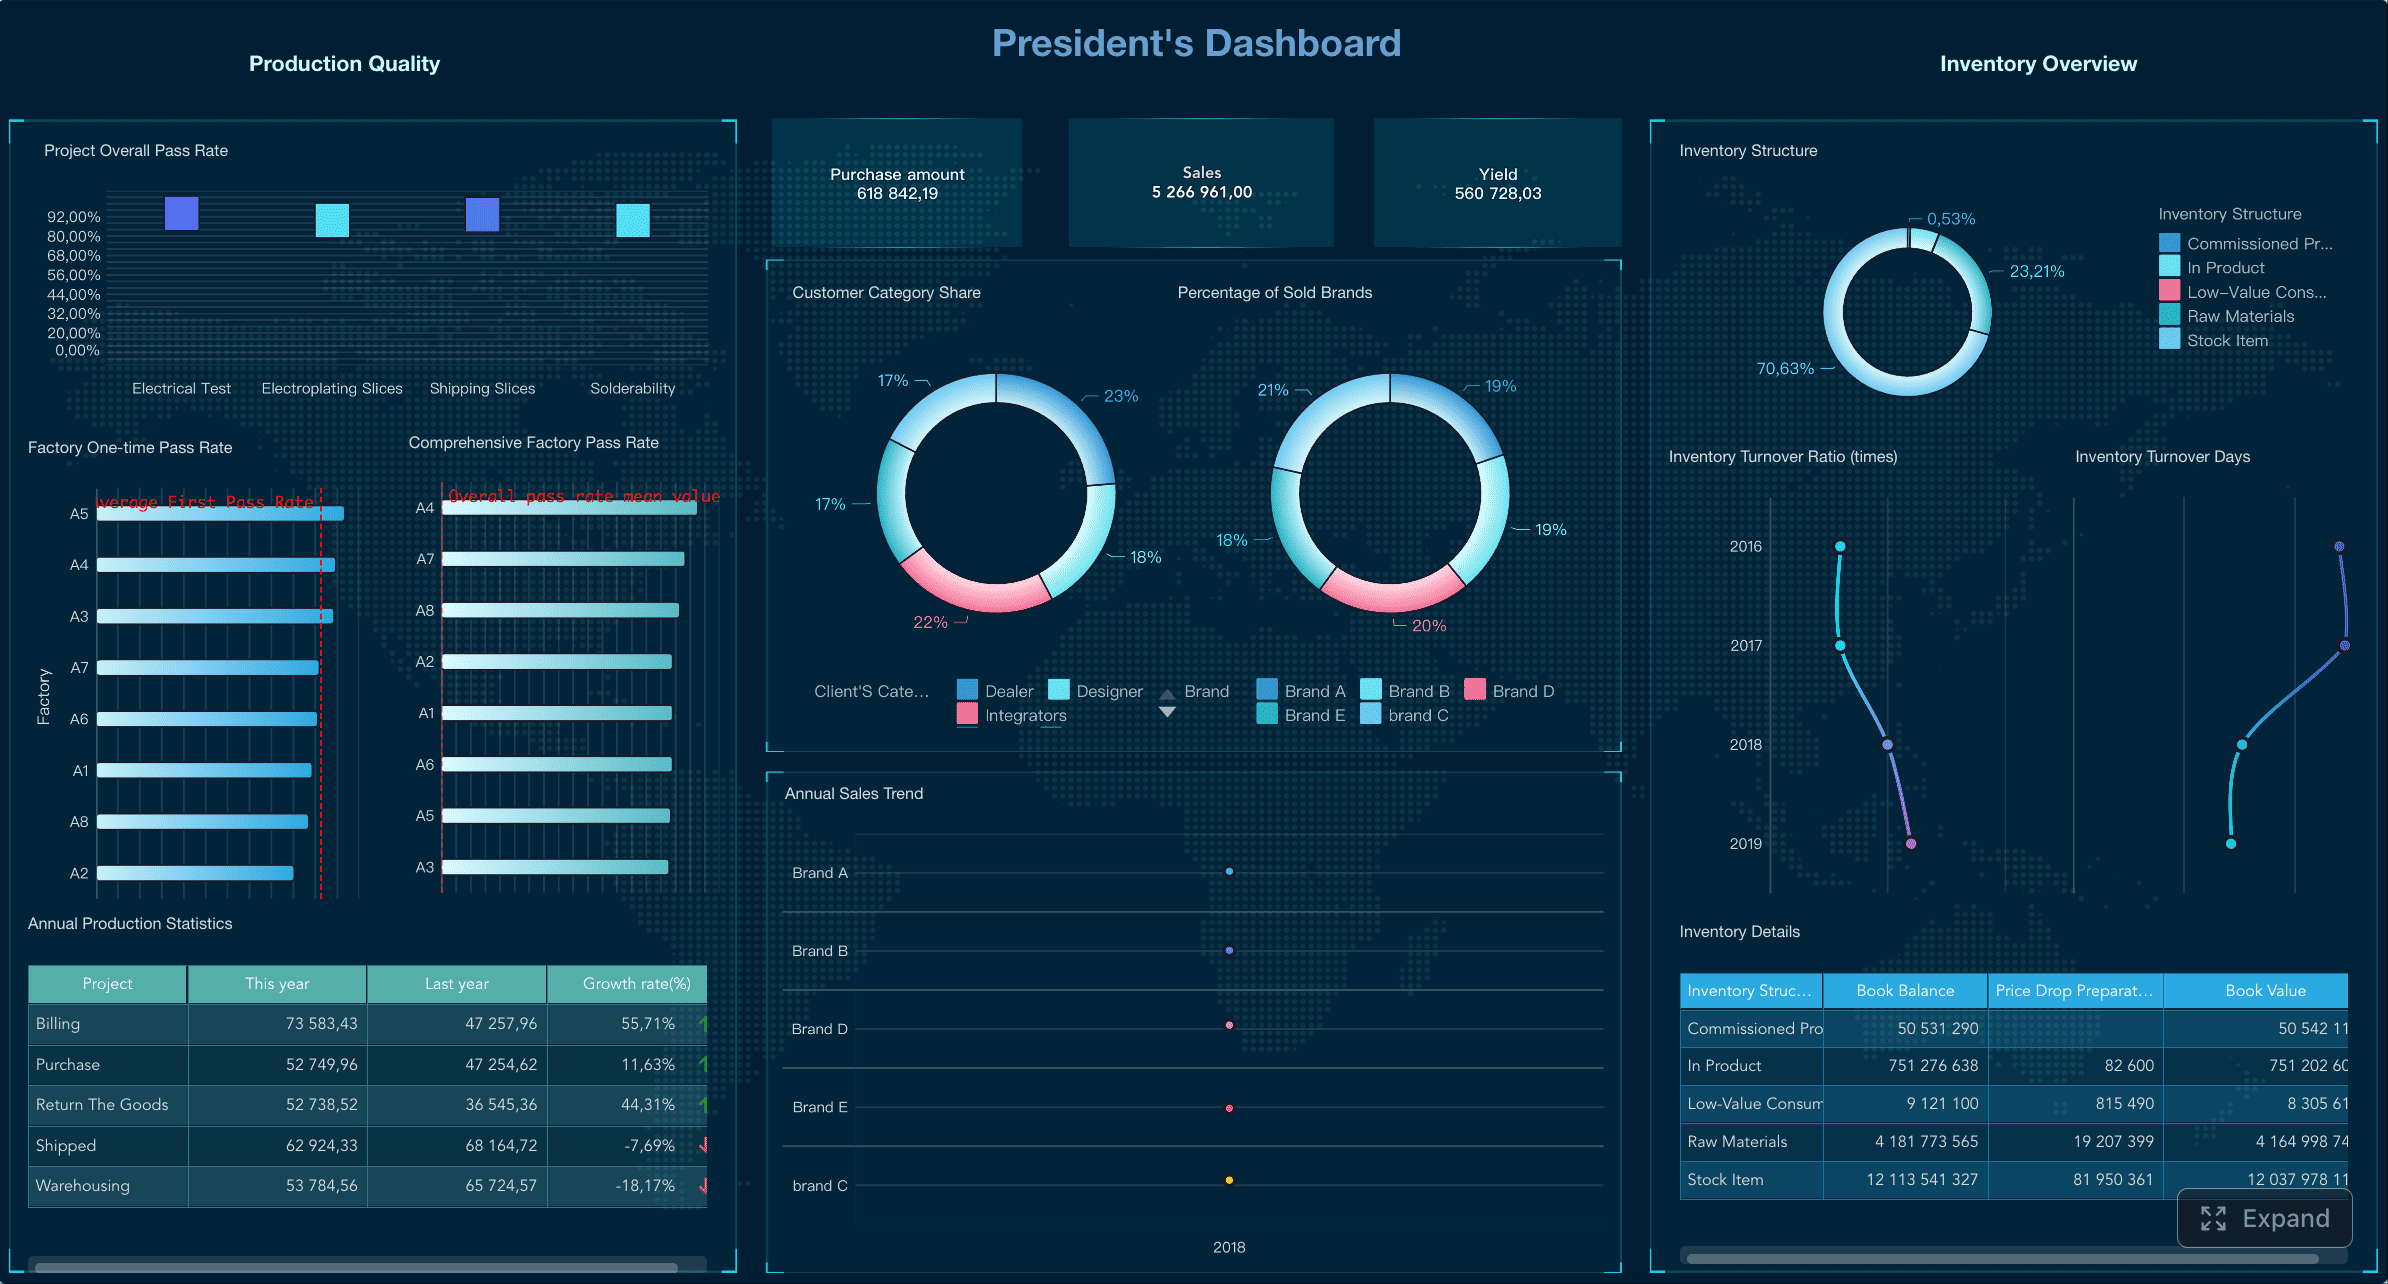
All reports in this article are built with FineReport.
Raw dashboards vs. channel summaries vs. executive-ready reporting
These three formats often get confused, but they serve different purposes:
Raw dashboards show live or near-real-time metrics.
Best for practitioners monitoring daily performance.
Often too detailed for executives.
Channel summaries focus on one marketing area such as SEO, PPC, email, or social.
Useful for specialists and channel managers.
Good for diagnosing execution issues.
Executive-ready reporting connects channel performance to broader business goals.
Focuses on outcomes, risks, trends, and recommendations.
Built for founders, leadership teams, and clients.
An executive does not need 40 widgets. They need answers to questions like:
Are we on track to hit lead or revenue targets?
Which channels are improving efficiency?
Where is budget underperforming?
What should we change next month?
Why reporting cadence matters
A good reporting cadence helps teams identify patterns before they become expensive problems.
Weekly reports help teams catch pacing issues, campaign fatigue, tracking errors, and sudden conversion drops.
Monthly reports are ideal for trend analysis, budget reallocation, and performance reviews.
Quarterly reports support strategic planning, target resets, and investment decisions.
Campaign-end reports clarify what worked, what failed, and what should be repeated.
The right cadence depends on spend, reporting audience, and business velocity. Fast-moving paid media programs may need weekly reviews. Executive reporting often works best monthly with quarterly strategic rollups.
How to build a digital marketing report that gets results
Building a report that gets used is not about adding more charts. It is about designing the report around business questions and stakeholder decisions.
Start with the business goal and audience
Before selecting any metric, define two things:
What business decision should this report support?
Who will read it?
A founder wants a summary tied to growth and efficiency. A client wants proof of value and clear next steps. A channel manager needs granular performance detail. A CMO wants performance connected to pipeline, revenue, and forecast confidence.
Use this framing:
Audience
Primary Questions
Best Report Focus
Founder / CEO
Is marketing driving growth efficiently?
Revenue, CAC, ROAS, pipeline, risks
CMO / VP Marketing
Which channels deserve more investment?
Channel contribution, lead quality, efficiency trends
Client
Are we delivering value and making smart decisions?
Engagement Rate: Level of interaction with content or social posts.
Organic Sessions: Visits coming from unpaid search traffic.
Email Open Rate: Percentage of recipients who opened an email.
Email Click Rate: Percentage of recipients who clicked within an email.
Bounce Rate or Engagement Metrics: Indicators of landing page or content quality.
Customer Lifetime Value (LTV): Total value expected from a customer over time.
Leading indicators vs. lagging indicators
One of the most common reporting mistakes is relying only on lagging outcomes like revenue. Those matter most, but they do not explain what is changing early enough.
Leading indicators include CTR, landing page conversion rate, engagement, traffic quality, email clicks, and MQL volume.
Lagging indicators include pipeline, revenue, ROAS, CAC, and retention.
A reliable report uses both. Leading indicators warn you early. Lagging indicators validate whether strategy is actually working.
Organize the report into a clear structure
A report that gets results follows a repeatable flow. This makes it easier for stakeholders to read quickly and compare periods consistently.
A high-performing structure usually includes:
Executive summary
KPI snapshot
Channel performance
Analysis and insights
Recommendations
Next steps
Each section should answer a specific question:
Section
What It Should Answer
Executive Summary
What matters most this period?
KPI Snapshot
Are we on track against goals?
Channel Performance
Which channels drove results or missed targets?
Analysis
Why did results change?
Recommendations
What should we do next?
Next Steps
Who owns which action and by when?
Turn data into insights and actions
This is where most reports fail. They show movement without interpretation.
To make a report actionable, compare results against:
Goals
Previous period
Year-over-year trend
Benchmark or target range
Budget plan
Then explain three things clearly:
What changed
Why it changed
What should happen next
Example:
Paid search conversions fell 18% month over month.
Primary cause: branded traffic held steady, but non-brand CPC increased 22% due to higher auction competition.
Recommended action: shift budget toward high-intent terms, pause two low-efficiency ad groups, and test a revised landing page offer.
That level of explanation is what turns reporting into management.
Core sections every effective digital marketing report should include
Executive summary for busy stakeholders
The executive summary is the most-read section of the report. It should be skimmable, direct, and written for non-specialists.
A strong executive summary includes:
Biggest win
Biggest loss or concern
Most important trend
Budget implication
Recommended next action
Example format:
Win: Organic search drove a 24% increase in qualified leads after three high-intent pages improved rankings.
Risk: Paid social CPA rose 19% due to audience fatigue and lower click-through rates.
Opportunity: Email re-engagement campaigns produced the lowest-cost conversions this month.
Action: Reallocate 12% of paid social spend into branded search and lifecycle email testing.
KPI dashboard and channel breakdown
The KPI dashboard should summarize the metrics that matter most. Keep it focused. More widgets do not create more insight.
Sends, open rate, click rate, unsubscribe rate, conversions
Social
Reach, engagement, clicks, leads, CPA
Content
Traffic, time on page, assisted conversions, lead generation
Website
Sessions, conversion rate, bounce or engagement metrics, form completion
This is where centralized reporting tools become valuable. FineReport is especially useful when teams need to combine data from multiple business systems into one executive-friendly view without forcing stakeholders to jump across platforms.
Not every report should look the same. The format should match the use case.
Weekly report
Best for:
Campaign pacing
Budget control
Identifying anomalies
Fast optimization cycles
Include:
Spend vs. budget
Lead volume
CPA or CPC movement
Key changes from prior week
Immediate action items
Monthly report
Best for:
Leadership visibility
Trend analysis
Cross-channel review
Team accountability
Include:
KPI summary
Channel comparisons
Major wins and losses
Strategic recommendations
Next-month actions
Campaign report
Best for:
Product launches
Seasonal pushes
Promotions
Short-term performance reviews
Include:
Campaign objectives
Audience and targeting
Spend and return
Creative or message performance
Lessons learned
Channel-specific report
Best for:
Specialists and deep optimization work
Include:
Channel KPIs
Segment breakdowns
Test results
Problem areas
Tactical next steps
Client-facing report
Best for:
Agencies
Consulting teams
Fractional marketing leaders
Include:
Value delivered
Clear explanation of trade-offs
Outcome-focused metrics
Strong narrative
Transparent recommendations
Recommendations and action plan
A report is incomplete without an action plan. Recommendations should be prioritized by impact and effort.
A practical action plan includes:
Priority
Recommendation
Expected impact
Owner
Due date
Example:
Priority
Recommendation
Expected Impact
Owner
Due Date
High
Shift 15% of paid budget to highest-ROAS campaigns
Lower blended CPA
Paid Media Lead
Next 7 days
High
Fix mobile form abandonment issue on lead page
Improve conversion rate
Web Team
Next 10 days
Medium
Refresh creative for fatigued paid social audiences
Improve CTR and lower CPA
Creative Team
This month
Medium
Expand winning SEO cluster with 3 supporting pages
Grow MQL volume
SEO Manager
This month
Templates and examples to speed up building a digital marketing report
Simple template for monthly reporting
A repeatable monthly template saves time and improves consistency. Here is a practical structure you can reuse.
Monthly digital marketing report template
Report overview
Reporting period
Business objective
Report owner
Executive summary
3 to 5 bullets on wins, risks, and actions
Headline KPIs
Leads
Pipeline
Revenue
ROAS
CAC
Conversion rate
Channel performance
Paid search
SEO
Email
Social
Content
Website
Insights
What changed
Why it changed
What it means
Recommendations
Prioritized action list
Next steps
Owners and deadlines
This structure works especially well when built in a centralized reporting environment. FineReport can help teams standardize this template across brands, regions, or clients while automating data refresh and formatting.
Agency and client reporting example
Agency and client reporting has a different burden: it must show performance and reinforce trust. That means clarity, transparency, and commercial relevance.
Best practices for making your digital marketing report easier to trust and use
Keep metrics consistent and definitions clear
Reporting loses credibility fast when definitions change month to month.
Standardize:
Attribution windows
Naming conventions
Channel groupings
Conversion definitions
Revenue logic
Time periods
Currency and cost treatments
If one team uses 7-day click attribution and another uses platform-reported view-through conversions, your report will create false comparisons. Clear definitions protect trust.
Make the story obvious with visuals
The purpose of visualization is faster understanding, not decoration.
Use visuals that answer questions quickly:
Line charts for trends over time
Bar charts for channel comparison
Funnel charts for stage drop-off
Variance callouts for target gaps
Annotations for campaign launches, site issues, or budget changes
Make sure every chart has:
A clear title
A time range
A metric label
Context or benchmark where needed
Avoid common reporting mistakes
The most common reporting problems are operational, not technical.
Avoid these mistakes:
Overloading reports with vanity metrics
Reporting clicks without tying them to outcomes
Showing channel data in isolation
Hiding bad performance instead of explaining it
Ignoring attribution assumptions
Mixing inconsistent time windows
Providing no recommendations
Using too many dashboards for one audience
A stakeholder should not need a meeting to understand the report. The report should stand on its own.
Build a reporting workflow that scales
As marketing programs expand, manual reporting becomes expensive and error-prone. A scalable workflow should automate data collection where possible and reserve human effort for analysis.
Best-practice implementation steps
Define a single reporting framework
Agree on business goals, KPI definitions, channel naming, and reporting cadence.
Connect ad platforms, analytics tools, CRM, and web data into one reporting layer.
Create role-based templates
Build one executive template, one channel template, and one client template.
Add an insight review process
Require analysts or managers to validate anomalies and add recommendations before reports are shared.
Track action outcomes
Review whether previous recommendations were executed and whether they improved results.
This is where enterprise teams benefit from using a flexible reporting platform. FineReport can support automated refreshes, role-based dashboards, custom data integration, and presentation-ready report outputs that reduce manual work without sacrificing analysis quality.
Actionable best practices to implement a better digital marketing report
If you want your reporting to become a real decision-making tool, these are the practices I recommend most often as a consultant.
1. Start every report with one business question
Do not begin with available data. Begin with the decision the report needs to support.
Examples:
Which channel should receive more budget next month?
Why did lead quality decline?
Are we hitting revenue targets efficiently?
That question should shape the report structure.
2. Limit the primary KPI set
For most stakeholders, 5 to 8 primary metrics are enough. Supporting metrics can appear later in the report.
A simple primary KPI set might be:
Leads
Pipeline
Revenue
ROAS
CAC
Conversion rate
Retention
This keeps attention on business outcomes.
3. Add written commentary to every major chart
Never assume the audience will interpret charts correctly. Add a short note below key visuals explaining:
What changed
Why it matters
What action is recommended
That small layer of interpretation dramatically increases report usability.
4. Separate signal from noise
Not every metric change deserves attention. Highlight only material changes, such as:
Variance above 10%
Budget shifts over a defined threshold
Conversion issues affecting core funnel stages
Meaningful quality changes in lead or revenue mix
This helps the audience focus on what matters.
5. End with owned next steps
The report should close with action, not observation.
Every recommendation should have:
An owner
A timeline
A success metric
Without this, reporting becomes passive.
Final thoughts
A great digital marketing report does more than summarize channel data. It aligns teams, builds stakeholder confidence, and improves decisions about budget, messaging, optimization, and growth. The best reports are tailored to the audience, grounded in outcome-based KPIs, structured around clear business questions, and finished with specific next steps.
If your current reporting is slow, fragmented, or difficult to trust, the fastest improvement usually comes from standardizing definitions, simplifying the KPI layer, and centralizing the reporting workflow. Once that foundation is in place, every monthly report becomes easier to produce and more useful to act on.
If you want to build executive-ready dashboards and reports that combine clarity, automation, and enterprise flexibility, FineReport is a practical place to start.
A strong digital marketing report should include business goals, core KPIs, channel performance, trend comparisons, insights, and clear next steps. The best reports connect marketing activity to leads, pipeline, revenue, and efficiency.
Reporting frequency depends on spend, audience, and how fast campaigns change. Weekly reports help with optimization, while monthly and quarterly reports are better for executive review and strategic planning.
The most useful KPIs are the ones tied to outcomes, such as leads, MQLs, pipeline, revenue, ROAS, CAC, and conversion rate. Supporting metrics like CTR, CPC, and CPA help explain why performance changed.
Start with the decision the report needs to support, then choose only the metrics that answer that question. Add context, explain what changed and why, and finish with specific recommendations for what to do next.
A dashboard usually shows live or near-real-time metrics for monitoring performance. A digital marketing report adds analysis, context, and recommendations so stakeholders can make decisions with confidence.
Product Trial
FineReport
Pixel-perfect reports · Interactive dashboards · Easy data entry · Digital twins