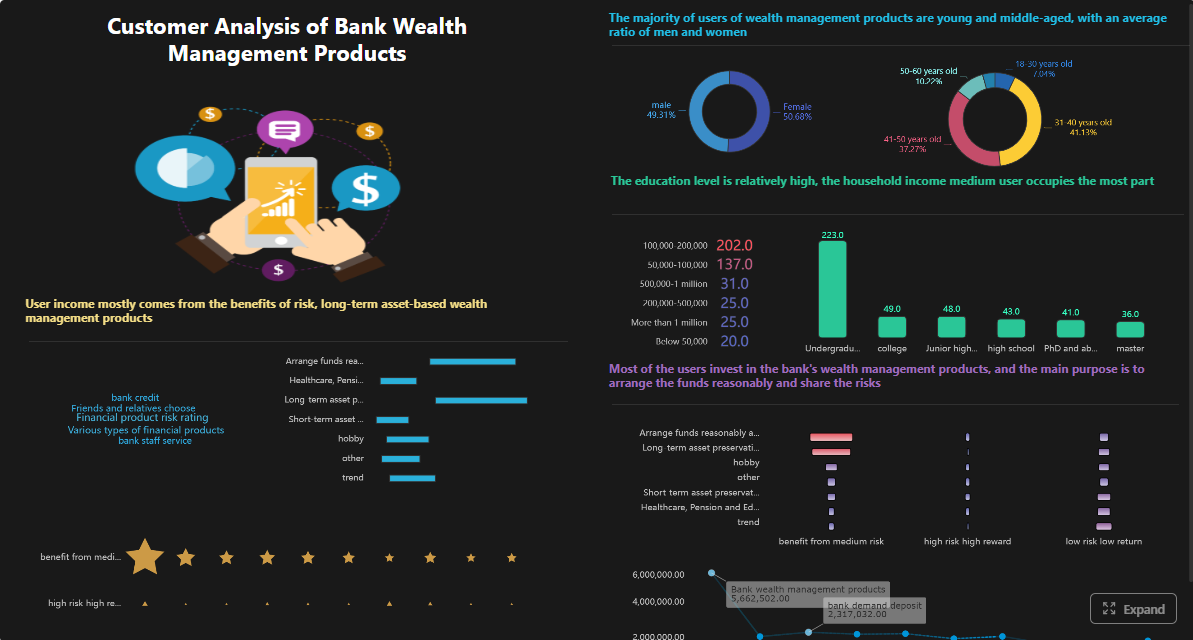
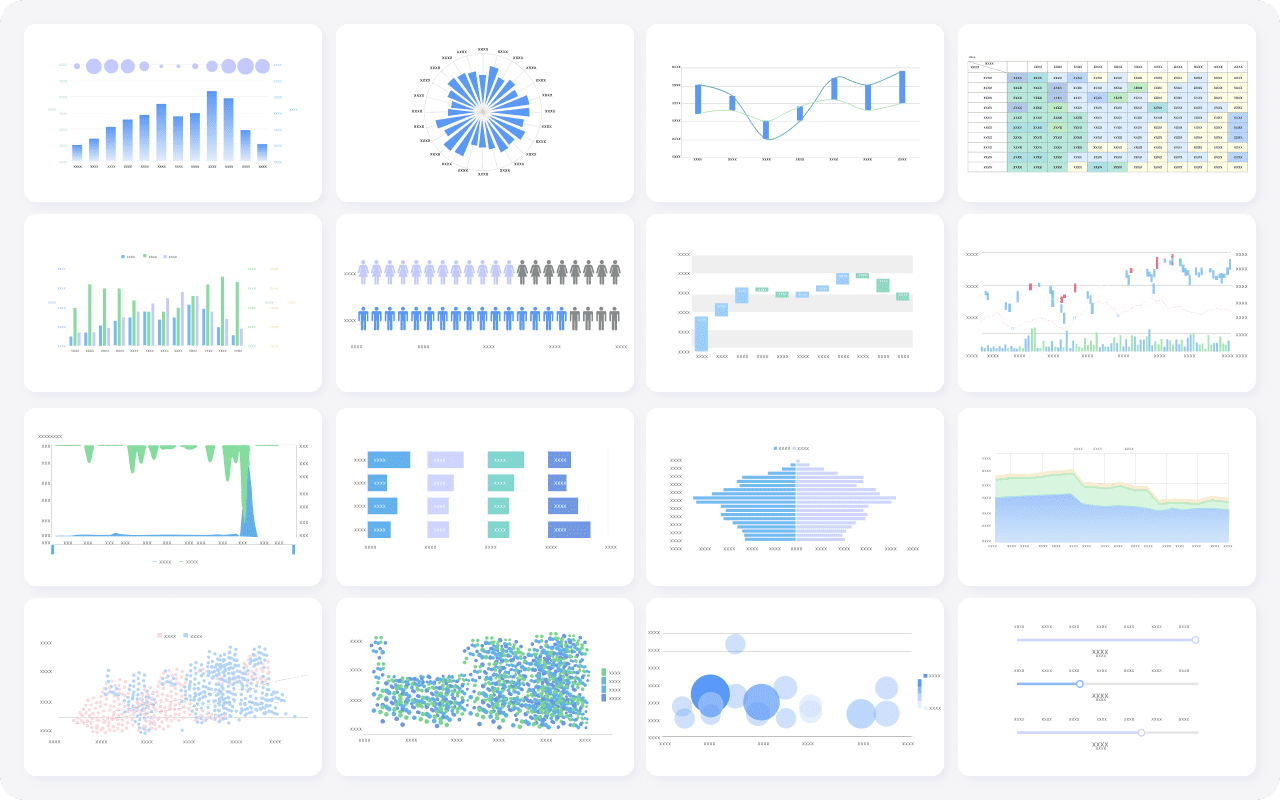
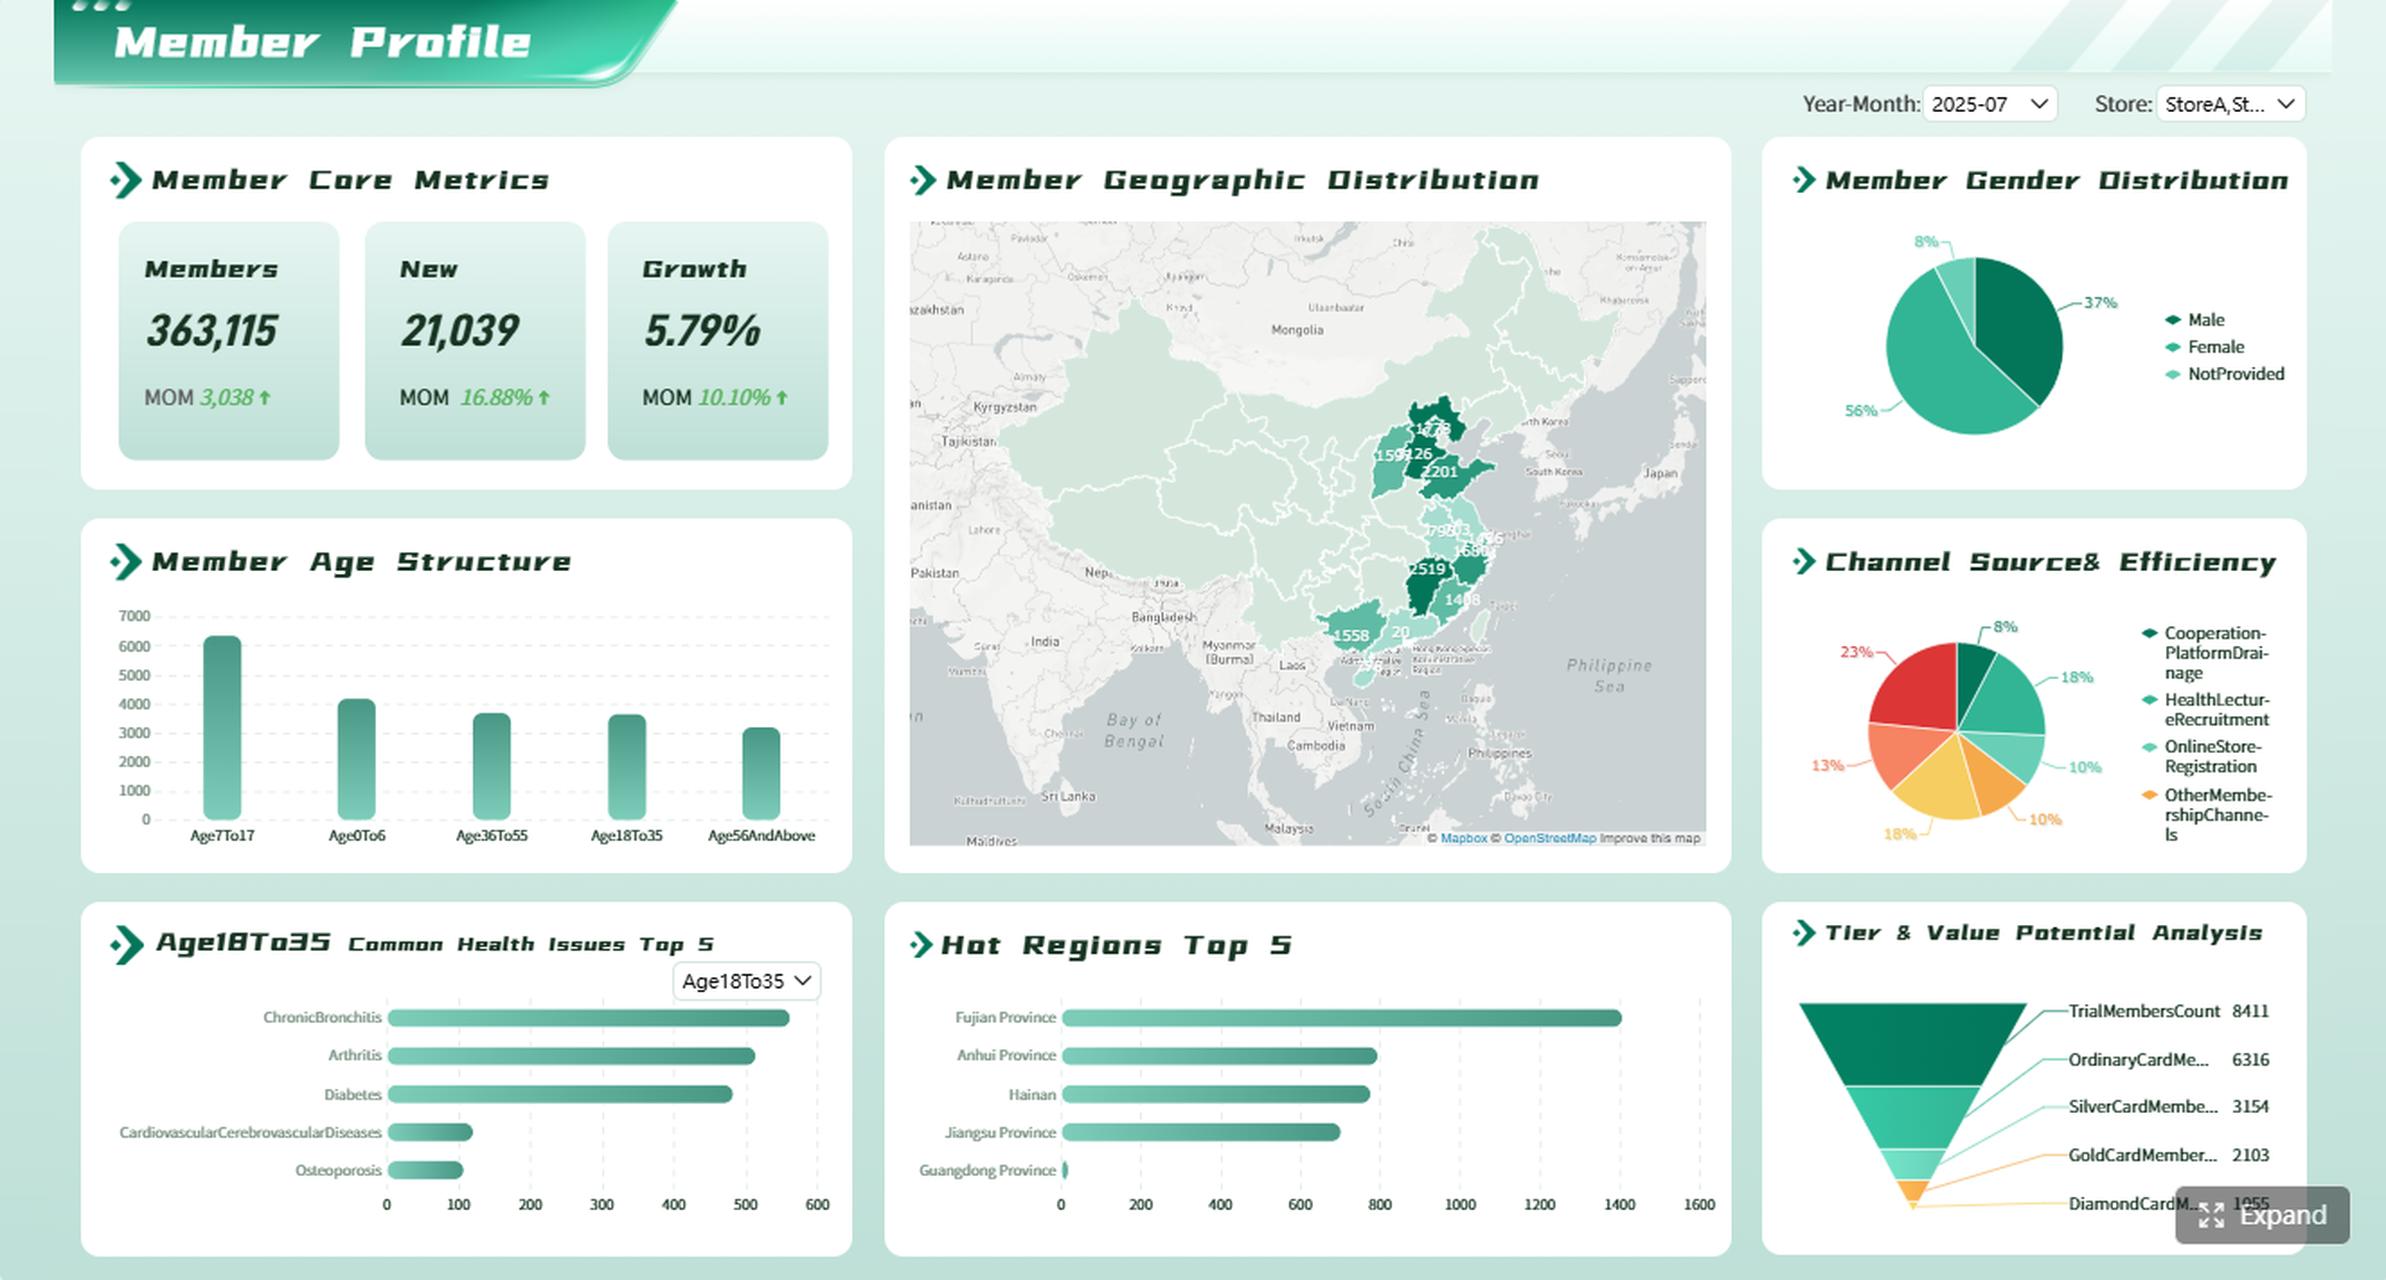
A crm report is the practical layer between raw customer data and business decisions. For sales managers, marketing leaders, operations teams, and executives, the problem is rarely a lack of data. It is a lack of clarity. Contacts, deals, activities, campaign touches, renewals, and revenue figures all sit inside the CRM, but without reporting, teams struggle to see what is working, where deals stall, which channels generate revenue, and where accountability breaks down. A well-built CRM report turns that mess into usable insight, so teams can forecast better, coach faster, and make decisions with confidence.
All reports in this article are built with FineReport.
What Is a CRM Report?
A crm report is a structured view of customer, sales, marketing, or service data pulled from a customer relationship management system and presented in a way people can analyze quickly. In simple terms, it takes records like leads, accounts, deals, and customer interactions and turns them into charts, summaries, tables, or trend views that support action.
For beginners, the easiest way to think about it is this:
A CRM stores the data.
A CRM report organizes the data.
The report helps teams decide what to do next.
If your sales team wants to know why win rates are dropping, or your marketing team wants to know which campaigns generate qualified leads, the CRM report is the tool that answers those questions.
A CRM report can be very simple, such as a list of open deals closing this month, or much more advanced, such as a weighted revenue forecast by segment, region, and account owner.
CRM report vs dashboard vs CRM reporting workflow
These terms are often used together, but they are not the same.
Term
What it means
Best use case
CRM report
A focused analysis of specific data, often filtered by time period, owner, team, or stage
The broader process of collecting, cleaning, analyzing, sharing, and reviewing CRM data
Ongoing performance management and decision-making
A report is usually where detailed analysis happens. A dashboard is where fast monitoring happens. The workflow is how your organization uses both consistently.
Why CRM reporting matters across teams
CRM reporting is not just for sales. Its value spreads across the entire revenue operation.
Sales teams use reports to track pipeline health, rep activity, deal progress, and forecast accuracy.
Marketing teams use CRM reporting to compare lead sources, campaign performance, and conversion quality.
Customer success teams use reports to monitor renewals, churn risk, onboarding progress, and expansion opportunities.
Leadership teams use dashboards and reports to evaluate growth, spot execution gaps, and steer planning.
Without reliable CRM reporting, meetings become opinion-based. With it, teams can focus on facts.
How a CRM Report Works for Beginners
At a beginner level, every crm report follows the same basic logic: collect data, organize it, filter it, visualize it, then interpret the result.
The basic flow of CRM reporting
1. Data collection
Your CRM gathers data from everyday business activity, including sales outreach, customer updates, marketing responses, and service interactions.
Common records include:
Contacts
Accounts or companies
Leads
Opportunities or deals
Tasks and follow-ups
Calls and emails
Meetings
Campaign responses
Renewal and subscription records
2. Data organization
The system stores information in fields and objects. This is where standardization matters. For example:
Deal stage
Lead source
Industry
Revenue amount
Close date
Account owner
If these fields are inconsistent, the report quality drops immediately.
3. Filtering and grouping
This is where a report becomes useful. Users can filter data by:
Date range
Sales rep
Region
Product line
Deal stage
Campaign
Customer segment
Then they group that data to answer a business question, such as "Which lead sources produced the highest win rate last quarter?"
Pie or donut charts: Show distribution by source, segment, or status
Tables: List urgent records, such as overdue follow-ups or deals closing soon
Gauges: Track progress toward target or quota attainment
A simple example of using both together
Imagine a B2B sales team.
The dashboard shows pipeline coverage, deals closing this month, rep activity, and team quota attainment.
The report explains why one region is underperforming by breaking down stage conversion, average sales cycle, and lead source quality.
The dashboard surfaces the issue. The report diagnoses it.
For organizations that want more flexible and enterprise-ready reporting, FineReport is a strong fit because it supports pixel-perfect reports, real-time dashboards, multi-source data integration, and role-based access that helps different teams work from the same reporting framework without losing detail.
A strong CRM reporting setup does not start with dozens of charts. It starts with a small set of business-critical reports tied to revenue, efficiency, and retention.
Key Metrics (KPIs)
Below are the core KPI categories every beginner should understand.
Pipeline value: Total value of open deals in the pipeline.
Deal stage movement: How opportunities advance or stall across the funnel.
Win rate: Percentage of deals closed successfully.
Average deal size: Average revenue per won deal.
Sales cycle length: Average time from lead creation to closed-won.
Activity volume: Number of calls, emails, meetings, or tasks completed.
Follow-up rate: How consistently reps act on open leads and opportunities.
Lead conversion rate: Percentage of leads becoming qualified opportunities or customers.
Campaign performance: Results generated by each marketing initiative.
Renewal rate: Percentage of customers who renew.
Churn rate: Percentage of customers or recurring revenue lost.
Upsell rate: Revenue growth from existing accounts.
Customer lifetime value: Total expected revenue from a customer over time.
Recurring revenue trend: Growth or decline in subscription-based revenue.
Sales pipeline and deal reports
These reports help revenue teams understand whether they have enough pipeline and whether it is healthy.
Metrics to track
Pipeline value: Measures total open opportunity value.
Deal stage distribution: Shows how deals are spread across the pipeline.
Stage conversion rate: Measures how efficiently deals move forward.
Win rate: Indicates sales effectiveness.
Average deal size: Helps estimate revenue quality.
Sales cycle length: Reveals process speed and friction points.
What this report tells you in practice:
If top-of-funnel volume is weak, future quarters may miss target.
If proposal-stage deals are piling up, pricing or approval may be the issue.
If sales cycle length is increasing, the process may be getting more complex or less disciplined.
Activity and productivity reports
These reports focus on execution, not just outcomes.
Metrics to track
Calls made: Measures outreach intensity.
Emails sent: Shows engagement volume.
Meetings booked and held: Indicates sales momentum.
Rep-level follow-up activity: Highlights responsiveness and consistency.
These reports are especially useful for frontline managers because they connect behavior to pipeline movement. A rep with low conversions may not need more leads. They may need better follow-up habits.
Marketing and lead management reports
Marketing teams need to know not just how many leads they generate, but which leads become pipeline and revenue.
Metrics to track
Lead source: Identifies where leads originate.
Lead-to-opportunity conversion rate: Measures lead quality.
Campaign performance: Tracks response, engagement, and influenced pipeline.
Customer lifetime value: Helps prioritize accounts and segments.
Recurring revenue trend: Tracks stability and growth in subscription or repeat revenue models.
Retention reports are especially important for SaaS, subscription services, and account-based businesses where existing customers generate a major share of profit.
How to Build Better CRM Report Writing Habits
Most reporting problems are not technical. They are planning problems. Teams build reports before defining the business question, or they track too many metrics without deciding what matters.
1. Start with a clear business question
Before building any crm report, ask:
What decision will this report support?
Who will use it?
What action should follow if the metric changes?
Good examples:
Which stage is causing our forecast gap?
Which lead source produces the highest close rate?
Which customer segment is most at risk of churn?
Weak example:
Show me everything in the CRM.
2. Keep data clean and standardize key fields
Reporting quality depends on data quality. This is where many teams fail.
Set standards for:
Stage definitions
Lead source naming
Owner assignment
Deal amount formatting
Close date rules
Customer segment labels
If one rep uses "Inbound" and another uses "Website Lead," your lead source report becomes unreliable.
3. Choose a small set of metrics tied to team goals
Do not overload dashboards with vanity metrics. Pick a manageable KPI set that reflects the real objectives of the team.
Customer success team: renewals, churn, expansion, account health
4. Review reports on a fixed cadence
A report only matters if it is used regularly.
Recommended cadences:
Daily: dashboard checks for urgent pipeline or activity issues
Weekly: manager reviews of performance and bottlenecks
Monthly: cross-functional reviews of trends and execution
Quarterly: strategic reporting for planning and forecasting
5. Avoid common reporting mistakes
Here are the most frequent issues I see in CRM reporting programs:
Tracking too many metrics with no clear owner
Using incomplete or outdated CRM records
Confusing activity volume with performance quality
Building dashboards that do not match team workflows
Failing to align report definitions across departments
Actionable Best Practices to Implement CRM Reporting Well
If you are setting up CRM reporting from scratch, these are the practical steps that deliver the fastest business value.
Best Practice 1: Build one executive dashboard and three team-level reports
Start lean.
Create one dashboard for leadership with pipeline, forecast, lead conversion, and retention metrics.
Create one sales report focused on stage movement and rep activity.
Create one marketing report focused on lead source and campaign conversion.
Create one customer report focused on renewals, churn, and expansion.
This gives every major stakeholder a relevant view without creating report chaos.
Best Practice 2: Standardize your CRM fields before scaling reports
Do this before you automate anything.
Audit critical fields like stage, source, owner, revenue, and close date.
Remove duplicate values and naming inconsistencies.
Document definitions for every KPI.
Lock down required fields where possible.
If the data model is inconsistent, your reports will never earn trust.
Best Practice 3: Match every KPI to an owner and action
Metrics without ownership create passive dashboards.
Assign each KPI to a team or manager.
Define what action should happen when the metric misses target.
Review exceptions in recurring meetings.
Track whether action was taken.
This is how reporting becomes operational, not decorative.
Best Practice 4: Automate delivery, but not interpretation
Automation saves time, but it does not replace judgment.
Schedule recurring reports to relevant stakeholders.
Set alerts for threshold breaches like low pipeline coverage or overdue renewals.
Use dashboards for daily visibility.
Reserve weekly or monthly meetings for interpretation and decisions.
Best Practice 5: Use a reporting platform that can scale beyond default CRM views
As reporting matures, many teams outgrow basic native CRM charts. They need richer visuals, cross-system integration, print-ready reports, and more control over access and formatting. This is where FineReport can add serious value, especially for organizations that want to unify CRM data with ERP, finance, service, or operations data in one reporting layer.
Examples of CRM Report in Action
The easiest way to understand a crm report is to see how different teams use it in real business scenarios.
Sales manager: spotting pipeline bottlenecks and coaching reps
A sales manager reviews a weekly pipeline report and sees that many opportunities are entering the proposal stage, but very few are moving to negotiation.
The report shows:
High proposal count
Longer-than-normal stage duration
Low follow-up activity after proposal delivery
Lower conversion for one rep group
From that, the manager can act quickly:
Coach reps on proposal follow-up timing
Review pricing objections
Adjust proposal templates
Escalate support for slow-moving enterprise deals
This is the real value of reporting: it turns a vague feeling into a specific intervention.
Marketing team: comparing lead sources and campaign ROI
A marketing team wants to understand whether paid search, webinars, or partner referrals produce the best pipeline.
Their CRM reporting setup compares:
Lead volume by source
Qualification rate
Opportunity creation
Closed-won revenue
Average deal size by source
They discover that paid search drives more leads, but webinars produce larger deals and better close rates. That insight changes budget allocation for the next quarter.
Leadership team: forecasting and performance reviews
Leadership needs a reliable view of growth, risk, and execution. They use dashboards for the headline numbers and reports for deeper review.
A typical executive setup includes:
Pipeline coverage ratio
Forecast by quarter
Conversion trend
Revenue by segment
Churn and renewal outlook
Performance by team or region
This supports:
Board reporting
Budget planning
Hiring decisions
Territory design
Quarterly business reviews
With a tool like FineReport, these executive reporting packs can be built as interactive dashboards for live monitoring and as formatted management reports for formal review, which is particularly useful in larger organizations with multiple stakeholders.
Final Thoughts: Why Every Team Needs a Better CRM Report
A crm report is not just a chart or spreadsheet export. It is a decision tool. For beginners, the main goal is simple: use CRM reporting to turn scattered customer and sales data into clear answers. Start with the business question, clean the data, focus on a small set of essential metrics, and build reports that drive action.
If you do that well, CRM reporting improves more than visibility. It improves forecasting, accountability, team alignment, and growth planning.
If your current CRM reports feel too limited, too manual, or too hard to scale across teams, it may be time to build a more flexible reporting layer with dashboards and reports designed for real business operations.
Get Ready-to-Use Dashboard Templates in Fine Gallery
A CRM report turns raw customer and sales data into a clear view that teams can analyze and act on. Its main purpose is to help people make better decisions about pipeline, performance, marketing, and customer relationships.
A CRM report is usually focused on a specific question, time period, or dataset for deeper analysis. A dashboard brings multiple key metrics together in one visual summary for quick monitoring.
Beginners should usually start with pipeline value, conversion rate, win rate, sales activity, and forecasted revenue. These metrics give a simple picture of deal progress, team effort, and expected results.
Inaccurate CRM reports often come from poor data quality, such as missing fields, duplicate records, or inconsistent naming. If the CRM data is not clean and standardized, the report will not reflect reality.
Most teams should review key CRM dashboards daily or weekly and use detailed reports in weekly, monthly, or quarterly reviews. The right schedule depends on how fast your pipeline, campaigns, and customer activity change.
Product Trial
FineReport
Pixel-perfect reports · Interactive dashboards · Easy data entry · Digital twins