A project management report is the operating document that tells stakeholders whether a project is on track, where it is slipping, what decisions are needed, and what happens next. For project managers, PMO leaders, operations directors, and delivery teams, the value is simple: better reporting reduces surprises, speeds up decisions, and keeps scope, budget, and timelines under control. If your current updates feel scattered across spreadsheets, slides, emails, and meetings, a well-structured project management report turns fragmented project data into a decision-ready view.
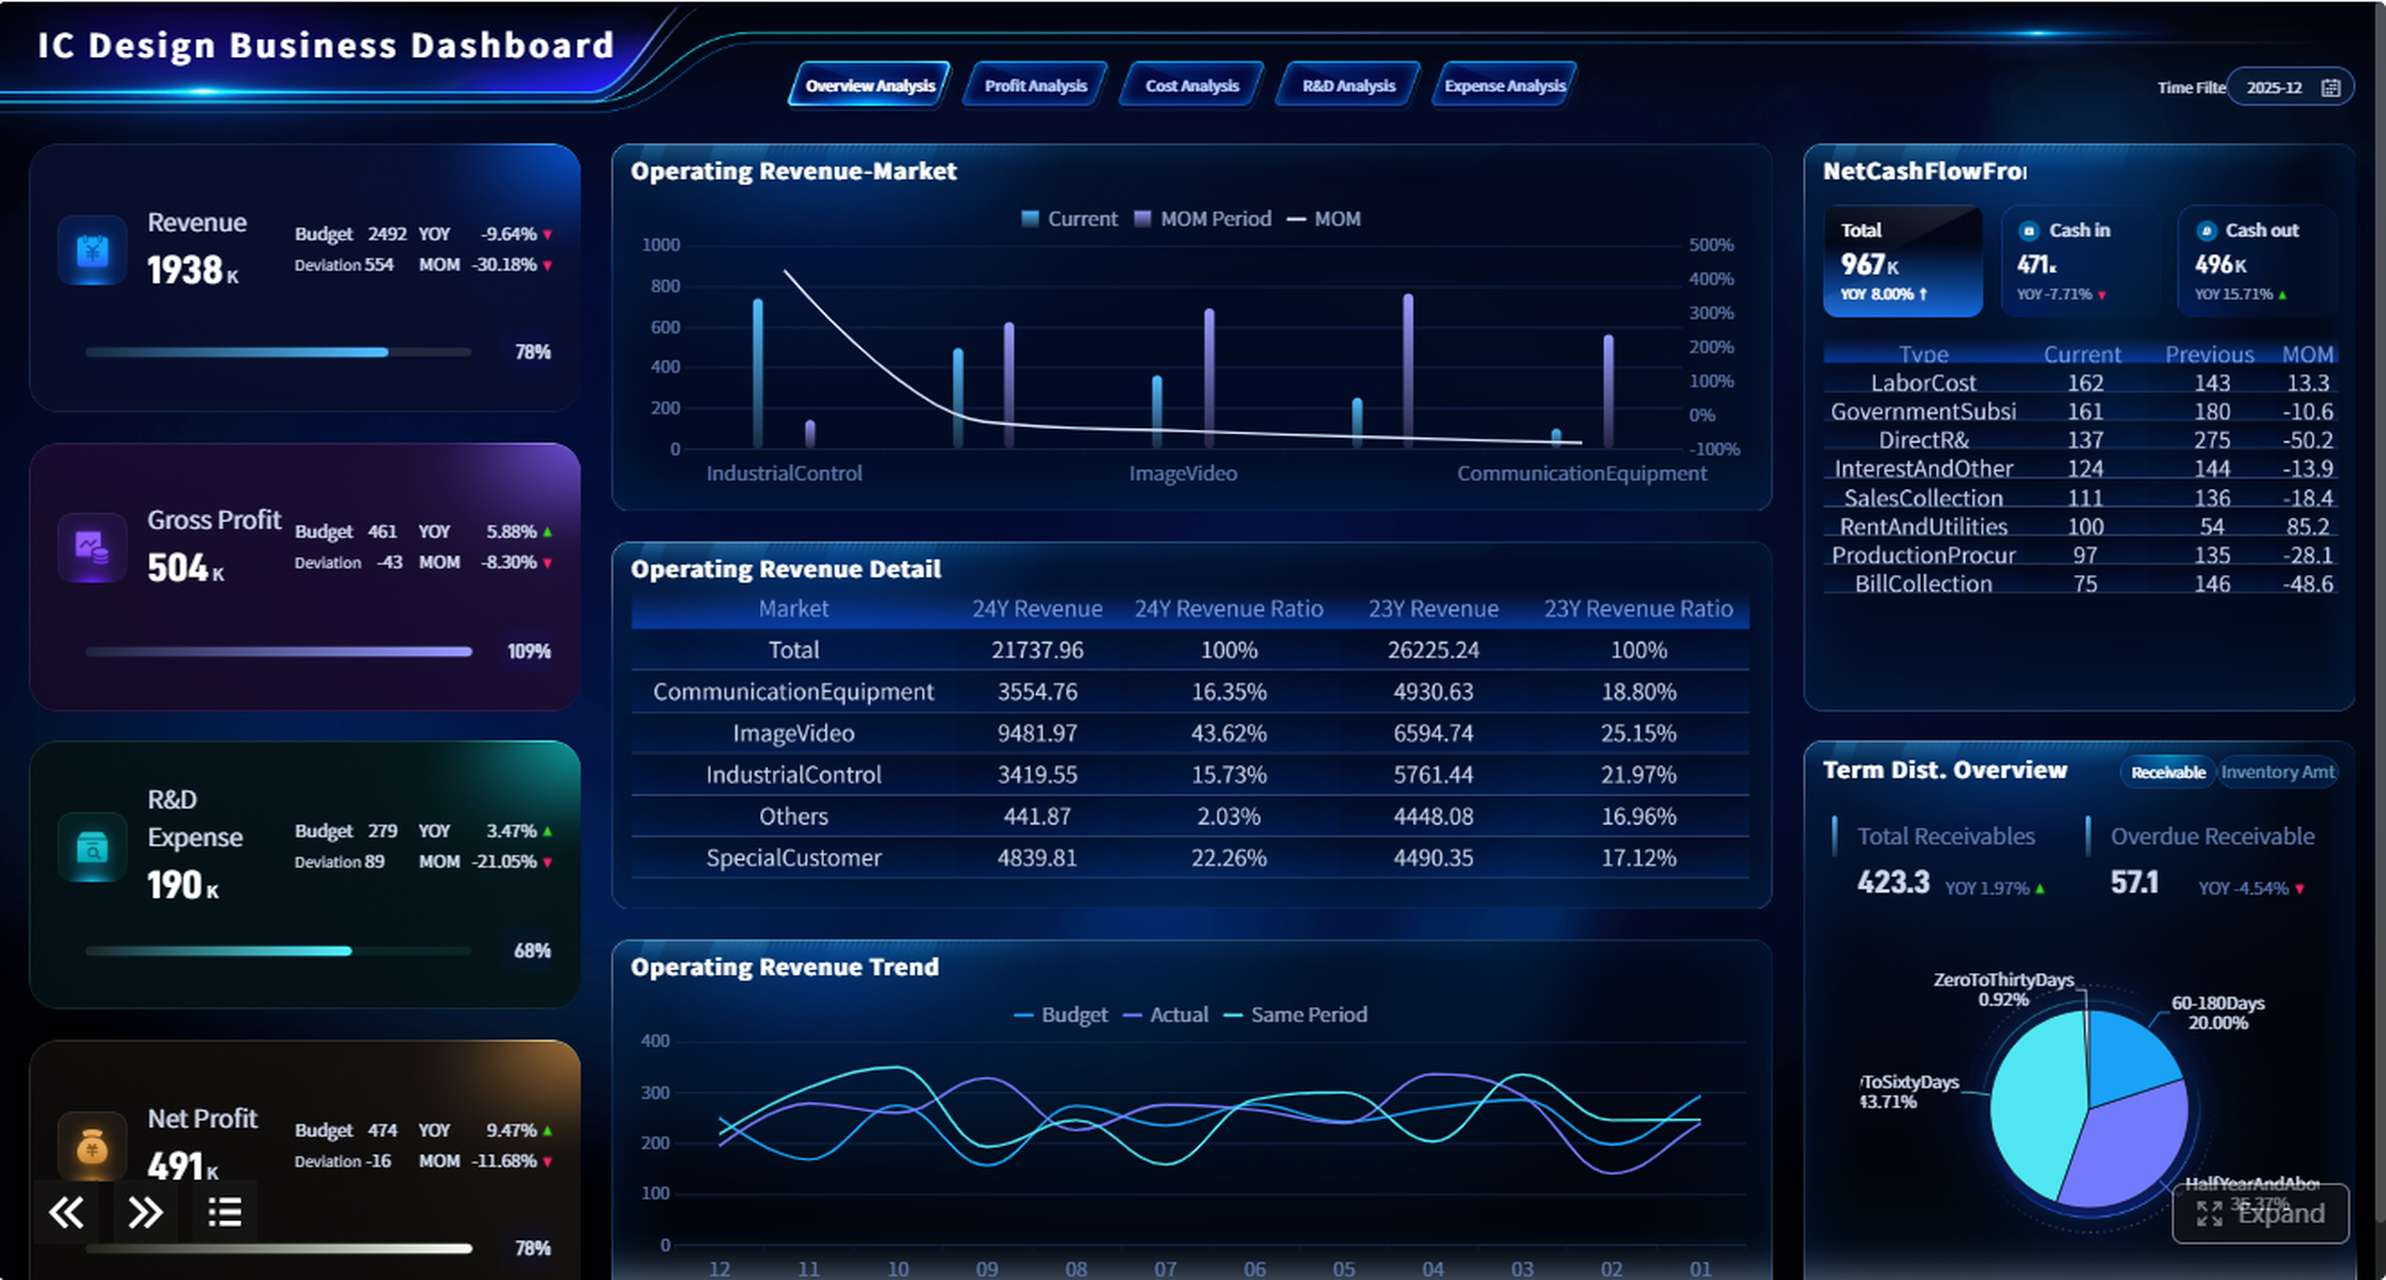
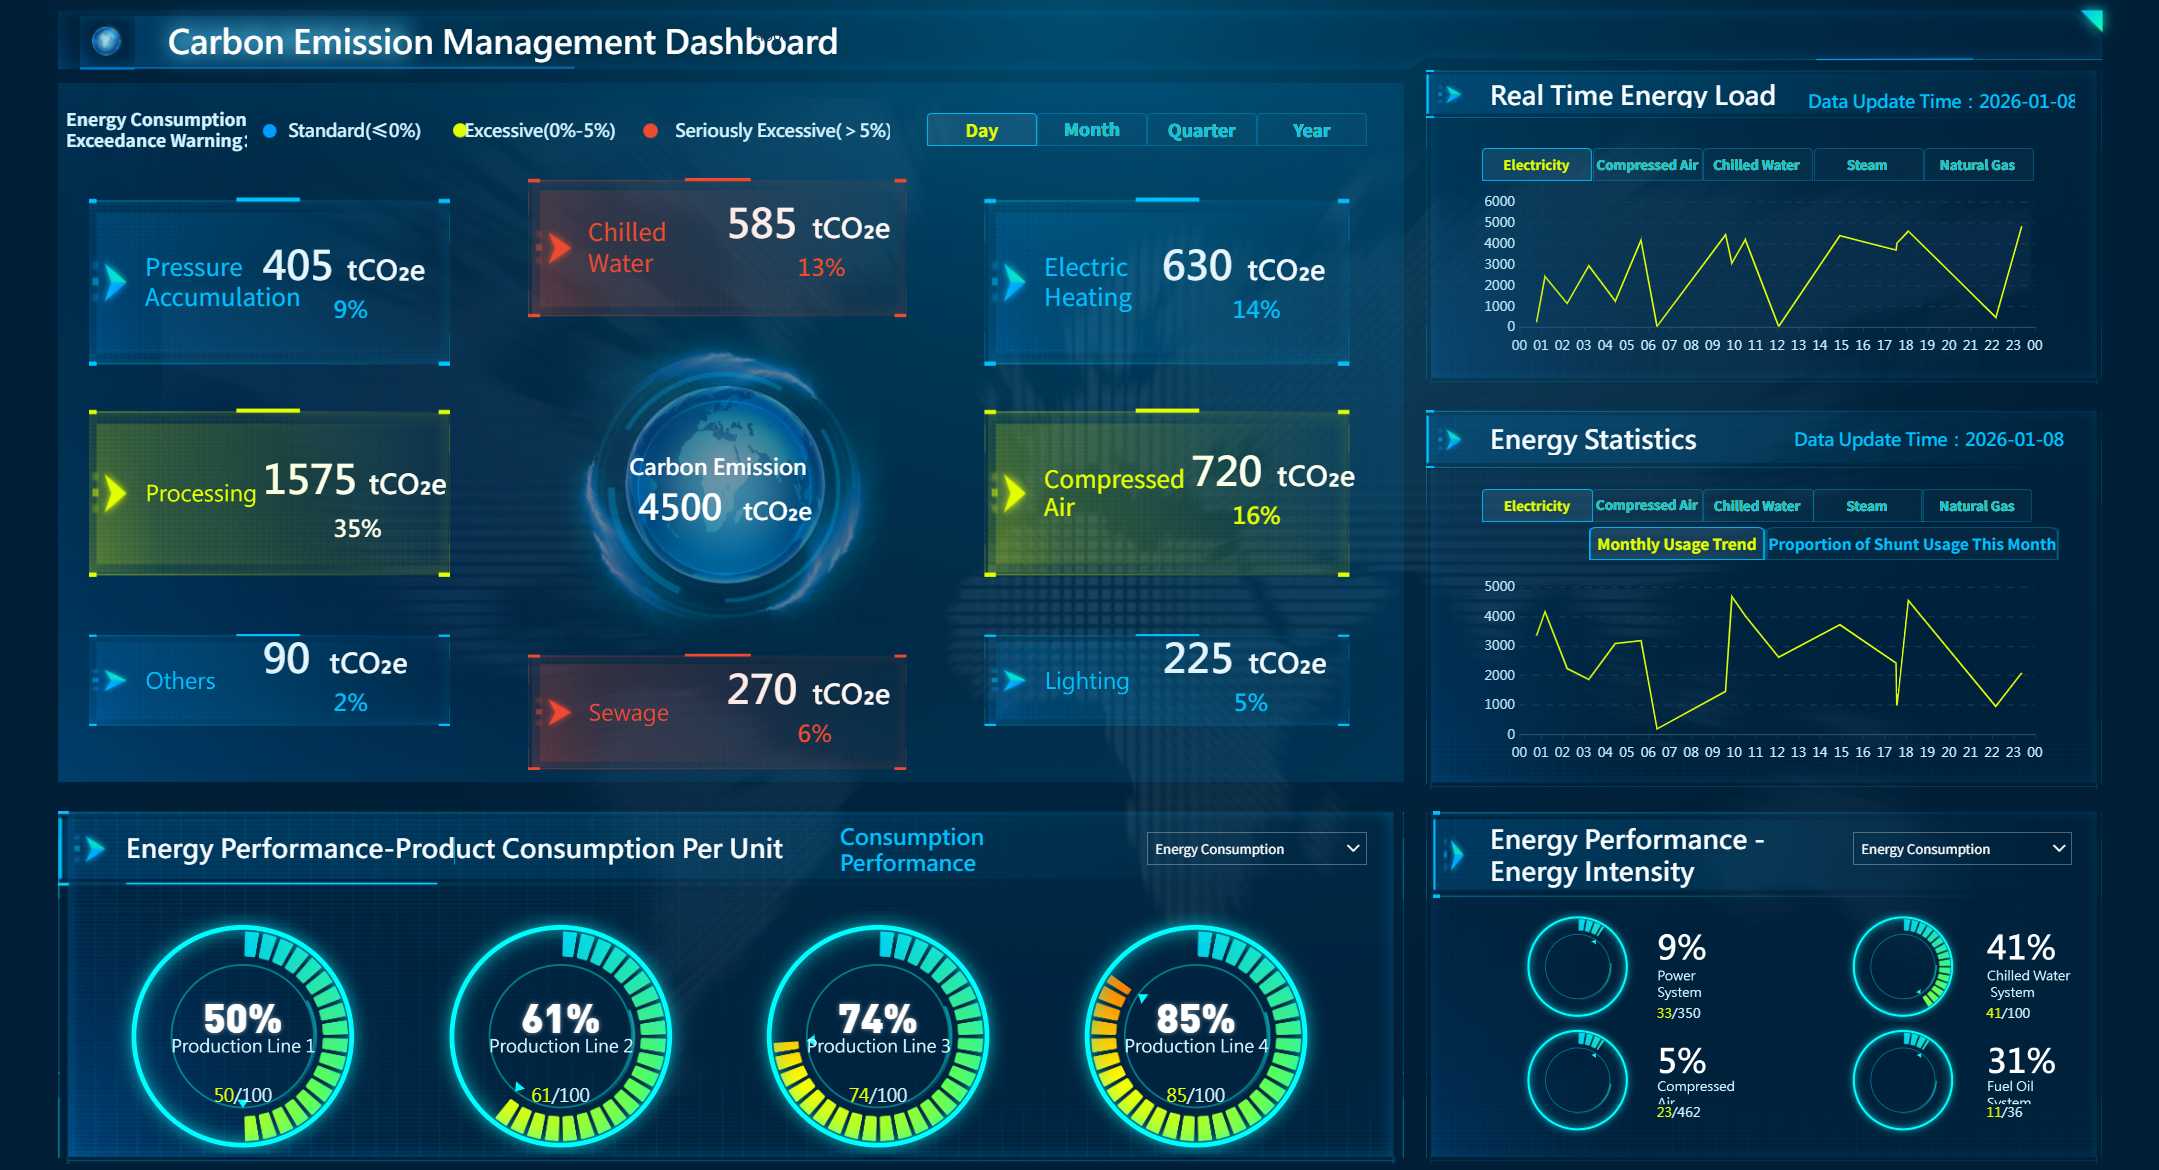
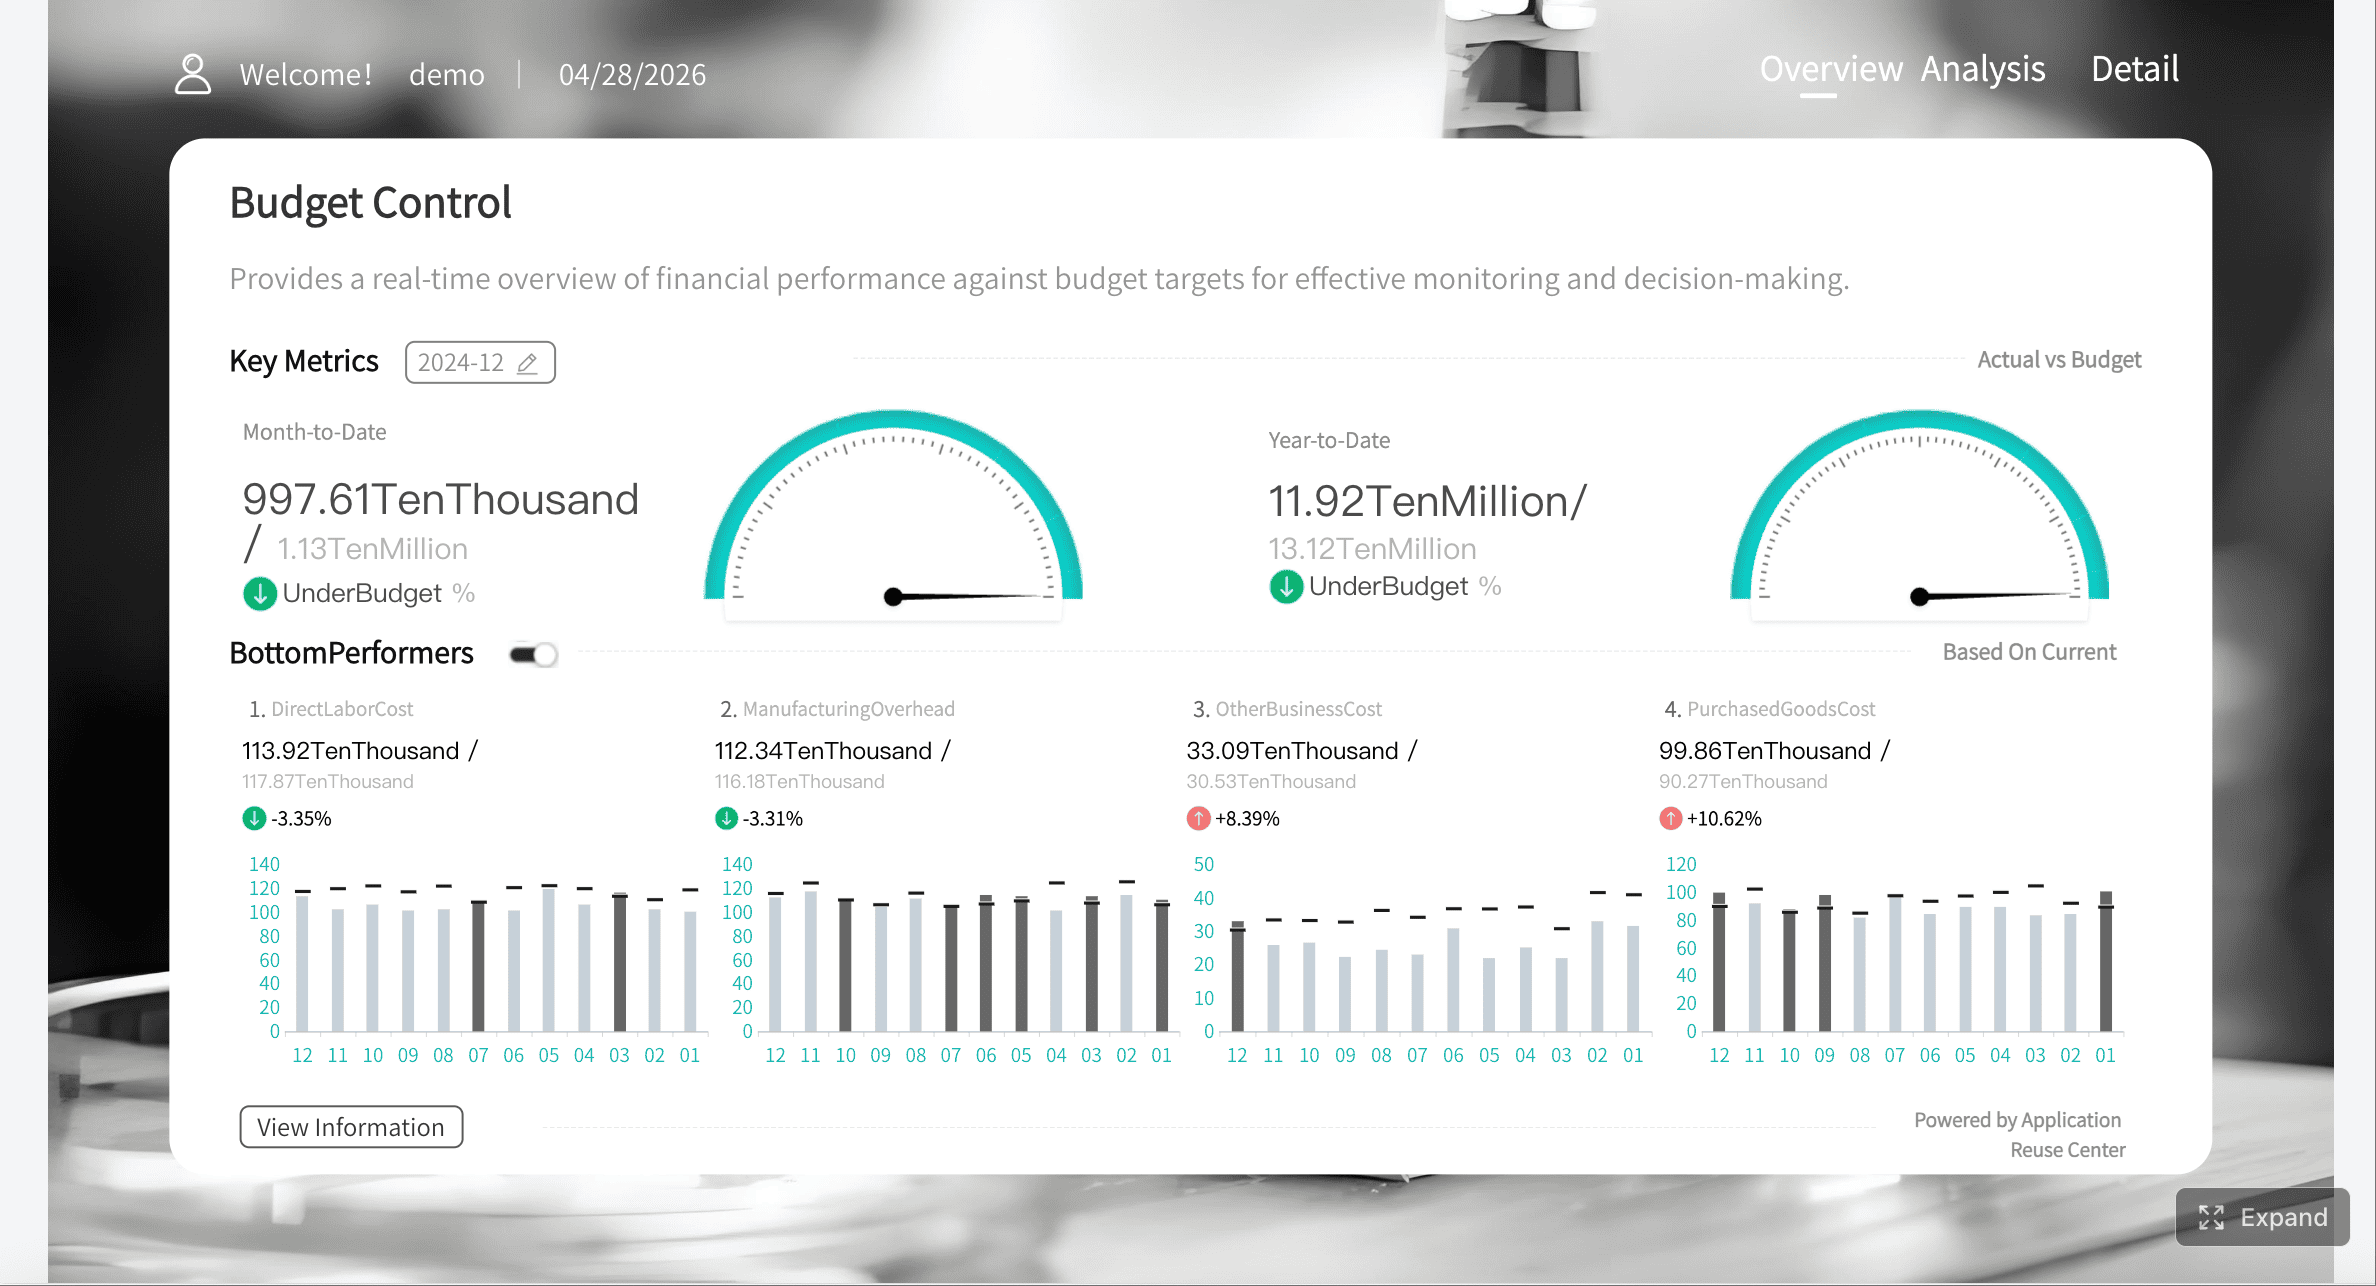
All reports in this article are built with FineReport.
What a project management report is and why it matters
A project management report is a structured summary of project performance, progress, risks, costs, resources, and next actions. It is used by project managers to communicate current status and by executives, sponsors, clients, and team leads to make decisions quickly.
At its best, the report answers five business-critical questions:
Are we on track?
What changed since the last update?
What is at risk?
Do we need intervention or approval?
What should stakeholders focus on next?
This matters because most project failures are not caused by a lack of activity. They are caused by poor visibility, slow escalation, unclear accountability, and inconsistent communication. A strong project management report fixes those gaps.
Who uses a project management report
Different stakeholders use the same report for different reasons:
Project managers: to track delivery health and escalate blockers
Executives and sponsors: to assess strategic impact and approve decisions
Clients: to review progress, scope, timing, and commercial exposure
PMO teams: to standardize reporting across multiple projects
Functional leads: to understand resource needs and dependencies
When to use one for updates, decisions, and stakeholder communication
A project management report is most useful when there is a regular reporting cadence and a clear decision-making rhythm. Common use cases include:
Weekly or biweekly project status updates
Monthly steering committee reviews
Stage-gate approvals
Client progress reviews
Risk escalation meetings
Budget and resource planning discussions
If a stakeholder should not have to dig through task tools or attend every team meeting to understand project health, they need the report.
How reports differ from dashboards, meeting notes, and project plans
These formats are related, but they serve different purposes:
Project management report: a narrative plus metrics summary designed to communicate status and trigger action
Dashboard: a live visual monitoring tool for ongoing performance tracking
Meeting notes: a record of discussion, decisions, and follow-ups
Project plan: the detailed roadmap for scope, tasks, owners, dependencies, and schedule
A dashboard shows what is happening now. A report explains what it means. A project plan shows what should happen. Meeting notes document what people said about it.
Core sections every project management report should include
Every effective project management report follows a predictable structure. That consistency helps stakeholders scan quickly, compare periods, and focus on exceptions.
Executive summary
The executive summary is the first section decision-makers read. It should be short, sharp, and outcome-focused.
Include:
Overall project status
Key achievements since the last report
Major risks or issues
Decisions required
Any change in forecast for timeline, budget, or scope
A practical format is a one-paragraph summary followed by a few bullets. For example:
Status: Amber
Win: Vendor integration completed on schedule
Risk: UAT start may slip by one week due to data migration defects
Decision needed: Approve additional testing support
This section should never become a task list. It is a leadership summary, not a work log.
Progress and milestone update
This section shows what has been completed, what is in progress, and whether major milestones are holding.
Cover:
Completed deliverables
Upcoming deliverables
Milestones due this reporting period
Milestones delayed or at risk
Current schedule position versus baseline
Good reporting focuses on movement, not noise. Stakeholders care less about every individual task and more about whether critical deliverables are progressing as planned.
Budget, resources, and scope
This section connects delivery performance to commercial and operational reality. A project may appear to be progressing well while quietly drifting over budget or stretching team capacity.
Include:
Planned budget versus actual spend
Forecast at completion
Resource utilization or workload
Key staffing gaps
Scope changes and approved change requests
Impact of scope changes on timeline and cost
This is also where you should flag scope creep early. If scope expands without corresponding time, budget, or resource adjustments, the report should make that visible.
Risks, issues, and next steps
This is the control center of the report. It shows what is blocking progress and what leadership attention is needed.
Include:
Top risks and severity
Active issues and current status
Mitigation actions
Owners for each item
Immediate next steps for the coming period
A useful rule: every major risk or issue should have an owner, due date, and mitigation action. If not, it is not being managed properly.
KPIs and metrics to track in a project management report
A project management report is only as good as the metrics inside it. Too few metrics create blind spots. Too many metrics create confusion. The goal is to use a focused KPI set that reflects delivery health and supports decisions.
Key Metrics (KPIs)
Schedule Variance (SV): Measures whether the project is ahead of or behind the planned schedule.
Budget Variance (BV): Compares actual spending against the approved budget.
Milestone Completion Rate: Shows the percentage of planned milestones completed on time.
Task Progress: Tracks completed, in-progress, and overdue tasks.
Resource Utilization: Measures how effectively team capacity is being used.
Risk Exposure: Assesses total project risk based on probability and impact.
Issue Aging: Tracks how long open issues remain unresolved.
Change Requests: Counts requested, approved, pending, and rejected scope changes.
Forecast Completion Date: Estimates the likely delivery date based on current performance.
Forecast at Completion (FAC): Predicts the final total project cost.
Defect or Quality Trend: Useful for technical projects to show whether quality is improving or declining.
Decision Turnaround Time: Measures how quickly key stakeholder approvals are made.
How to choose metrics based on project size, phase, and audience
Not every KPI belongs in every report. The right set depends on context.
For small projects
Keep it simple:
Overall status
Milestone completion
Budget variance
Open risks
Next steps
For enterprise or complex projects
Use a broader control set:
Schedule variance
Forecast completion date
Budget variance
Forecast at completion
Resource utilization
Risk exposure
Issue aging
Change request volume
For early project phases
Prioritize:
Scope readiness
Resource mobilization
Approval status
Key dependencies
Risk exposure
For execution phases
Prioritize:
Task and milestone progress
Schedule variance
Budget variance
Resource utilization
Issue aging
For executive audiences
Show:
Overall health
Variance exceptions
Business impact
Decisions required
Forecast changes
For delivery teams
Show:
Detailed task progress
Dependencies
Owners
Blockers
Near-term deadlines
Common reporting mistakes to avoid
Many project management reports fail because the metrics are technically correct but operationally useless.
Avoid these mistakes:
Too many metrics: If everything is important, nothing stands out.
No definitions: Terms like “on track” or “high risk” need clear criteria.
Lagging indicators only: Include forward-looking metrics such as forecast date and risk trend.
No action linkage: A KPI should point to a decision or next step.
Inconsistent calculation methods: Variance and completion metrics must be standardized across reporting cycles.
How to write a clear project management report that stakeholders will actually read
A report is only effective if people can absorb it fast and act on it. That requires structure, brevity, and relevance.
Use a simple format and reporting cadence
Use the same format every week, biweekly period, or month. Consistency allows stakeholders to compare status over time and quickly find what matters.
Consistency also improves governance. PMOs and enterprise delivery teams benefit when every project follows the same reporting standard.
Focus on decisions, not just activity
One of the most common reporting mistakes is listing work completed without explaining why it matters.
Instead of writing:
“Completed testing for module A”
“Held vendor workshop”
“Updated requirements log”
Write:
“Module A testing completed, reducing release risk for the planned deployment window”
“Vendor workshop confirmed interface design, removing a dependency on phase-two build”
“Requirements update added two change requests awaiting sponsor approval”
The difference is simple: activities describe effort; decision-oriented reporting describes impact.
Tailor detail for different audiences
A single project may need different views of the same truth.
Executives: want top-line status, business impact, and decisions needed
Clients: want confidence on delivery, changes, risks, and contractual impacts
Delivery teams: want specifics, blockers, owners, and deadlines
PMO leaders: want consistency, cross-project comparison, and trend visibility
The smartest reporting setups use one trusted data model but present different report views by role.
Follow practical writing best practices
As a consultant, I recommend four writing rules:
Lead with exceptions. Put delays, decisions, and risks at the top.
Keep summary text concise. Use short paragraphs and bullets.
Use plain language. Avoid internal jargon where possible.
Make action items obvious. Every stakeholder should know what requires attention.
A good project management report should be skimmable in under three minutes by an executive and usable in detail by the project team.
Project management report examples and common report types
Different situations call for different report styles. Below are the most useful formats for operational and executive reporting.
Example: Weekly project status report
A weekly project status report is the most common format. It provides a concise snapshot of current health and immediate priorities.
Sample structure:
Section
Example
Overall Status
Amber
Timeline
One integration task delayed by 4 days; no critical milestone missed yet
Budget
52% of budget used; forecast remains within 3% of plan
Progress
18 of 24 tasks complete; testing phase begins next Monday
Risks
Data migration quality may delay UAT
Decisions Needed
Approve temporary QA support
Next Actions
Close defect backlog, finalize user training plan
This report works best for project managers, sponsors, and delivery leads who need regular operational visibility.
Example: Executive summary report
An executive summary report is a compressed version for senior stakeholders who need clarity, not operational detail.
Sample structure:
Overall Status: Amber
Business Impact: Launch date remains achievable but with reduced buffer
Top Concern: Data quality issues could extend testing
Financial Position: Slightly above spend plan due to contractor onboarding
Decision Required: Approve contingency budget for two-week support extension
This format should fit on one page or one screen. Its job is to accelerate decisions.
Other essential project reports to know
Beyond the core project management report, enterprise teams often use specialized reports for deeper control:
Risk report: prioritizes top risks, exposure, owners, and mitigation
Budget report: shows spend, committed cost, forecast, and variance
Resource report: tracks team allocation, workload, and capacity gaps
Issue report: lists blockers, aging, escalation level, and owners
Change report: summarizes scope changes and approval status
Lessons learned report: captures post-project insights for future improvement
Together, these reports support stronger governance across the project lifecycle.
Free project management template and step-by-step reporting workflow
A reusable template reduces reporting time, improves consistency, and raises confidence in the numbers. Below is a practical structure you can copy into a document, spreadsheet, or reporting tool.
Use this workflow to complete the template efficiently and accurately.
1. Pull data from trusted systems
Gather information from:
Project schedule tools
Budget or ERP systems
Resource planning sheets
Risk and issue logs
Change request register
Do not build reports from memory or disconnected notes. Use the latest validated data.
2. Write the executive summary last
Although it appears first, write it after reviewing all sections. That ensures the summary reflects the real picture, not assumptions.
Ask yourself:
What changed?
What matters most?
What decision is needed?
What should stakeholders worry about right now?
3. Highlight exceptions, not every activity
Focus on material movement:
Milestones missed or recovered
Budget overrun or savings
New high-risk items
Scope changes
Resource constraints
If an update does not change risk, timing, cost, or stakeholder action, it may not belong in the summary.
4. Validate owners and dates
Every risk, issue, and next action should include:
Named owner
Clear due date
Current status
Expected outcome
That is what turns reporting into management.
5. Match detail to the audience
Before sending, ask whether the level of detail fits the audience. An executive steering group should not receive a task-level dump. A delivery team should not receive only high-level color codes.
Consistency: Does the report match prior definitions and format?
Clarity: Can a stakeholder understand the key message in under three minutes?
Relevance: Does the report focus on items that affect outcomes?
Accountability: Are all issues, risks, and actions assigned?
Actionability: Are decisions required clearly stated?
Audience fit: Is the language and depth right for the recipients?
Turn project reporting into a scalable decision system with FineReport
If your team is still manually assembling project updates from spreadsheets, slides, emails, and disconnected systems, reporting will stay slow, inconsistent, and reactive. The real opportunity is to turn the project management report into a live, governed reporting system that combines automation, standardization, and role-based visibility.
Build standardized project management report templates for weekly, monthly, and executive updates
Connect project, financial, and operational data from multiple systems
Automate KPI calculations such as schedule variance, budget variance, and milestone completion
Create dashboard-driven reports for PMs, sponsors, clients, and PMO leaders
Drill from executive summaries into detailed risk, budget, and resource views
Schedule and distribute reports automatically to stakeholders
This is especially valuable for enterprise environments where consistency, auditability, and reporting speed matter. Instead of producing reports manually each cycle, you can create a governed reporting framework that scales across portfolios.
Get Ready-to-Use Dashboard Templates in Fine Gallery
For organizations trying to improve delivery governance, stakeholder trust, and reporting efficiency, FineReport is not just a reporting tool. It is the platform that helps operationalize better project communication.
The strongest project management report is not the longest one. It is the one that helps the right people make the right decision at the right time. Build that system once, standardize it, and your projects become easier to manage at every level.
FAQs
A strong project management report usually covers an executive summary, progress against milestones, budget and resource status, scope changes, key risks or issues, and next steps. The goal is to give stakeholders a clear view of project health and any decisions needed.
A dashboard shows live metrics and performance data at a glance, while a project management report adds context, explanation, and recommended actions. In short, the dashboard shows what is happening and the report explains why it matters.
Common KPIs include schedule variance, budget variance, milestone completion, resource utilization, open risks, and scope change volume. The best KPIs depend on what stakeholders need to monitor and decide quickly.
Most teams create them weekly, biweekly, or monthly depending on project pace and stakeholder needs. Reports should follow a consistent cadence so changes, risks, and decisions are easy to track over time.
FineReport can help teams combine project data into dashboards and structured reports that are easier to share with stakeholders. This makes it easier to monitor status, highlight risks, and present decision-ready updates.
Product Trial
FineReport
Pixel-perfect reports · Interactive dashboards · Easy data entry · Digital twins