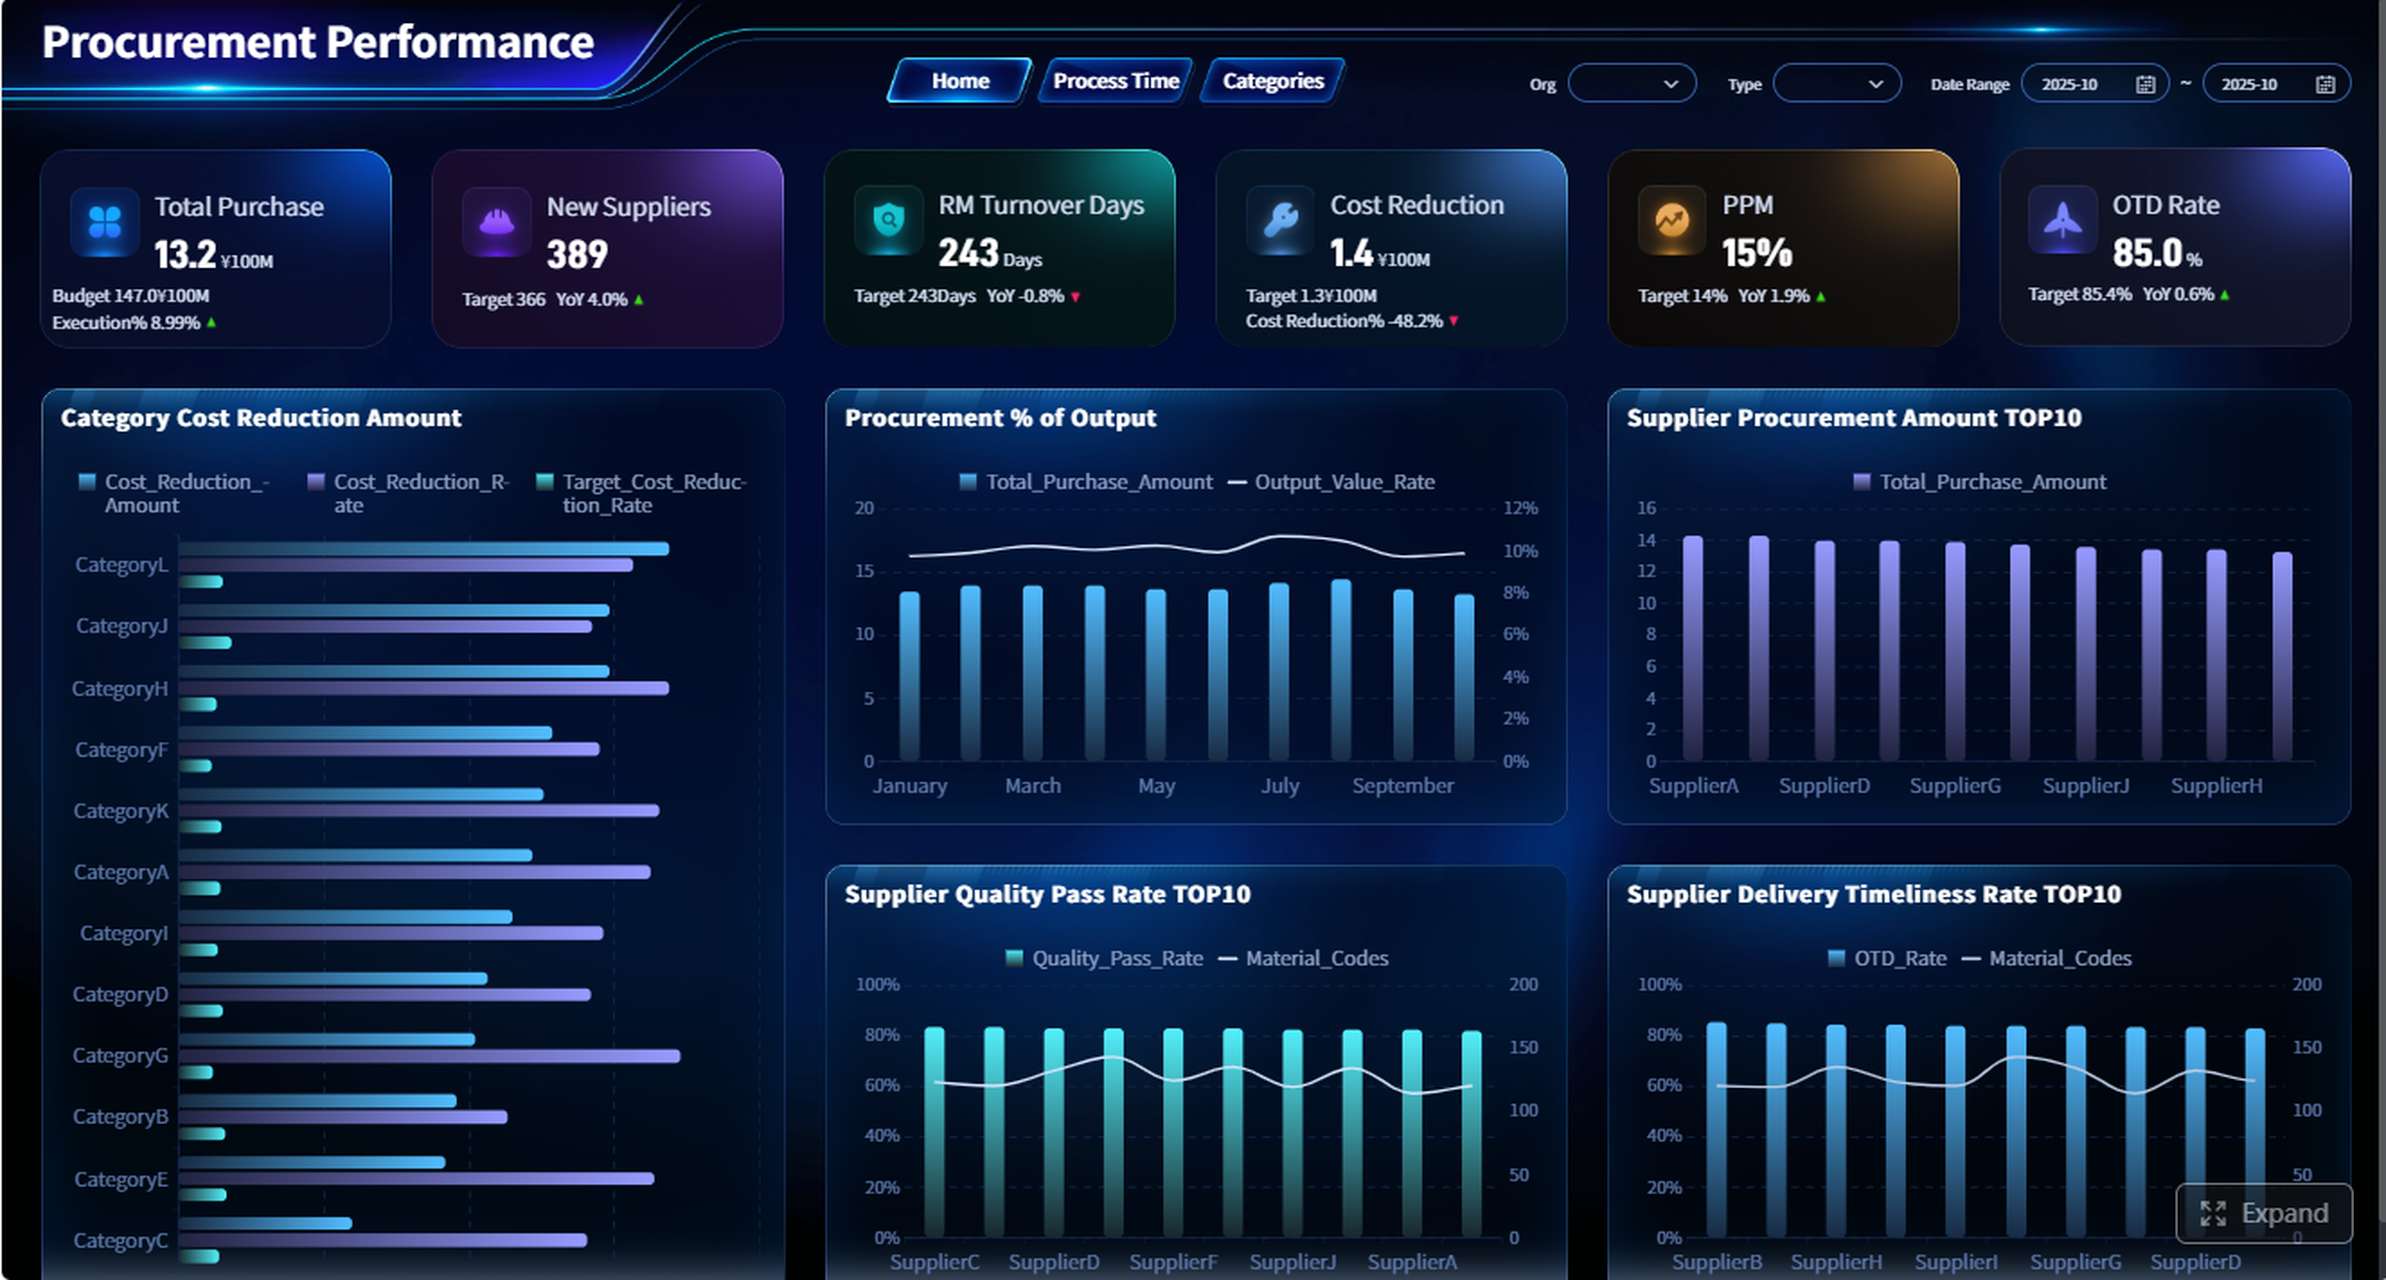
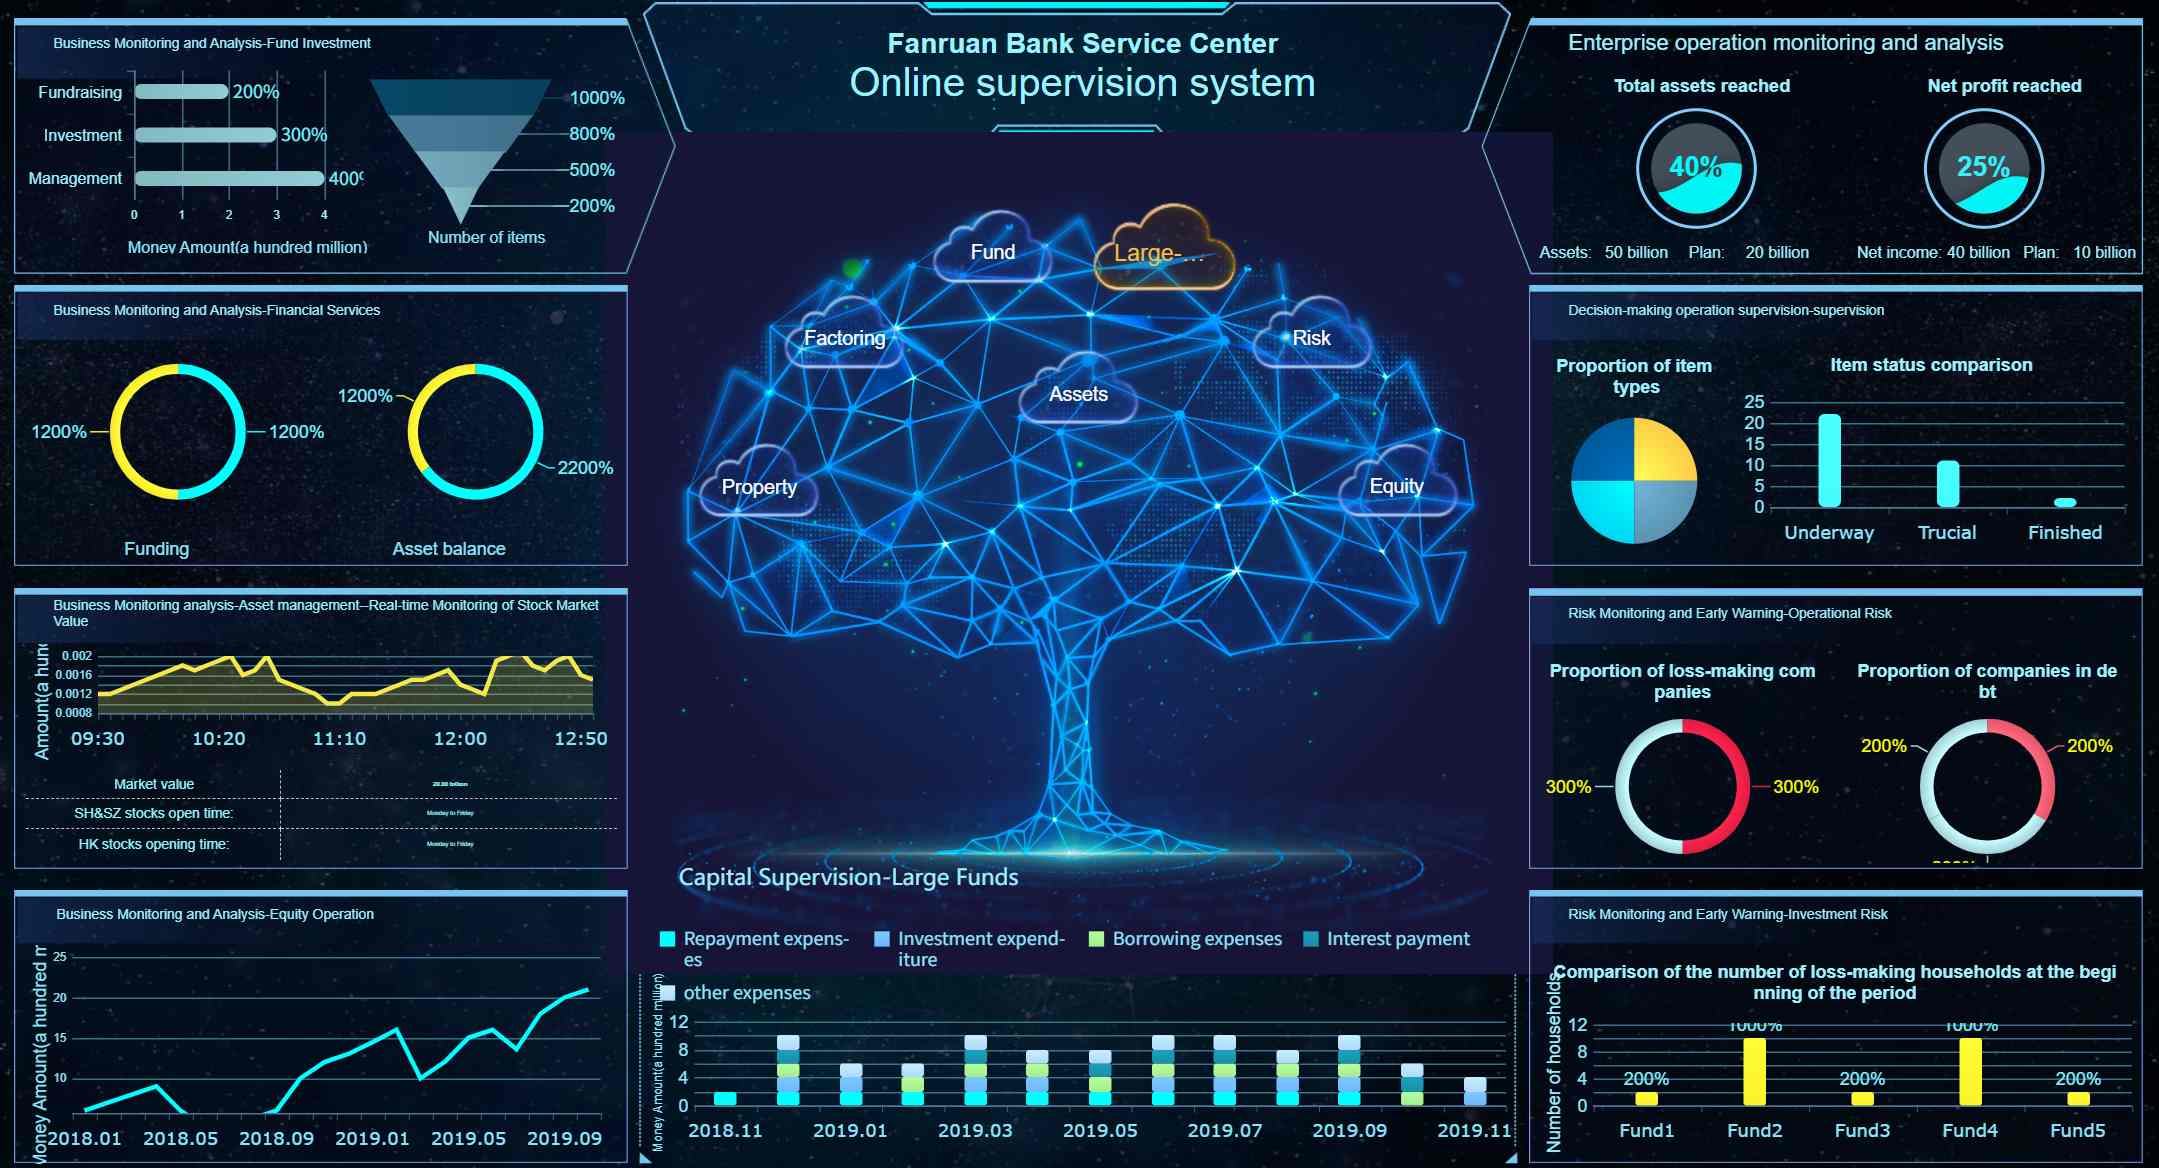
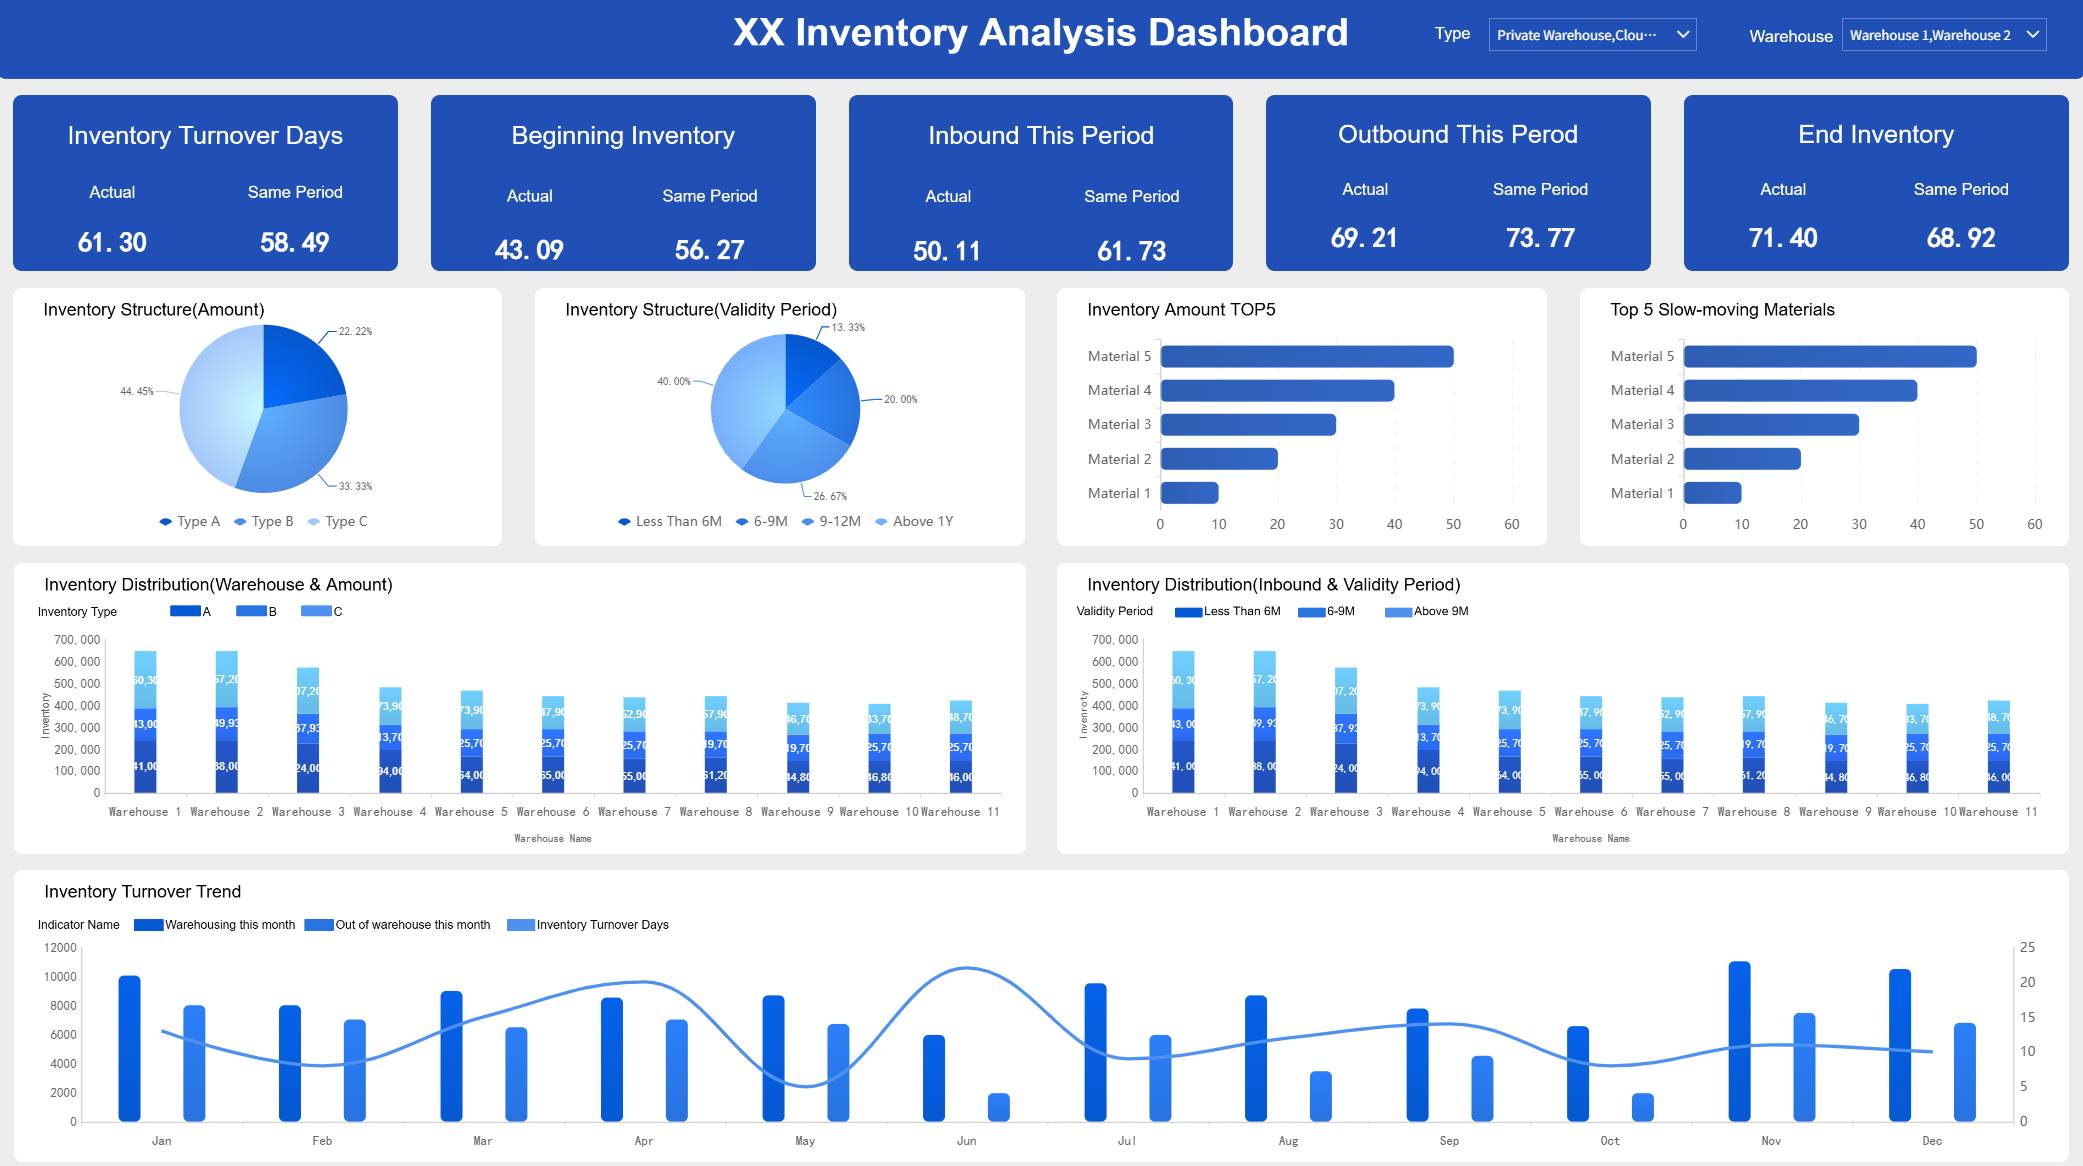
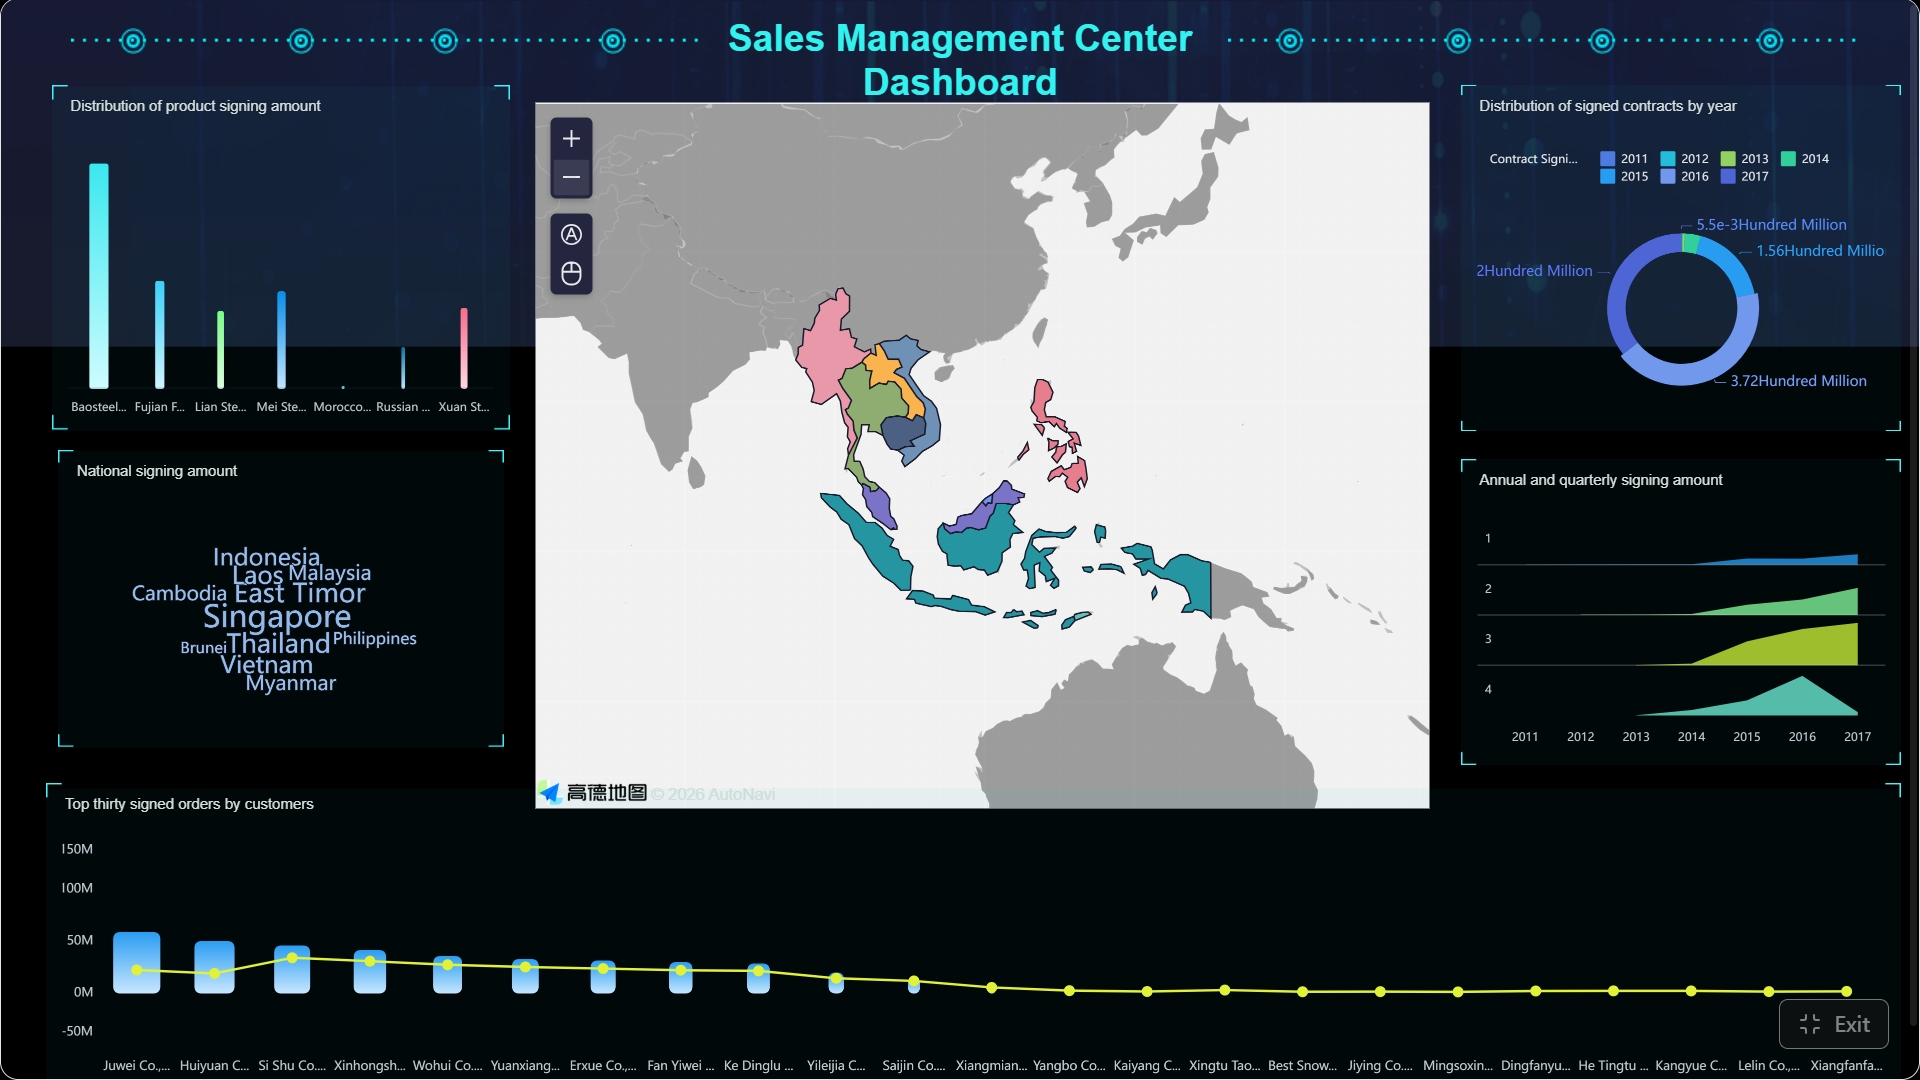
A management report is an internal business report designed to help leaders make faster, better decisions. Unlike raw data exports or routine status updates, it turns performance data into insight: what happened, why it happened, what it means, and what should happen next. For executives, finance leaders, operations directors, and department heads, a strong management report reduces guesswork, exposes risks early, and aligns teams around measurable priorities.
All reports in this article are built with FineReport.
What Is a Management Report and Why It Matters
A management report is a structured internal document that summarizes business performance over a defined period and supports managerial decision-making. It usually combines KPIs, financial highlights, operational insights, risks, and recommendations in one decision-ready format.
In simple terms, a management report answers four critical business questions:
Where are we now?
What changed?
Why did it change?
What should we do next?
That is why management reporting matters. Leaders do not need more numbers. They need context, signals, and actions.
Who uses management reports?
Management reports are used across multiple layers of the organization, including:
Executives and senior leadership to monitor strategic performance
Finance managers and CFOs to track profitability, variance, and resource allocation
Operations directors to identify bottlenecks and execution issues
Department heads to review team performance against goals
Project and program managers to monitor progress, risks, and delivery outcomes
A CEO may want a concise monthly overview with top-line KPIs and major risks. A sales director may need pipeline conversion, win rate, and regional performance. A plant manager may focus on output, downtime, defect rate, and labor efficiency. The report format stays consistent, but the emphasis changes by audience.
Management report vs. operational update vs. ad hoc summary
These terms are often confused, but they serve different purposes.
Report Type
Primary Purpose
Audience
Typical Detail Level
Frequency
Management report
Support decisions with analysis and recommendations
Executives, department leaders
Medium to high
Weekly, monthly, quarterly
Operational update
Track day-to-day execution and activity
Team managers, supervisors
Detailed and tactical
Daily or weekly
Ad hoc summary
Respond to a specific question or issue
Any stakeholder
Narrow and situational
As needed
A management report is broader and more analytical than an operational update. It is also more structured and repeatable than an ad hoc summary. Its value is not just reporting activity, but helping leaders decide where to intervene.
Core Elements required in an effective management report
For most organizations, a useful management report includes these core elements:
Business objective: The goal or strategic priority the report is tracking
Reporting period: The exact timeframe covered by the analysis
KPI performance: The most important metrics compared against target, prior period, or benchmark
Financial summary: Revenue, cost, margin, budget variance, and cash-related signals
Operational analysis: What is driving performance across processes, teams, or projects
Risks and issues: Current blockers, emerging threats, and escalation points
Recommendations: Actions leaders should approve, prioritize, or monitor
Ownership and deadlines: Clear accountability for next steps
Financial Report vs. Management Report: Key Differences
A common source of confusion is the difference between a financial report and a management report. Both are important, but they are built for different purposes.
Purpose
A financial report is primarily used to show the company’s financial position and results. It focuses on standardized statements such as:
Income statement
Balance sheet
Cash flow statement
Financial Report Example
A management report, by contrast, is designed to guide internal decisions. It interprets business performance across finance, operations, sales, service, projects, or other functions.
Audience
Financial reports often serve both internal and external users, such as:
For example, the income statement may show margin compression. The management report reveals that freight costs rose, production yield fell, and a discount-heavy pricing strategy reduced profitability in one region.
This combination gives leaders both control and clarity.
The 7 Essential Sections of a Modern Management Report
A modern management report should be concise, structured, and action-oriented. Below are the seven sections that most high-performing organizations include.
1. Executive Summary
The executive summary is the most important section because busy leaders often read it first and decide from there whether they need to go deeper.
It should summarize:
The most important performance outcomes
Key risks or deviations from plan
Major wins or concerns
Recommended actions
A good executive summary is not a table of contents. It is a business judgment statement.
Example:
Revenue finished 6% above target, driven by stronger enterprise renewals
Gross margin fell 2.3 points due to freight cost increases and product mix changes
Customer support backlog is rising and could affect retention next quarter
Recommend temporary staffing reallocation and pricing review for low-margin SKUs
Key Metrics (KPIs) often highlighted in the executive summary
Revenue growth: Change in sales versus prior period or target
Gross margin: Profitability after direct costs
Operating variance: Difference between actual results and plan
Customer retention: Percentage of customers maintained
Delivery performance: Timeliness of service or output against SLA or plan
2. Goals and Reporting Period
This section establishes context. Without it, stakeholders may misread the numbers or apply the wrong assumptions.
Include:
Business objectives being measured
Scope of the report
Department, project, or business unit covered
Reporting period and comparison basis
For example, a report might cover:
Q2 performance for the customer service department
Monthly performance for the APAC sales region
Weekly manufacturing output for Plant A
YTD progress on strategic transformation initiatives
What to clarify in this section
Objective: What the business is trying to achieve
Scope: Which teams, products, regions, or projects are included
Timeframe: The period covered by the report
Comparison baseline: Prior month, prior year, plan, forecast, or benchmark
This section sounds simple, but it prevents costly confusion.
3. KPI and Performance Overview
This is the analytical core of the management report. It should present the metrics that matter most to decision-makers.
Objectives and KPIs framework: Links goals directly to measurable results
Balanced scorecard approach: Tracks financial, customer, process, and people dimensions
Plan vs. actual framework: Highlights variance against budget or forecast
RAG status model: Uses red, amber, and green flags to focus attention quickly
Owner-action tracker: Connects issues and recommendations to named accountability
These frameworks reduce ambiguity and help leadership discussions stay focused.
Standardize definitions and data sources to improve trust in the report
If different teams define the same KPI differently, the report loses credibility.
Standardize:
Metric definitions
Source systems
Cutoff dates
Calculation logic
Ownership for validation
This is especially important in enterprise environments where data comes from ERP, CRM, HR, production, and project systems.
Avoid common mistakes
The most common reasons a management report fails are predictable:
Too much detail and not enough synthesis
No clear executive summary
Outdated or irrelevant metrics
Unclear recommendations
Inconsistent KPI definitions
Reporting that arrives too late to act on
Visuals without interpretation
Good news bias that hides real issues
4 practical best practices for implementation
If you are building or improving a management reporting process, follow these steps.
1. Start with decisions, not data
List the decisions leaders need to make each week or month. Then choose the KPIs and report sections that support those decisions.
2. Define a standard reporting template
Create one consistent report structure with mandatory sections, metric definitions, and commentary rules.
3. Automate data collection and dashboard refresh
Reduce manual spreadsheet work by connecting source systems and updating reports automatically where possible.
4. Add owner-based action tracking
Every major issue or recommendation should have an owner, due date, and progress status.
These four steps dramatically improve usefulness and executive trust.
Why many enterprises modernize management reporting with dashboards
Traditional reporting often breaks down because of fragmented spreadsheets, slow data consolidation, and inconsistent definitions. A dashboard-based reporting model helps teams standardize metrics, drill into issues faster, and distribute management reports with less manual effort.
FineReport is often a strong fit when organizations need to:
For enterprise teams, this reduces reporting cycle time while improving transparency.
Example Management Report Template
A good template keeps the report consistent and easier to complete under time pressure.
Suggested management report format
Below is a practical structure you can adapt.
1. Report header
Include:
Report title
Reporting period
Prepared by
Department or business unit
Intended audience
2. Executive summary block
Include:
Overall performance status
Top 3 insights
Top 3 risks
Recommended actions
3. KPI dashboard section
Include:
KPI name
Current result
Target
Prior period
Variance
Trend
Commentary
4. Financial and operational performance section
Include:
Revenue and margin highlights
Budget vs. actual summary
Cost drivers
Operational performance analysis
Process or project insights
5. Risks and opportunities section
Include:
Key risk
Impact
Mitigation plan
Opportunity
Expected benefit
Owner
6. Recommendations, owners, and next-step tracker
Include:
Action item
Priority
Owner
Due date
Status
Simple management report template
You can use this structure as a starting point.
Section
What to include
Title and context
Report name, period, audience, preparer
Executive summary
Key outcomes, risks, recommended actions
Goals and scope
Objectives, covered areas, timeframe
KPI overview
Core metrics, targets, trends, variance
Financial highlights
Revenue, cost, margin, budget variance
Operational insights
Drivers, bottlenecks, project or process updates
Risks and opportunities
Issues, impact, mitigation, growth areas
Next steps
Actions, owners, deadlines, follow-up status
Simple checklist for completing management reports
Before sharing a management report, check the following:
Confirm data accuracy: Are the numbers validated and current?
Review KPI definitions: Are metrics calculated consistently?
Update commentary: Does each section explain what changed and why?
Check visual clarity: Are charts readable and decision-focused?
Verify action items: Does each recommendation have an owner and deadline?
Tailor for the audience: Is the level of detail right for the recipients?
Remove noise: Is every included metric relevant to a decision?
Ensure timeliness: Will leaders receive the report in time to act?
Final Takeaway
A management report is not just a reporting document. It is a decision-making tool. When built well, it gives leaders a clear view of performance, highlights what needs attention, and turns insight into action.
If your current reporting process is slow, fragmented, or too manual, it may be time to move from static documents to automated dashboards and standardized report templates.
A management report helps leaders understand performance, spot changes, explain causes, and decide what actions to take next. Its goal is to turn business data into decision-ready insight.
Most management reports include the reporting period, business objectives, KPI results, financial highlights, operational analysis, risks, and recommendations. Strong reports also assign ownership and timelines for next steps.
A financial report focuses on formal financial statements and is often used for compliance or external stakeholders. A management report is mainly for internal use and adds analysis, context, and actions across finance and operations.
The right frequency depends on how fast the business changes and who will use the report. Many teams create them weekly, monthly, or quarterly, with monthly reporting being common for leadership reviews.
An effective management report is clear, concise, and focused on the metrics that matter most to the audience. It should highlight risks early, explain why performance changed, and recommend practical next actions.
Product Trial
FineReport
Pixel-perfect reports · Interactive dashboards · Easy data entry · Digital twins