A performance report is not just a document. It is a decision tool that helps managers, department heads, and executives understand what is working, what is underperforming, and what actions should happen next. If your team is drowning in updates but still struggling to answer questions about results, accountability, or priorities, a strong performance report closes that gap fast.
All reports in this article are built with FineReport.
What a performance report is and why it matters
A performance report is a structured summary of results over a defined period. It combines metrics, context, and recommendations so stakeholders can evaluate progress and make decisions. In practical terms, it answers four essential questions:
What happened?
Why did it happen?
Does it matter?
What should we do next?
For business leaders, this matters because activity alone does not prove value. A team can complete tasks, attend meetings, and deliver updates without improving revenue, efficiency, quality, or customer outcomes. A good performance report turns scattered data into clear operational insight.
Tracking activity vs measuring outcomes vs reporting performance
These three concepts are often mixed together, but they are not the same.
Tracking activity shows what people did
Example: number of calls made, campaigns launched, tickets closed, or meetings held.
Measuring outcomes shows what those actions achieved
Example: revenue generated, conversion rate improved, defects reduced, or churn lowered.
Reporting performance connects activities and outcomes to business goals
Example: whether increased outreach improved qualified pipeline enough to justify sales headcount expansion.
This distinction is critical. Leaders do not just need dashboards full of numbers. They need reporting that explains performance in relation to objectives, targets, benchmarks, and risk.
Who uses performance reports
Performance reports are useful across every layer of the business:
Team leads use them to manage day-to-day execution
Department managers use them to compare teams, diagnose issues, and allocate resources
Operations directors use them to identify bottlenecks and improve workflows
Finance leaders use them to monitor budget, margin, and forecast accuracy
Executives use them to evaluate strategic progress and make investment decisions
In mature organizations, performance reporting is not an occasional exercise. It becomes a repeatable management system tied to weekly reviews, monthly business reporting, quarterly strategy checks, and annual planning.
How to write a performance report step by step
Writing a strong performance report is not about adding more charts. It is about creating a report that supports action. The best reports are concise, relevant, and aligned with how decisions are made in the organization.
The core framework: key metrics every performance report should consider
Before drafting the report, define the few metrics that actually reflect performance. Most weak reports fail because they include too much data and too little meaning.
Key Metrics (KPIs)
Goal attainment: Measures how actual results compare with planned targets or objectives.
Productivity: Tracks output volume relative to time, labor, or capacity.
Efficiency: Shows how well resources such as budget, staff, or time are used.
Quality: Measures accuracy, defect rates, rework, compliance, or service quality.
Timeliness: Evaluates whether work is completed on schedule or within SLA.
Cost variance: Compares actual spending with approved budget.
Revenue or value delivered: Quantifies financial or strategic contribution.
Risk level: Flags issues that may delay results, reduce quality, or increase cost.
Trend direction: Indicates whether performance is improving, flat, or declining over time.
Forecast confidence: Assesses how likely the team is to meet future targets based on current trajectory.
Core elements of an effective performance report
Every high-quality performance report should include:
Clear reporting objective
Defined time period
KPI definitions and calculation logic
Current results and trend comparison
Variance against target or plan
Brief explanation of major changes
Risks, blockers, or dependencies
Recommended actions with accountable owners
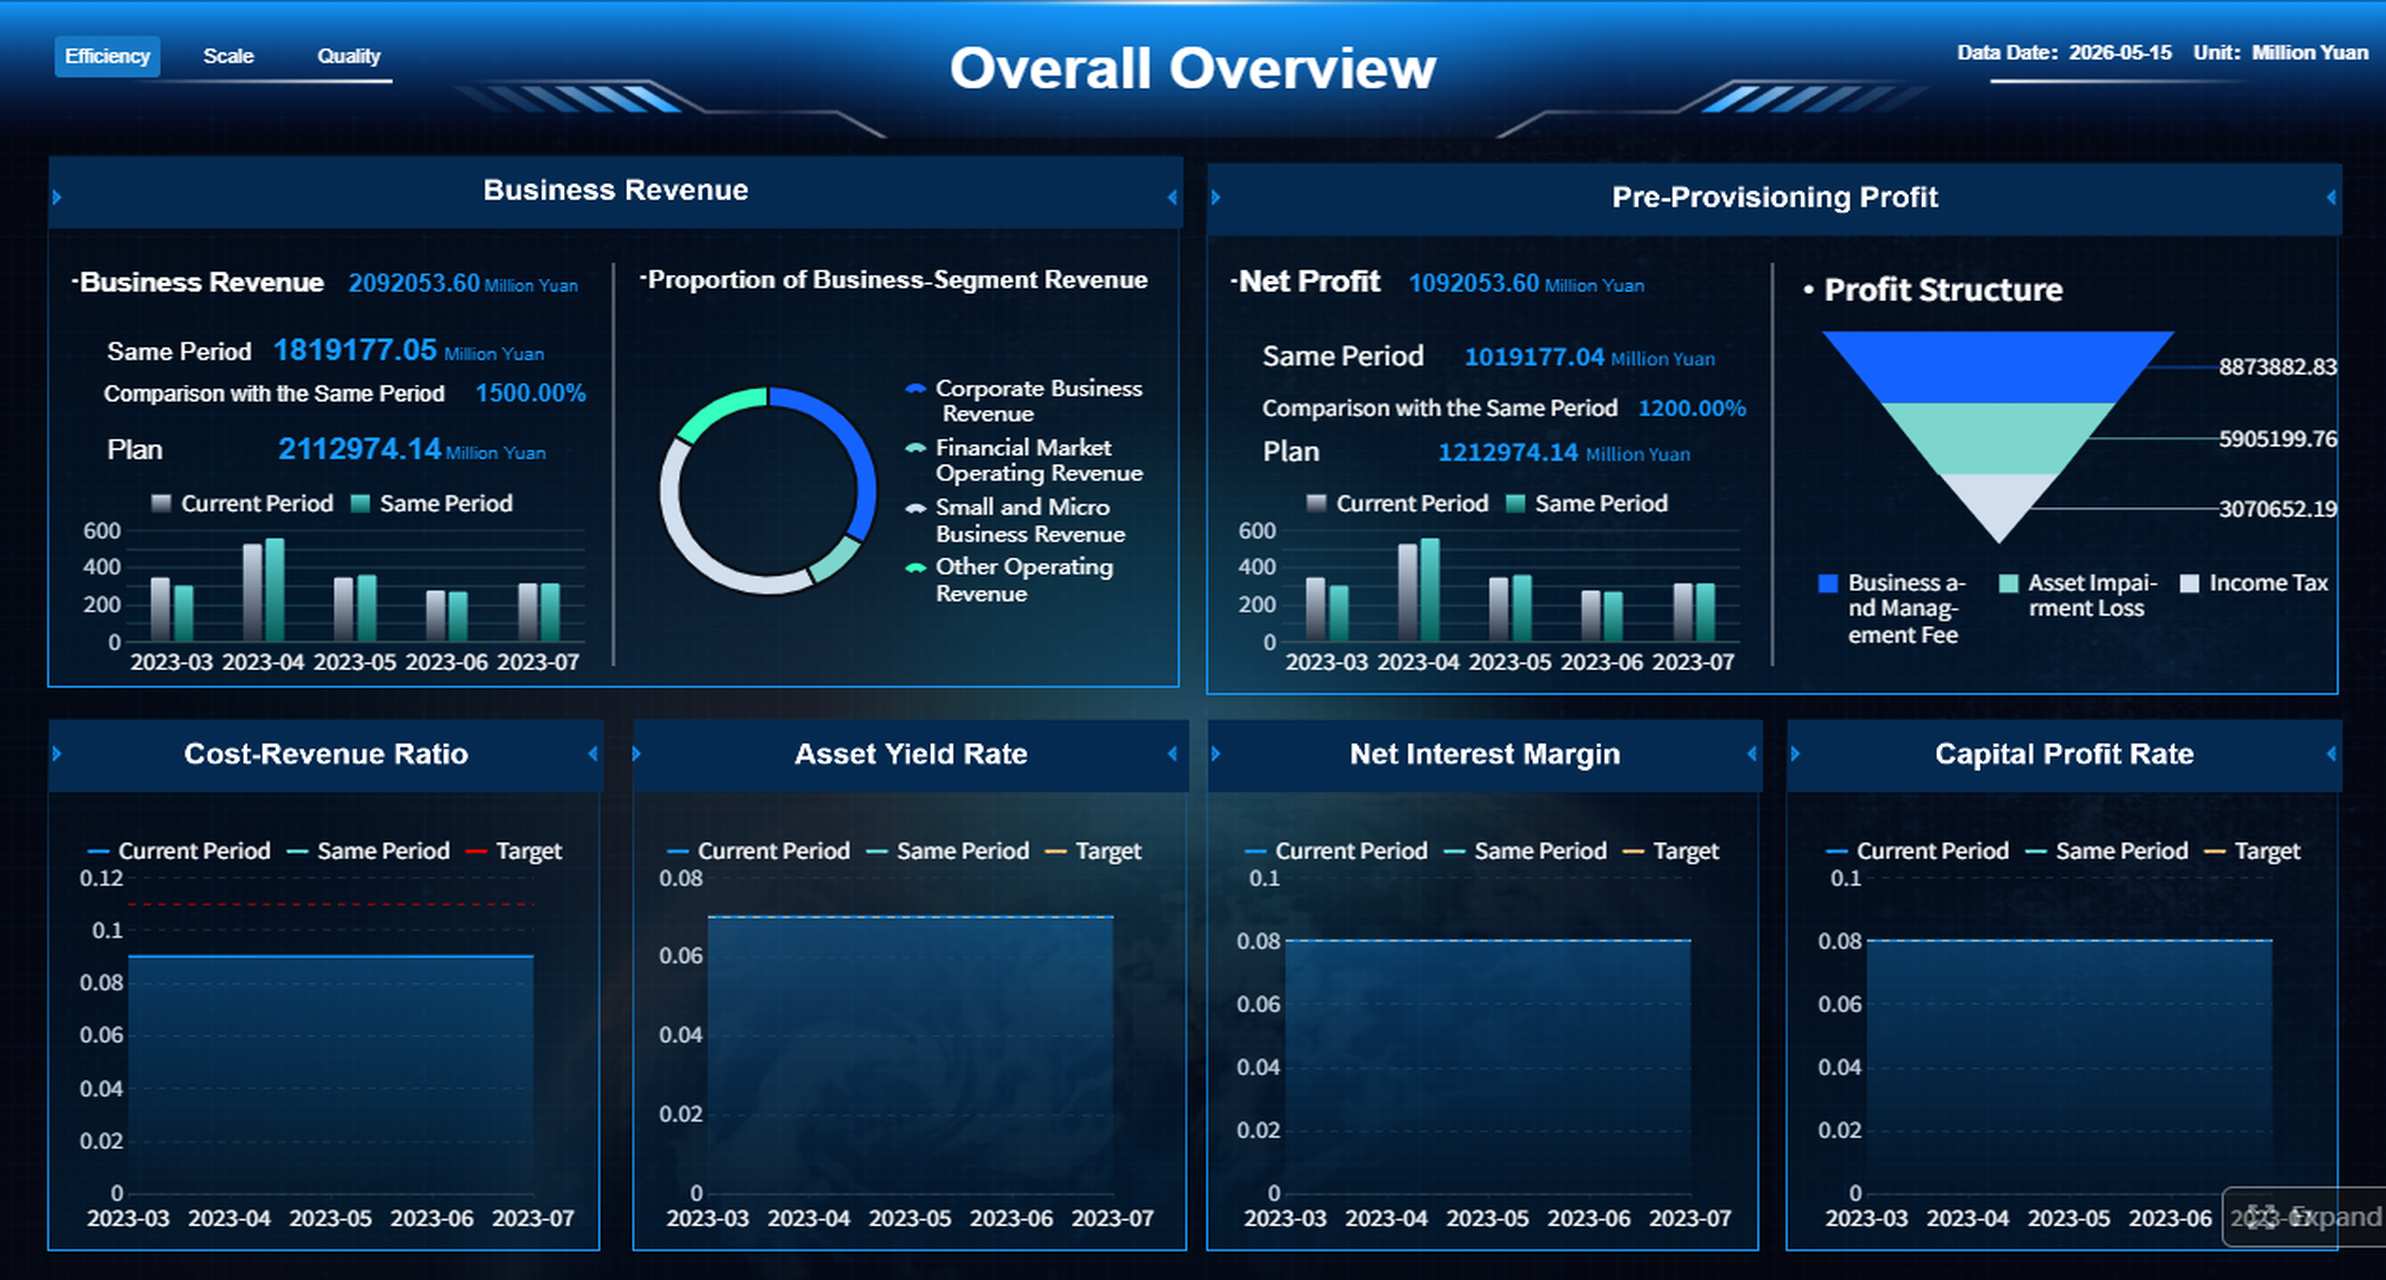
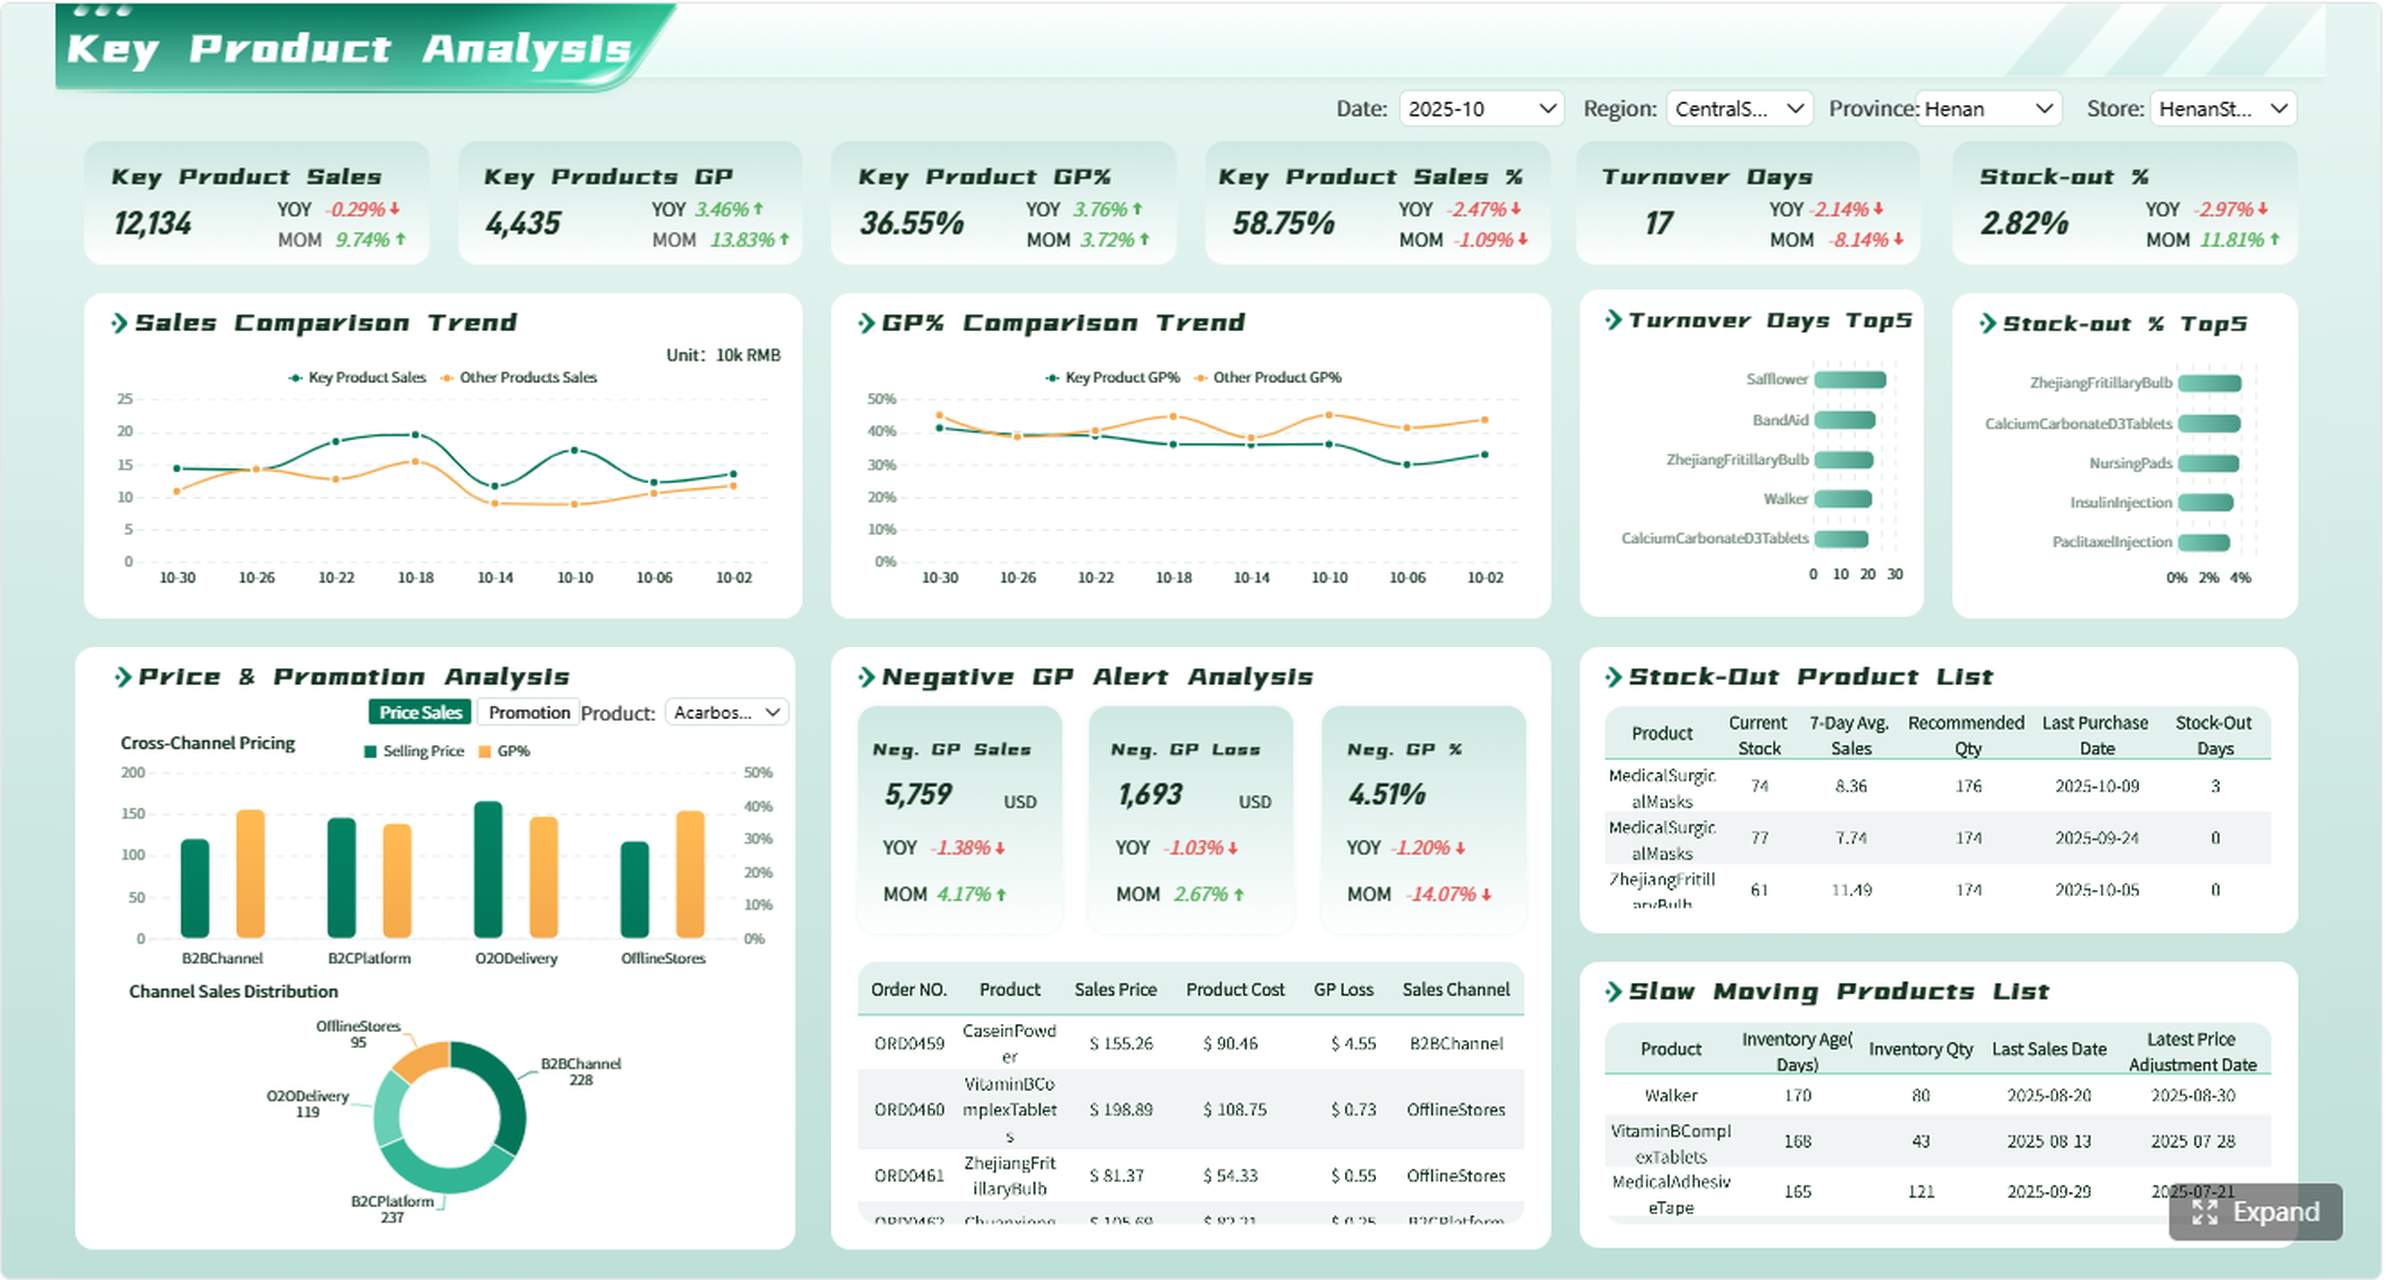
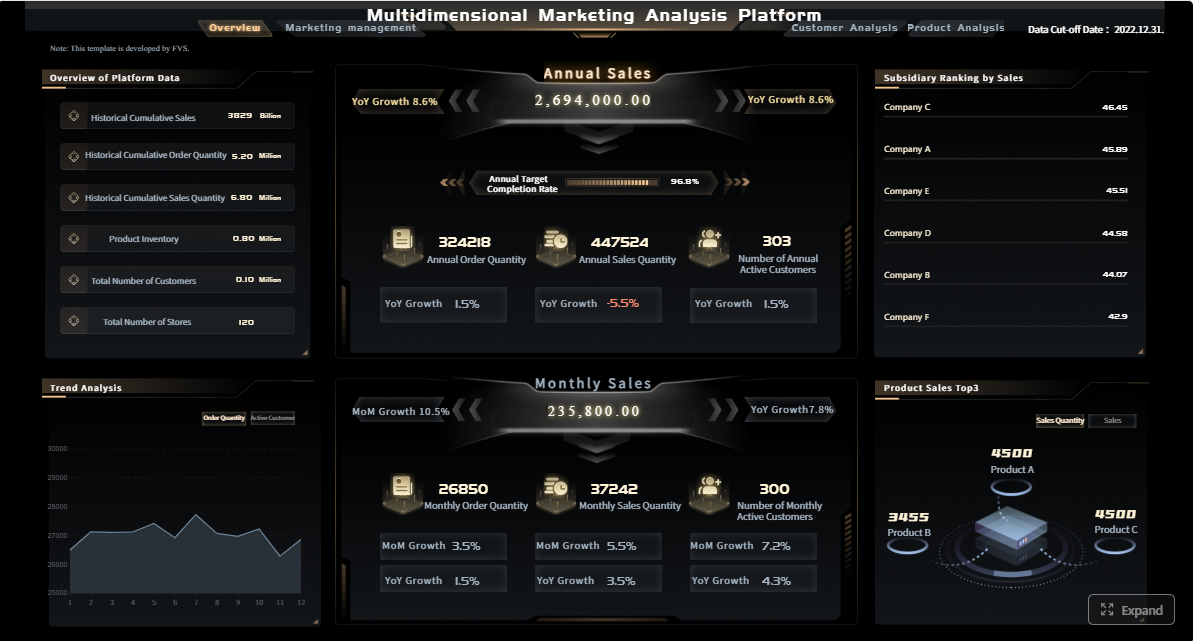
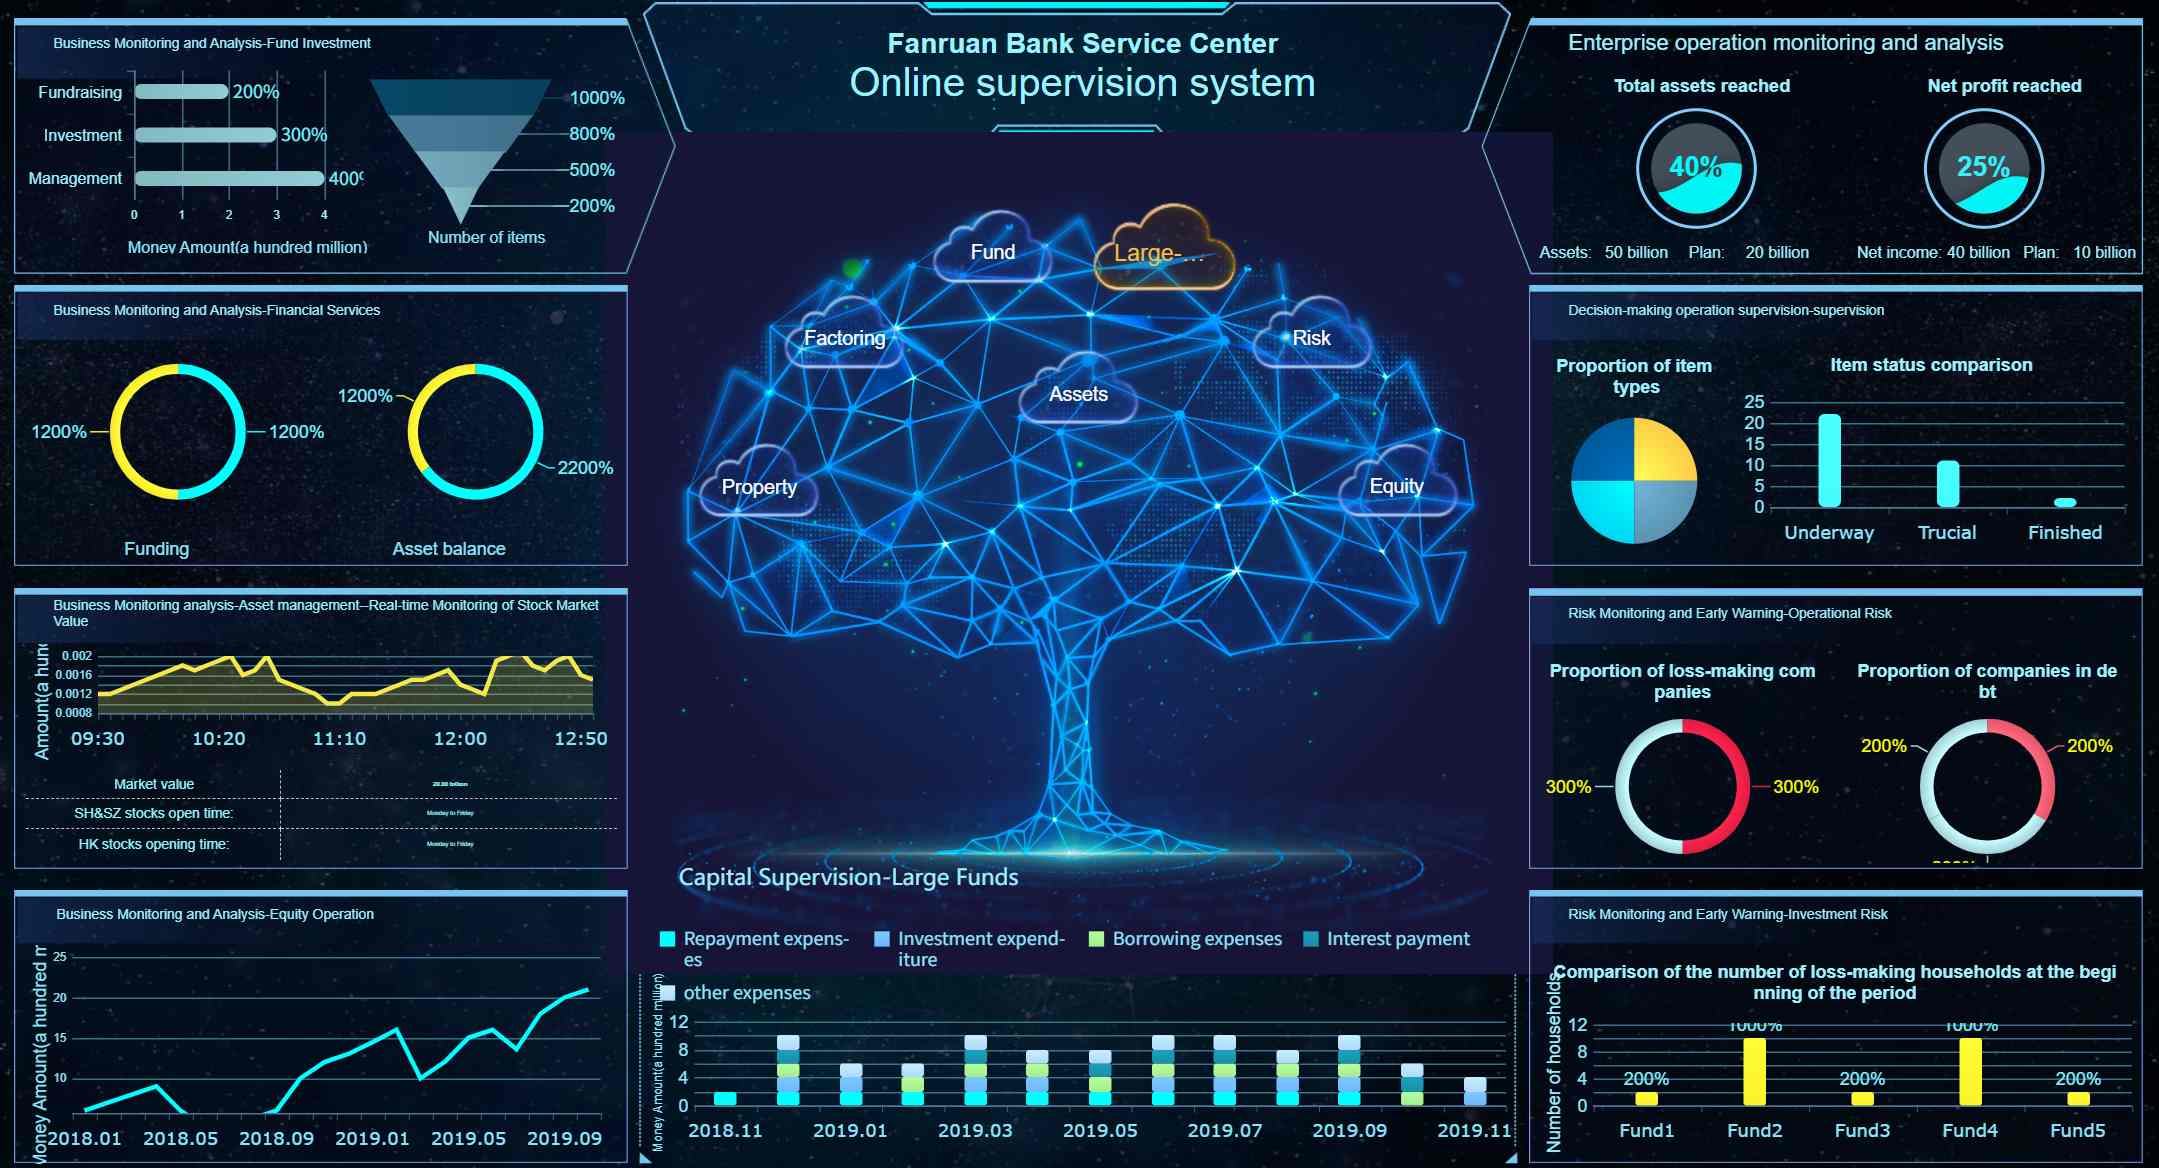
Tools like FineReport make this much easier because they allow teams to combine KPI scorecards, trend charts, drill-down analysis, and scheduled distribution into one reporting workflow instead of managing disconnected spreadsheets.
Start with the purpose, audience, and reporting period
The first step in writing a performance report is deciding why it exists.
Ask these questions first:
Who will read this report?
What decision do they need to make?
What time period matters?
What scope should be included?
What does success look like?
A sales manager may need a weekly report to coach representatives and rebalance pipeline. A CFO may need a monthly report focused on cost drivers and forecast shifts. An executive team may need a quarterly report that highlights only strategic KPIs and major risks.
If the audience is unclear, the report will become bloated. If the decision is unclear, the report will become passive.
Gather the right data and choose meaningful metrics
Good reporting starts with disciplined data selection. Do not report everything you can measure. Report what best reflects results.
Use a focused KPI set that covers:
Results such as revenue, output, or project delivery
Efficiency such as cycle time, utilization, or cost per unit
Quality such as defect rate, satisfaction score, or error rate
Risk such as overdue items, budget overrun, or forecast gap
Then add concise commentary for context. Numbers alone cannot explain a delayed milestone, sudden conversion drop, or cost spike. A short note on root cause, assumptions, or one-time events dramatically improves decision quality.
Structure the report for clarity and action
A strong structure makes the report easy to scan.
A practical format looks like this:
Section
What to include
Summary
Top findings, overall status, biggest changes
Objectives
What the team or function was expected to achieve
KPIs
Metric values, targets, trends, and variances
Analysis
What changed, why it changed, and what it means
Risks
Blockers, issues, dependencies, or emerging concerns
Actions
Recommendations, owners, deadlines, and next steps
Start with the executive summary. Many stakeholders will only read the first section, so it should capture the signal quickly. Then move into detail by objective, metric, and insight. End with action items, not generic conclusions.
Review accuracy, format, and delivery cadence
Even a well-written report loses credibility if the numbers are inconsistent. Before distribution, validate:
Calculations and formulas
Source systems and extraction logic
KPI definitions across periods
Date ranges and reporting scope
Version consistency and formatting
Also choose the right cadence:
Weekly for operational monitoring and fast intervention
Monthly for management review and trend analysis
Quarterly for strategic performance evaluation
Annual for formal review, planning, and accountability
The format should match stakeholder behavior. If leaders need quick review, dashboards and one-page summaries work best. If auditors or board members need a record, a more formal written report may be required.
Actionable best practices for implementing performance reporting
Many organizations know they need better reporting but struggle with adoption. These practices help turn reporting into a management discipline rather than a reporting chore.
1. Build one KPI dictionary before building more reports
3. Use commentary to explain exceptions, not restate numbers
Do not write: “Revenue was 8% below target.”
Write: “Revenue was 8% below target due to delayed enterprise deal closures in the West region, partially offset by stronger SMB renewals.”
That is the difference between reporting data and reporting performance.
4. Assign owners to every action item
A report without ownership is just observation. Each recommendation should have:
Action
Owner
Deadline
expected outcome
This creates follow-through and makes the next reporting cycle more useful.
5. Automate recurring reports wherever possible
Manual reporting slows teams down and introduces errors. Automating data refresh, report generation, and scheduled distribution saves time and improves trust. This is where enterprise reporting platforms become especially valuable.
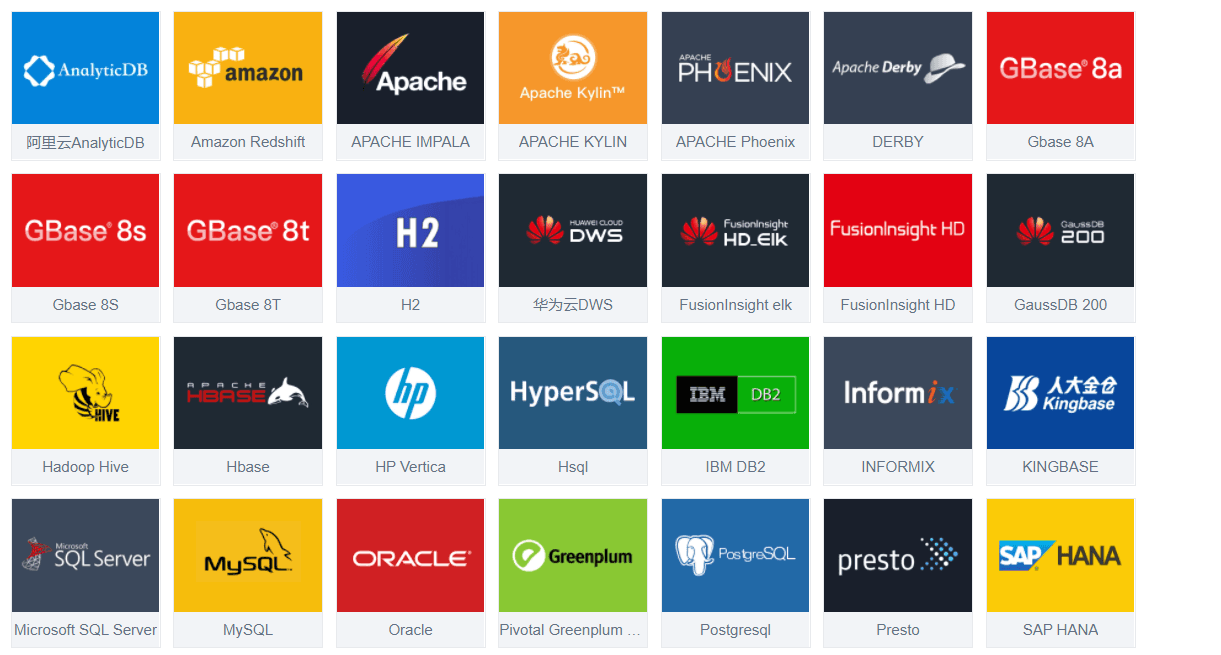
FineReport is a strong fit here because it helps organizations connect multiple data sources, build pixel-perfect reports and dashboards, enable drill-down analysis, and distribute reports on a fixed schedule without heavy manual consolidation.
Connection of Multiple Data Sources
7 performance report examples by use case
Different functions need different report structures. Below are seven practical examples of how a performance report should look depending on the use case.
Employee performance report
An employee performance report evaluates individual contribution over a specific period. It should balance measurable outcomes with development-oriented feedback.
A digital transformation project report may show that build progress is at 78%, but critical integration testing is two weeks behind plan. Budget remains within 3% of forecast, but vendor dependency risk has increased. The report should clearly explain what executive intervention is needed, if any.
Sales performance report
A sales performance report focuses on pipeline health, conversion efficiency, and revenue generation.
What to include
Revenue vs target
Pipeline coverage
Conversion rates by stage
Average deal size
Rep, territory, or segment performance
Forecast confidence
Example metrics
Closed revenue
Pipeline value
Win rate
Average sales cycle
Average deal size
Quota attainment
Lead-to-opportunity conversion
Example use case
A monthly sales performance report might reveal that revenue is up 11% year over year, but win rate is down in mid-market deals. The report should connect those findings to deal quality, pricing pressure, or rep performance and suggest actions such as requalification rules or targeted enablement.
Marketing, operations, finance, and executive reports
These functions often require more specialized reporting, but the same logic applies: define the purpose, track the right KPIs, add context, and conclude with actions.
Marketing performance report
A marketing performance report measures how campaigns and channels contribute to business growth.
Not every performance report should look the same.
Weekly reports
Best for monitoring fast-moving operations, frontline teams, support functions, and delivery execution.
Monthly reports
Best for management review, budgeting checks, departmental performance, and tactical correction.
Quarterly reports
Best for broader trend evaluation, strategic progress checks, and leadership decisions.
Annual reports
Best for formal review, long-term performance assessment, and planning.
Annual reports usually include more context, strategic reflection, and year-over-year comparisons. Weekly and monthly reports should be faster, lighter, and more exception-based.
Common mistakes to avoid
Weak performance reports usually fail in predictable ways.
Too many metrics
More KPIs do not improve insight. They usually dilute focus.
Missing context
A metric without explanation can trigger the wrong conclusion.
Unclear recommendations
If readers do not know what action is required, the report will not change outcomes.
Inconsistent definitions
If teams define metrics differently, comparisons become useless.
Raw data overload
Tables of numbers are not a performance report unless they are interpreted.
A reporting platform that supports standardized templates, centralized metric logic, and visual storytelling can eliminate many of these issues. FineReport is especially useful for organizations that want both dashboard-style monitoring and formal enterprise-grade report outputs in the same environment.
How to make performance report writing drive better results
The real value of a performance report is not the report itself. It is what happens after the report is reviewed.
Compare current performance with targets and benchmarks
Add short narrative explanation where the numbers need interpretation
Revisit goals and KPI definitions as business priorities evolve
The strongest organizations treat reporting as a closed loop:
Define objectives
Measure the right metrics
Report results clearly
Assign actions
Review follow-through
Adjust goals and resources
That is how a performance report becomes a management system instead of a passive summary.
If you want to scale that process across employee reviews, project tracking, sales reporting, operational dashboards, finance analysis, and executive reporting, FineReport provides the flexibility to build pixel-perfect reports, interactive dashboards, and automated enterprise reporting workflows from one platform.
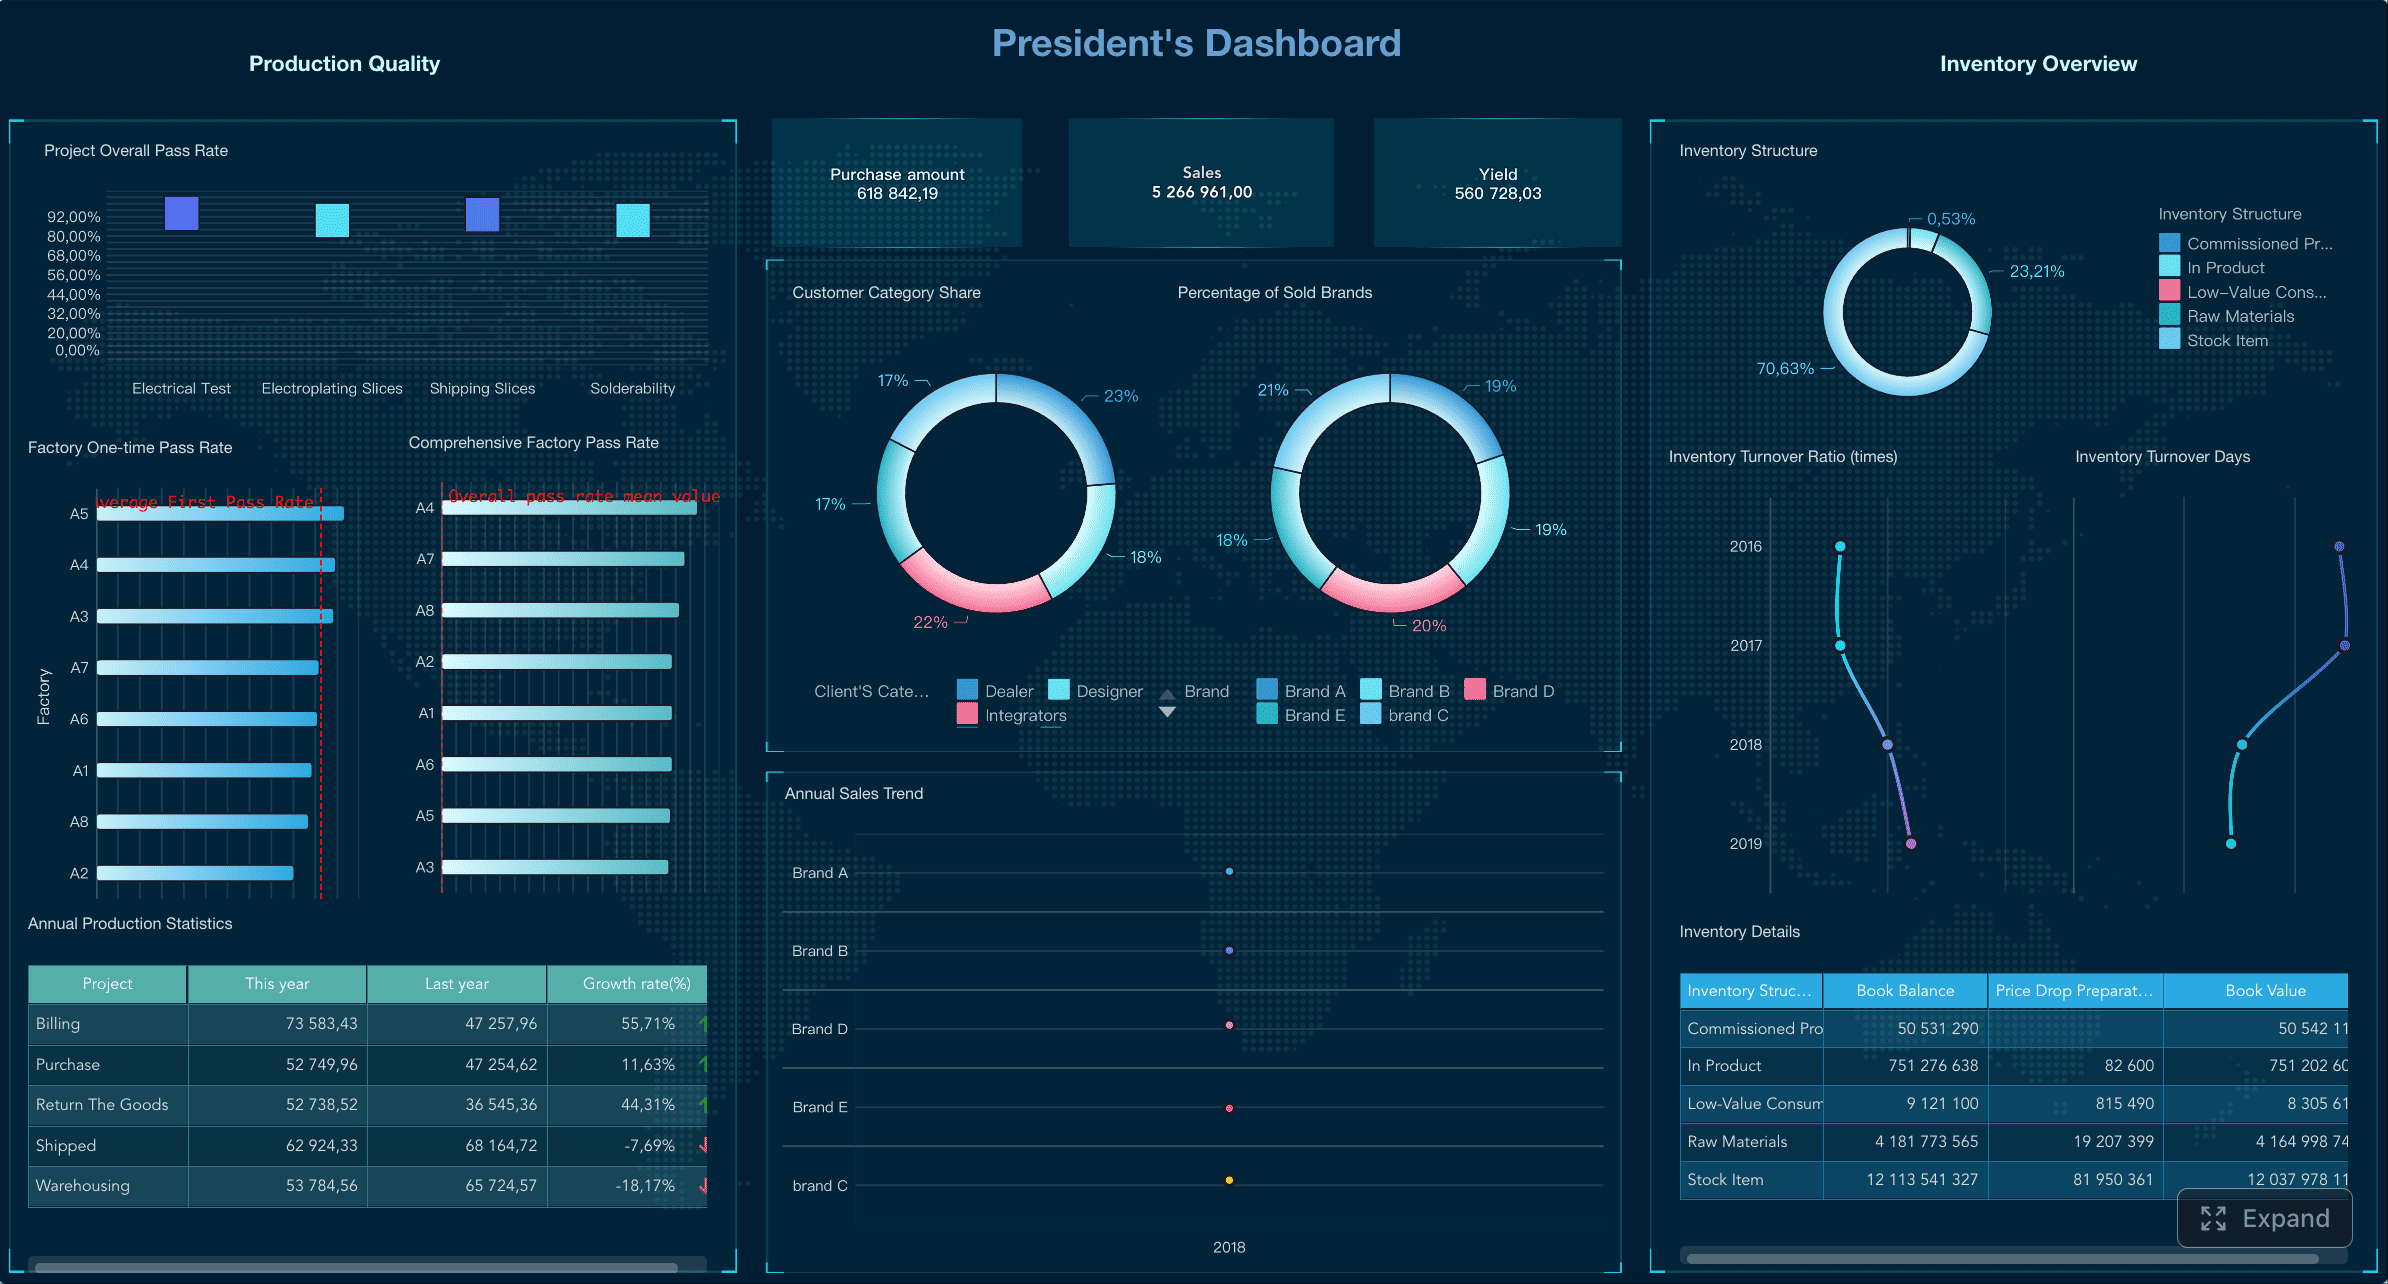
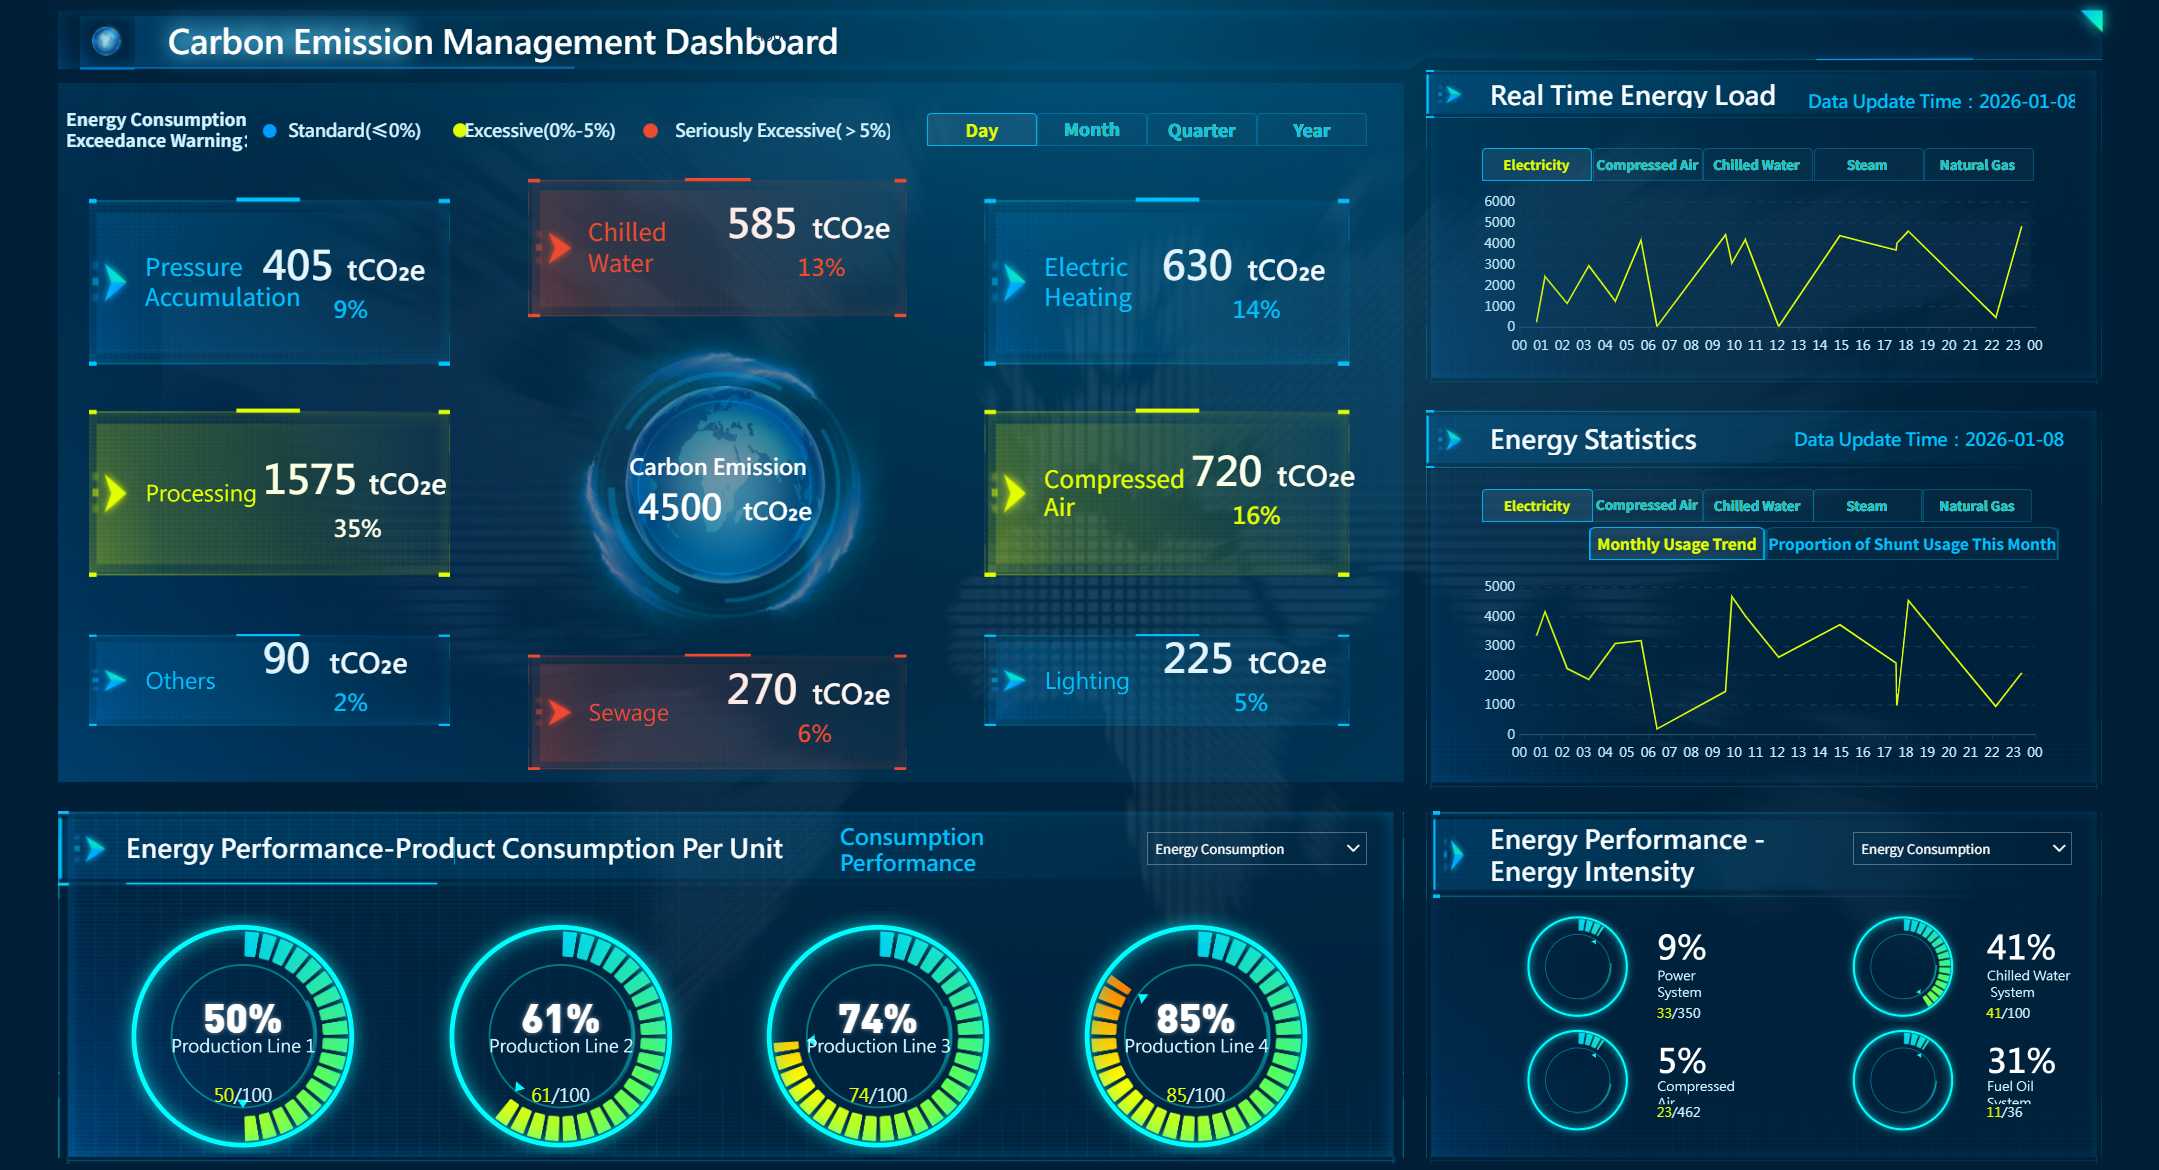
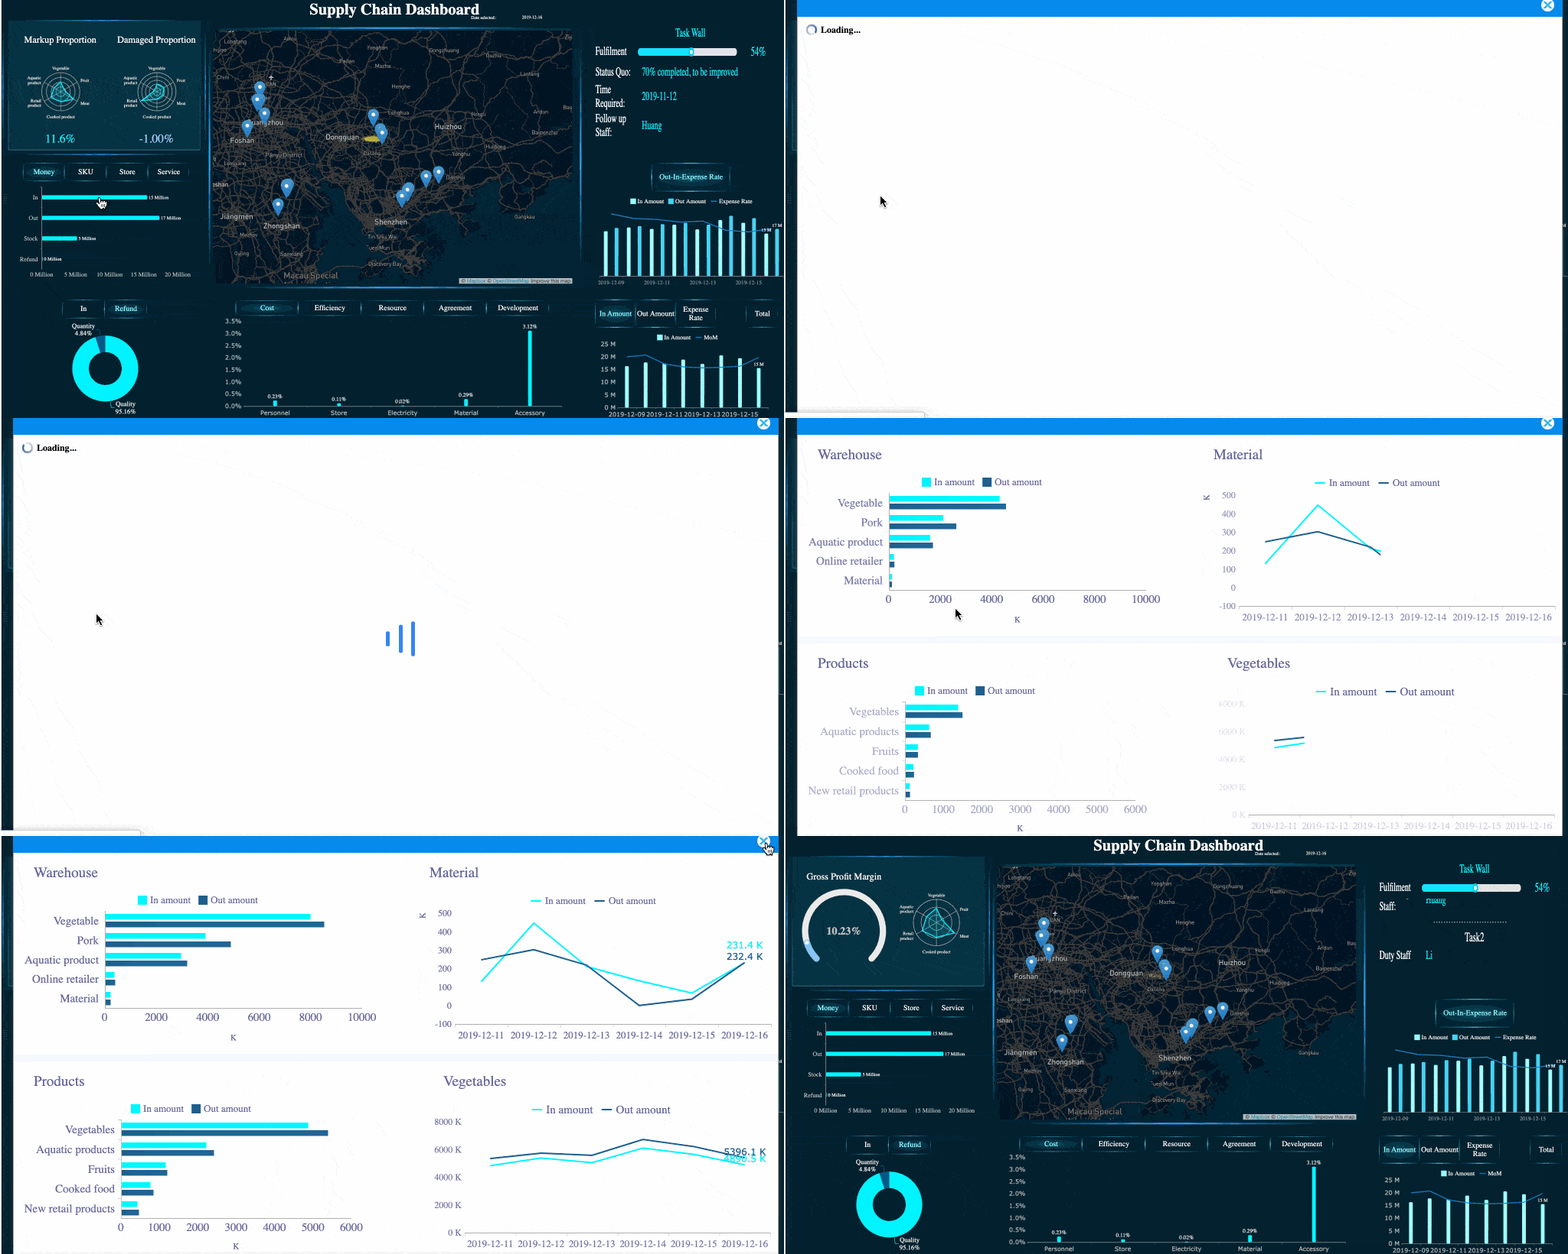
Get Ready-to-Use Dashboard Templates in Fine Gallery
A strong performance report should include the reporting objective, time period, key KPIs, results against targets, trend context, major risks, and recommended next steps. The goal is to explain what happened, why it happened, and what action should follow.
A status update usually shows what tasks were completed, while a performance report connects results to business goals and decision-making. It adds context such as target variance, trends, outcomes, and risks.
Choose KPIs that directly reflect the goal of the report and the decisions your audience needs to make. Focus on a small set of meaningful measures such as goal attainment, efficiency, quality, cost variance, and forecast confidence.
The right frequency depends on the use case, audience, and speed of the business process being reviewed. Teams may use weekly reports for execution, monthly reports for management reviews, and quarterly reports for strategic decisions.
Executive-ready reports highlight strategic KPIs, major exceptions, trend direction, and business risks without too much operational detail. They help leaders quickly see what is on track, what is off track, and where action or investment is needed.
Product Trial
FineReport
Pixel-perfect reports · Interactive dashboards · Easy data entry · Digital twins


 Connection of Multiple Data Sources