FineReport is a centralized reporting system designed for enterprise reporting, dashboarding, pixel-perfect reports, and governed data distribution across departments.
Top 10 centralized reporting system tools compared
1. FineReport
One-sentence overview:FineReport is best for organizations that need enterprise-grade centralized reporting, flexible report design, strong data permissions, and broad deployment options.
Scheduled reporting, burst delivery, and export to multiple formats
Role-based access control, data permissions, and audit-friendly administration
Integration with multiple databases, business systems, and application environments
Support for large-scale enterprise reporting across finance, operations, education, and public-sector workflows
Pros & Cons:
Pros: Strong report formatting; good fit for centralized report distribution; flexible deployment; suitable for complex, multi-department reporting; solid governance capabilities
Cons: Advanced enterprise implementations may still require planning and technical support; teams focused only on lightweight self-service BI may use only part of its feature set
Best For (Target user/scenario): Enterprises, regulated organizations, and reporting teams that need a robust centralized reporting system for standardized outputs, secure access, and scalable report operations.
2. Microsoft Power BI
One-sentence overview: Microsoft Power BI is a strong centralized reporting system option for organizations already invested in Microsoft 365, Azure, and SQL Server.
Cons: Licensing can become complex; advanced modeling and administration have a learning curve
Best For (Target user/scenario): Mid-sized and large organizations standardizing on Microsoft tools for reporting and analytics.
3. Tableau
One-sentence overview: Tableau is a leading choice for teams that prioritize visual analysis, exploratory dashboards, and interactive reporting experiences.
Tableau Server and Tableau Cloud deployment options
Collaboration and sharing features
Pros & Cons:
Pros: Powerful visuals; strong user community; flexible analysis workflows
Cons: Higher cost than some alternatives; governance often requires additional setup and discipline
Best For (Target user/scenario): Data teams and business units that value interactive dashboards and visual exploration.
4. Looker
One-sentence overview: Looker is well suited to organizations that want a governed semantic layer and centralized metric definitions across reporting use cases.
Cons: Interface preferences vary by user; advanced setup can be demanding
Best For (Target user/scenario): Organizations that want self-service discovery alongside centralized reporting.
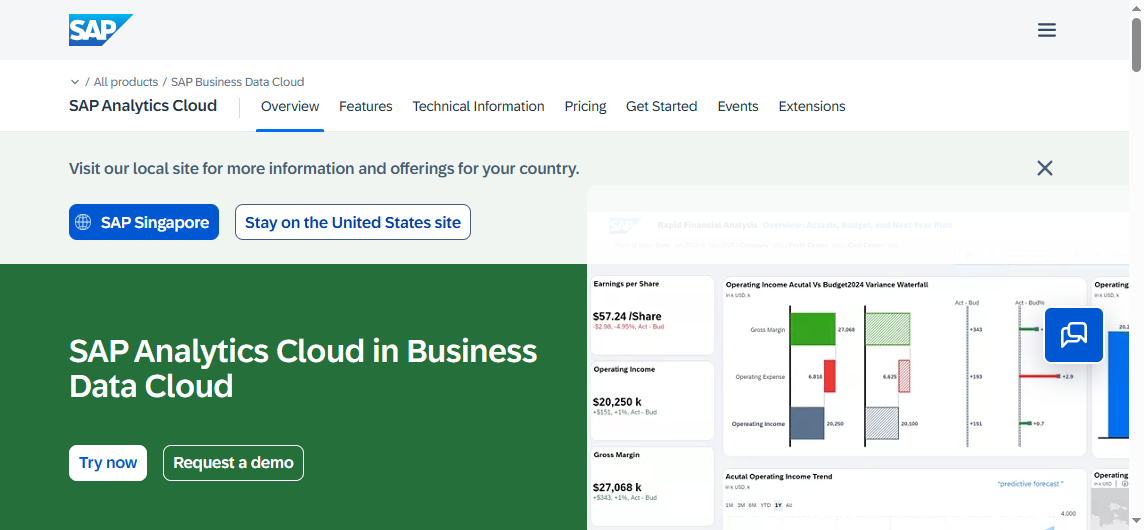
6. SAP Analytics Cloud
One-sentence overview: SAP Analytics Cloud is a centralized reporting system choice for enterprises standardizing reporting, planning, and analytics inside SAP-heavy environments.
Key Features:
Combined analytics and planning
Integration with SAP systems and data models
Enterprise security and administration
Dashboarding and predictive capabilities
Cloud-based collaboration
Pros & Cons:
Pros: Planning and analytics in one platform; strong enterprise controls
Cons: Delivers strongest value in SAP ecosystems; can be costly
Best For (Target user/scenario): Large enterprises already using SAP applications and infrastructure.
7. IBM Cognos Analytics
One-sentence overview: IBM Cognos Analytics remains a viable option for organizations that need governed enterprise reporting, scheduling, and controlled report distribution.
Cons: Some users find the experience dated; administration can be heavy
Best For (Target user/scenario): Large organizations with formal reporting processes and strict governance requirements.
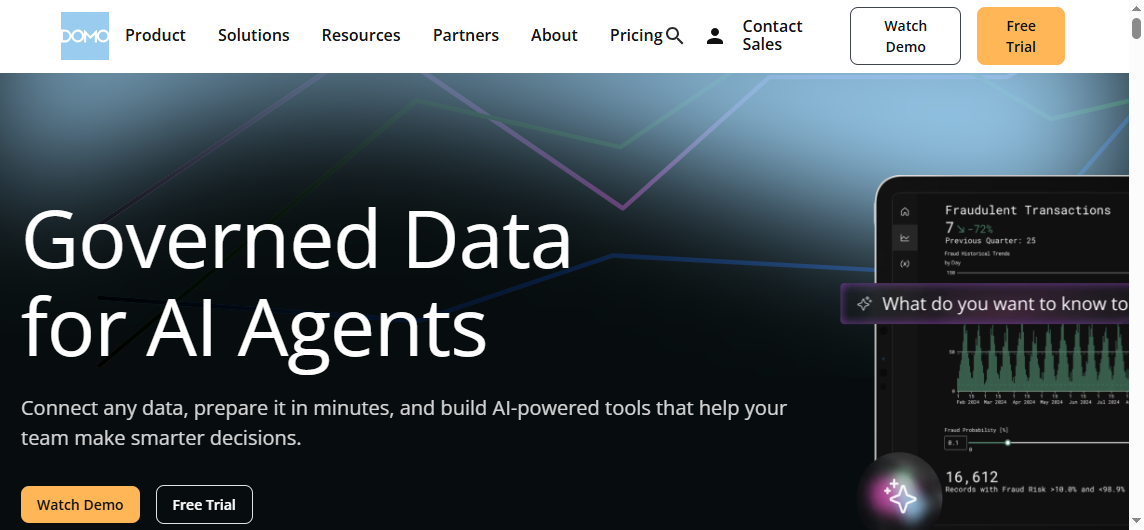
8. Domo
One-sentence overview: Domo is built for fast deployment and executive-friendly reporting, especially where speed and broad connectivity are priorities.
Key Features:
Cloud-based dashboards
Wide connector library
Mobile reporting access
Collaboration and alerts
Rapid dashboard development
Pros & Cons:
Pros: Fast setup; broad connectors; good mobile access
Cons: Pricing can be a concern; customization may be limited in more specialized scenarios
Best For (Target user/scenario): Teams that want quick value and executive reporting without a long rollout cycle.
9. Sisense
One-sentence overview: Sisense is particularly strong when reporting needs to be embedded into products, portals, or customer-facing applications.
Cons: Setup quality depends heavily on use case complexity
Best For (Target user/scenario): Software vendors and product teams building reporting into applications.
10. Zoho Analytics
One-sentence overview: Zoho Analytics is a practical centralized reporting system for smaller teams that want affordability and ease of adoption.
Key Features:
Self-service reporting and dashboards
Data connectors and imports
Scheduled reports and sharing
AI-assisted insights
Cloud accessibility
Pros & Cons:
Pros: Affordable; easy to start; solid connector coverage
Cons: Less depth for advanced enterprise governance
Best For (Target user/scenario): SMBs and departmental teams with moderate reporting needs and tighter budgets.
11. Google Looker Studio
One-sentence overview: Google Looker Studio is a lightweight reporting tool for teams that need simple dashboards and easy sharing in Google-centric environments.
Best For (Target user/scenario): Small teams and marketers using Google platforms for lightweight reporting.
What to look for in a centralized reporting system in 2026
A modern centralized reporting system should do more than display charts. It should centralize report creation, standardize KPI definitions, control permissions, and make trusted information available to different user groups without duplicating effort. In 2026, the most effective platforms combine governed reporting with enough flexibility for business teams to work quickly.
Core capabilities that matter most for modern reporting teams
The first requirement is broad reporting coverage. Many organizations need more than dashboards. They also need:
A strong centralized reporting system should support both recurring standardized reports and interactive decision-making. This matters most in finance, operations, sales, HR, education, and public administration, where different stakeholders consume the same core data in different formats.
FineReport stands out here because it balances formatted enterprise reporting with dashboarding and centralized distribution, which is often a better fit for organizations that need production-grade reports rather than dashboards alone.
How usability, data accuracy, and integration depth affect adoption
Even the most feature-rich reporting platform will fail if users do not trust or understand it. Adoption depends on three things:
Usability: Can business users find reports quickly and navigate them without heavy training?
Data accuracy: Are metrics consistent across departments?
Integration depth: Can the tool connect to ERP, CRM, HR, databases, spreadsheets, cloud apps, and internal systems?
Data accuracy is especially important in a centralized reporting system because the whole point is to create one trusted reporting layer. Tools with semantic models, governed datasets, or reusable report templates usually perform better in complex organizations.
Integration depth also influences long-term value. A tool that connects only to a few cloud apps may work for a department, but enterprise adoption often requires deeper connectivity to legacy systems, warehouses, APIs, and operational databases.
Security, permissions, and audit trails for regulated environments
For regulated industries and public-sector teams, reporting features alone are not enough. Security architecture is often the deciding factor. Look for:
Role-based access control
Row-level or data-level permissions
Single sign-on support
Audit logs
Approval workflows
Version control for reports
Centralized administration
Segmented access for departments, schools, districts, or regions
These controls are particularly relevant in healthcare, finance, manufacturing, and government settings. They also matter in education and state services environments, where users such as educators, teachers, test administrators, district leaders, and compliance teams may need access to different views of student, school, or program data.
A centralized reporting system used in these settings should make it easy to standardize outputs while maintaining strict access boundaries and traceable reporting activity.
Pricing and implementation factors that influence total cost of ownership
Software cost is only one part of the equation. Total cost of ownership also includes:
Some platforms look affordable at the entry level but become expensive once organizations need premium connectors, governance features, embedded analytics, or enterprise distribution. Others require more implementation effort upfront but deliver lower long-term reporting overhead.
For many reporting teams, the best value comes from a platform that reduces manual report production, shortens turnaround time, and improves trust in shared metrics. That is why it is important to evaluate not just subscription price, but how efficiently a centralized reporting system supports ongoing reporting operations.
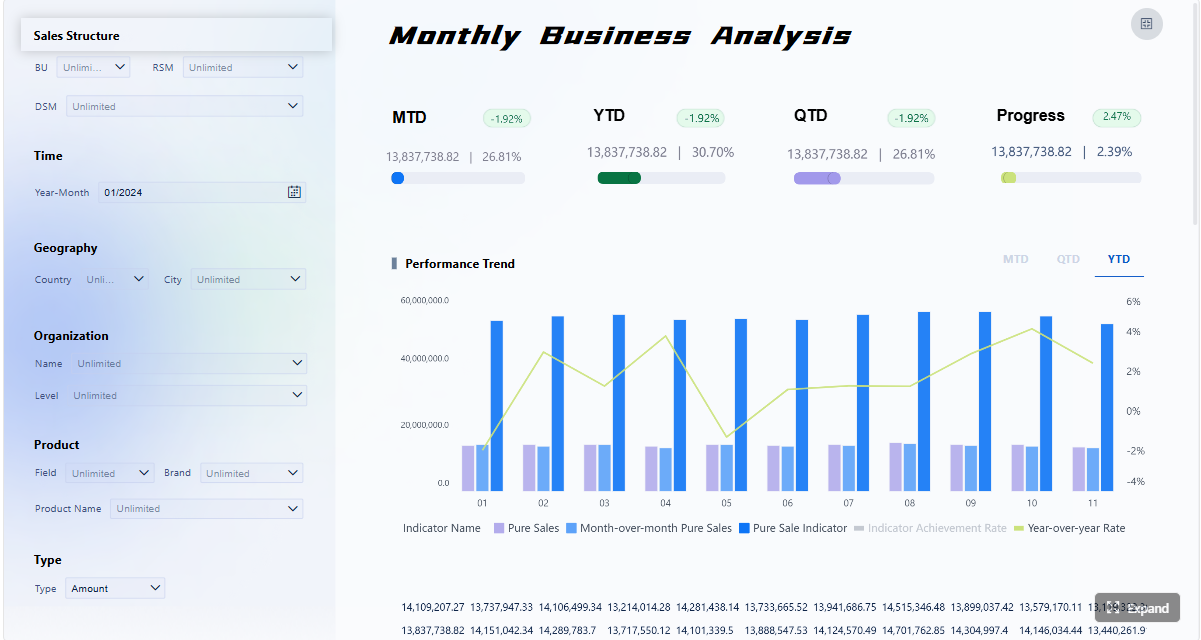
Click To Try The Dashboard
Features, pros, and cons that separate the best tools
Not every tool on the market solves the same problem. Some focus on dashboard exploration, while others are stronger in formatted enterprise reporting, centralized governance, or embedded analytics. The main differences usually appear in four areas.
Reporting and dashboard capabilities
The best centralized reporting system platforms support a mix of report types rather than a single style.
Important capabilities include:
Pixel-perfect reporting: Essential for invoices, board packs, compliance reports, and standardized documents
Ad hoc analysis: Helps users answer follow-up questions without waiting for analysts
Scheduled delivery: Supports automated email distribution, batch generation, and subscriptions
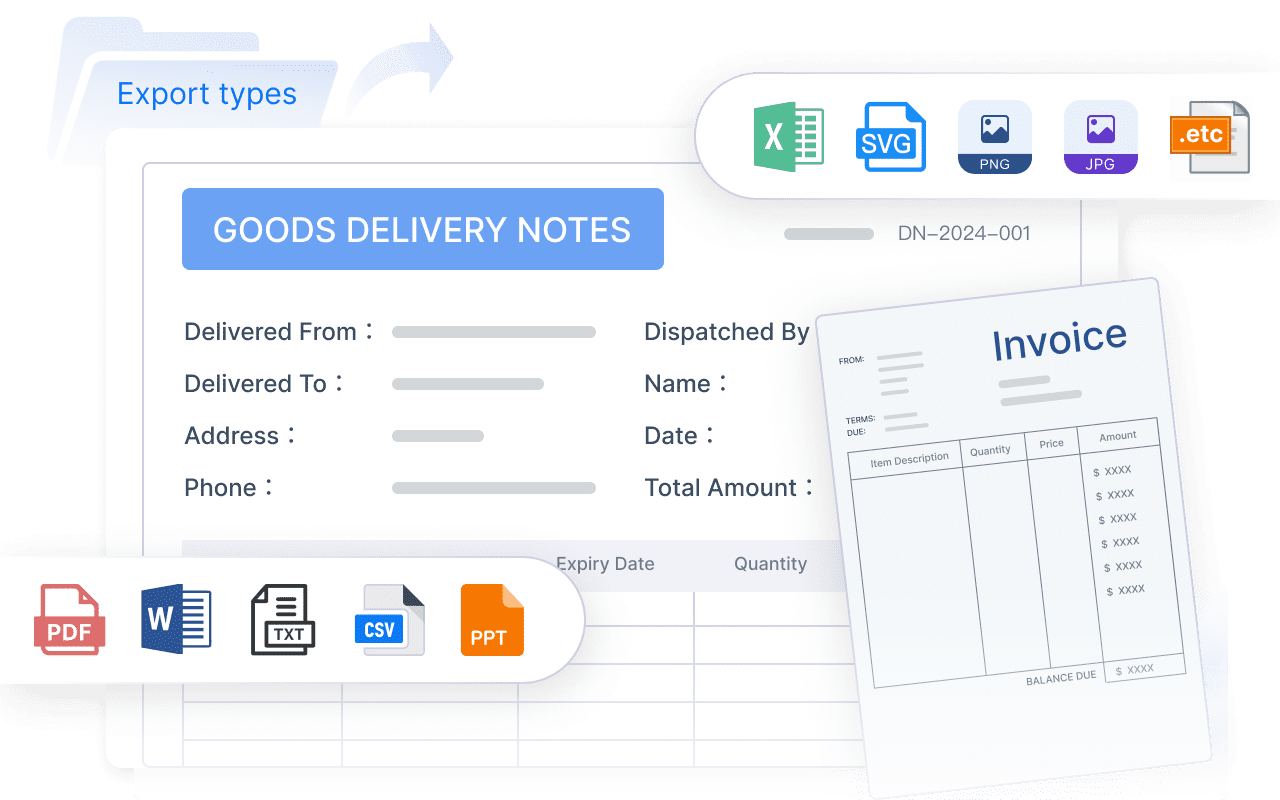
Export options: Critical when users need Excel, PDF, print-ready, or offline outputs
Interactive dashboards: Useful for management review and KPI monitoring
Power BI and Tableau are especially strong for interactive dashboards. IBM Cognos and FineReport are stronger where formal report layouts and scheduled distribution matter. Looker and Qlik Sense add value through governed exploration and flexible analytics.
Data integration and governance
A centralized reporting system becomes much more valuable when it consolidates fragmented data and enforces consistent definitions. Evaluate each platform on:
Number and quality of connectors
Support for cloud and on-premises data
Semantic modeling or governed metric layers
Role-based access control
Data lineage visibility
Auditability
Reusable datasets and templates
Looker is notable for semantic governance. Power BI offers mature governance when implemented well. FineReport is a strong option when organizations need integration flexibility paired with secure centralized report access.
Performance, scalability, and administration
Performance problems quickly undermine reporting adoption. Users expect fast load times, reliable refresh cycles, and stable access during peak periods. Consider:
Dataset size limits
Query performance
Refresh speed
Support for caching or in-memory acceleration
Deployment flexibility
Administration workload
Multi-user scalability
Qlik Sense often performs well for exploratory analysis because of its associative in-memory engine. Enterprise-focused platforms such as FineReport, Cognos, SAP Analytics Cloud, and Power BI generally offer better control over large-scale administration and scheduled reporting operations.
User experience and collaboration
The best centralized reporting system is not always the most technically advanced one. It is the one that users actually adopt. Key user experience considerations include:
Intuitive navigation
Search and report discovery
Sharing and subscriptions
Annotations and comments
Mobile accessibility
Workflow support
Low friction for non-technical users
Domo and Looker Studio are easy entry points for teams that prioritize quick access. Tableau performs well for visually driven analysis. FineReport can be especially effective when business users need stable, repeatable reporting outputs with clear permission structures rather than open-ended exploration.
Different industries define centralized reporting differently. Some need executive KPI alignment, while others need highly controlled score reporting, compliance workflows, or embedded customer reporting.
Enterprise BI and cross-department reporting
In large organizations, a centralized reporting system often serves multiple departments at once, including:
Finance
Sales
Operations
Procurement
HR
Executive leadership
These teams usually need a combination of dashboards, board-ready reports, and automated recurring distribution. The best-fit tools here are typically:
SAP Analytics Cloud: Best for SAP-centered organizations
If your reporting environment includes complex templates, recurring operational reports, and strict permissions, FineReport deserves a place high on the shortlist.
Education and public-sector reporting workflows
Education and state services environments have unique requirements. Reporting may involve scores, assessment outputs, district-level summaries, school comparisons, teacher access, and highly structured permissions. Users can include:
Clear access control by role and organization level
Audit trails
High-volume scheduled distribution
Consistency across districts or institutions
Secure handling of sensitive performance data
A centralized reporting system used in public-sector settings should also support repeatable workflows rather than relying entirely on self-service exploration. That is why enterprise reporting platforms with strong governance, such as FineReport, IBM Cognos Analytics, and Power BI, are often more practical than lightweight dashboard-only tools.
Embedded analytics and customer-facing reporting
When reporting needs to appear inside software products, portals, or partner environments, the priority shifts from internal BI to embedded delivery. Typical requirements include:
Sisense is often a top choice for developer-led teams. Looker is strong where governed metrics and cloud-native architecture matter. FineReport can be a good fit when embedded reporting must also preserve formal enterprise report layouts and centralized control.
SMB and mid-market reporting needs
Smaller teams usually need a centralized reporting system that is fast to deploy, cost-conscious, and manageable without a large BI department. Their priorities often include:
Ease of setup
Low training overhead
Core connectors
Affordable pricing
Dashboard and export basics
Limited administration burden
Good options include:
Zoho Analytics
Google Looker Studio
Domo
Power BI for Microsoft-based SMBs
That said, some mid-market organizations outgrow lightweight tools quickly. If reporting complexity is increasing, choosing a scalable platform early can reduce future migration costs.
How to choose the right tool for your organization
Choosing the best centralized reporting system requires more than comparing feature checklists. The right decision depends on your reporting complexity, data landscape, governance requirements, and user mix.
Match reporting needs to technical maturity, governance requirements, and budget
Start with your reporting reality, not vendor positioning. Ask:
Do you mainly need dashboards, formatted reports, or both?
How many departments will use the system?
Are reports operational, analytical, regulatory, or customer-facing?
Do you need strict access controls and audit trails?
How much in-house technical expertise do you have?
What budget constraints apply over one to three years?
If your organization depends on formal reports, centralized permissions, and repeatable report operations, a platform like FineReport may be a better fit than a dashboard-first tool.
Build a shortlist based on must-have integrations and user roles
Next, narrow the list based on hard requirements. These often include:
ERP and CRM integrations
Cloud warehouse support
Existing ecosystem alignment
SSO compatibility
Embedded use cases
User segmentation by department, region, or role
It also helps to map user groups. Executives, analysts, finance staff, field managers, educators, and administrators all use reports differently. A centralized reporting system should support those differences without fragmenting data definitions.
Run a proof of concept with real reporting scenarios and success criteria
A proof of concept should use real data and real reporting tasks. Do not rely on generic demo dashboards. Test:
Define success criteria in advance, such as report load time, design effort, data refresh reliability, and user satisfaction. This is often where differences between tools become clear.
Use a weighted comparison matrix to make the final decision
A weighted scorecard helps avoid subjective buying decisions. Rate each shortlisted centralized reporting system across categories such as:
For many organizations, the winning tool is not the one with the most features. It is the one that aligns best with how reporting actually happens across teams.
If your priority is dependable enterprise reporting with centralized control, flexible report design, and scalable deployment, FineReport is one of the most practical tools to evaluate in 2026.
FAQs
A centralized reporting system is a platform that gathers data from multiple sources and delivers standardized reports, dashboards, and scheduled outputs from one place. It helps organizations improve consistency, control access, and manage reporting at scale.
Key features usually include report design, dashboarding, scheduling, role-based permissions, data integration, and governed distribution. For enterprise use, auditability, scalability, and deployment flexibility are also important.
Centralized reporting focuses on controlled, standardized reports shared across teams with stronger governance and administration. Self-service BI is more oriented toward ad hoc exploration and user-driven analysis.
FineReport is a strong fit for enterprises that need pixel-perfect reports, secure report distribution, and support for complex multi-department reporting. It is especially suitable where governance, permissions, and formal reporting workflows matter.
The best choice depends on whether you prioritize formatted reporting, Microsoft ecosystem alignment, visual analytics, or governed metrics. FineReport is often better for formal enterprise reporting, while Power BI, Tableau, and Looker each stand out in analytics-focused scenarios.
Product Trial
FineReport
Pixel-perfect reports · Interactive dashboards · Easy data entry · Digital twins