FineReport is an enterprise-grade online reporting software platform designed for building pixel-perfect reports, dashboards, and data entry applications at scale.
Best online reporting software tools compared at a glance
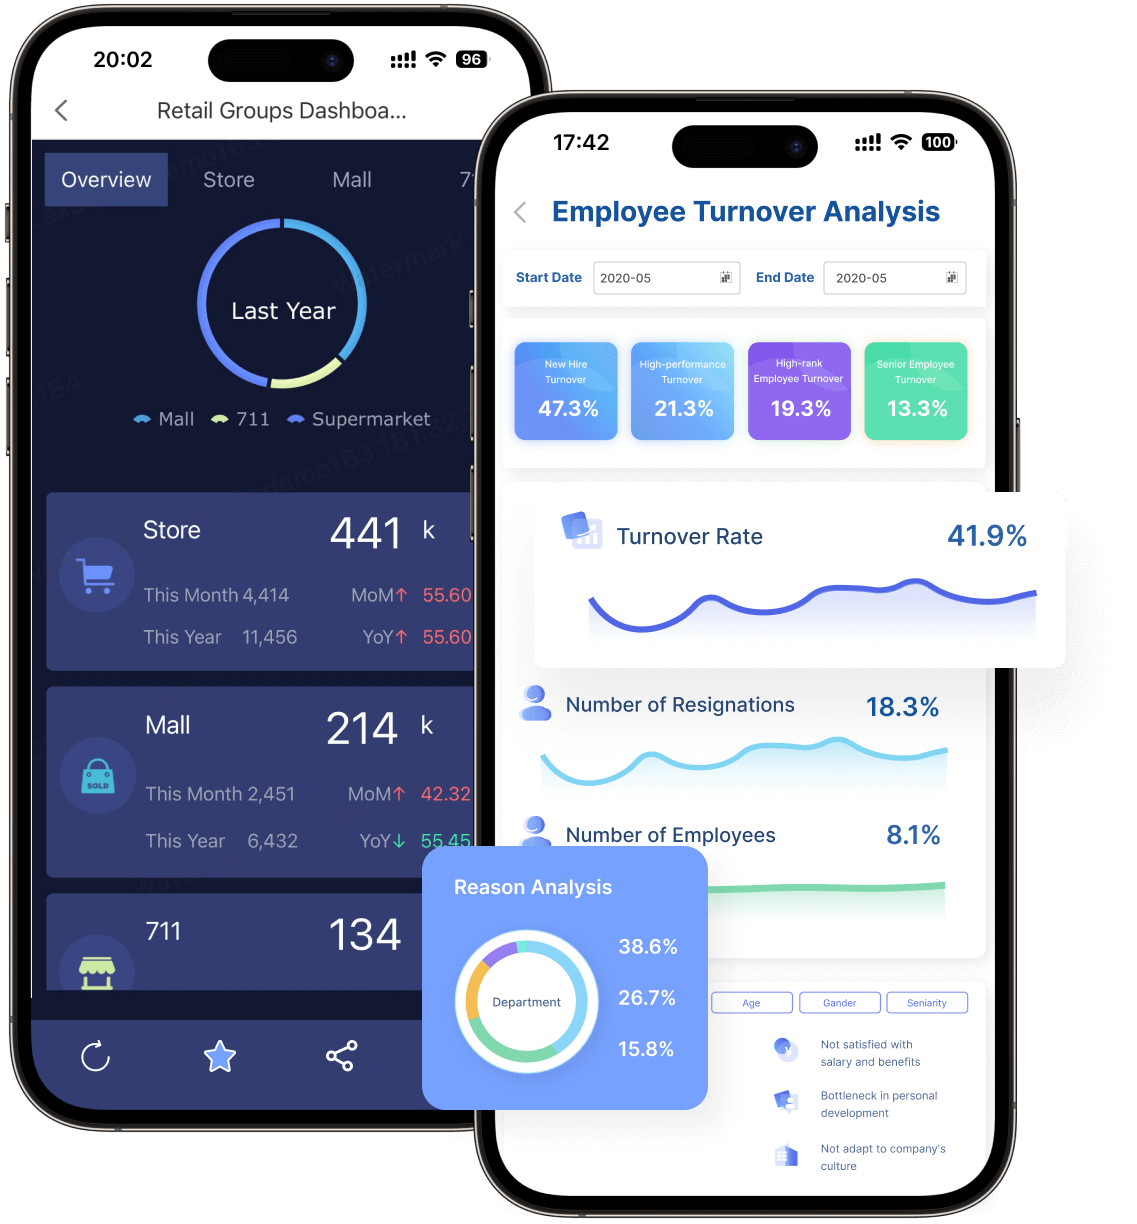
FineReport
One-sentence overview:FineReport is best for enterprises that need highly formatted reports, complex operational reporting, and controlled distribution across large teams.
Key Features
Pixel-perfect report design for invoices, statements, production sheets, and management packs
Strong support for complex tabular reports, print layouts, and multi-page exports
Broad data connectivity across databases, ERP, CRM, and business systems
Dashboard creation for real-time monitoring and executive reporting
Scheduling, permissions, parameterized reports, and mobile access
Embedded reporting and application-style deployment options
Pros & Cons
Pros: Excellent for formatted enterprise reports; strong for operational reporting; flexible layout control; suitable for large-scale deployment
Cons: More specialized than lightweight self-service tools; can require planning for full enterprise rollout
Best For
Large enterprises
Operations-heavy teams
Finance, manufacturing, logistics, and regulated industries
Organizations that need both dashboards and print-ready reporting
Power BI
One-sentence overview: Power BI is a strong choice for Microsoft-centric organizations that want scalable BI, dashboards, and online reporting software in one ecosystem.
Key Features
Deep integration with Excel, Teams, Azure, Fabric, and Microsoft 365
Large connector ecosystem and strong semantic modeling
Interactive dashboards, ad hoc analysis, and AI-assisted capabilities
Cons: Can be expensive at scale; formatted operational reporting is less central; governance may require deliberate setup
Best For
Data analysts
Business intelligence teams
Organizations prioritizing visual discovery over print-style reporting
Zoho Analytics and other notable options
Zoho Analytics
One-sentence overview: Zoho Analytics is a practical option for budget-conscious teams that need broad business reporting and self-service dashboarding.
Key Features
Cloud-based report builder with many business connectors
Self-service dashboards and charting
AI-assisted query and insight features
Collaboration, embedding, and scheduled sharing
Accessible pricing for smaller teams
Pros & Cons
Pros: Affordable; easy to adopt; good breadth for general reporting
Cons: Less suited to very complex enterprise reporting workflows; advanced governance may be lighter than heavyweight platforms
Best For
SMBs
Departmental analytics teams
Businesses seeking lower upfront cost
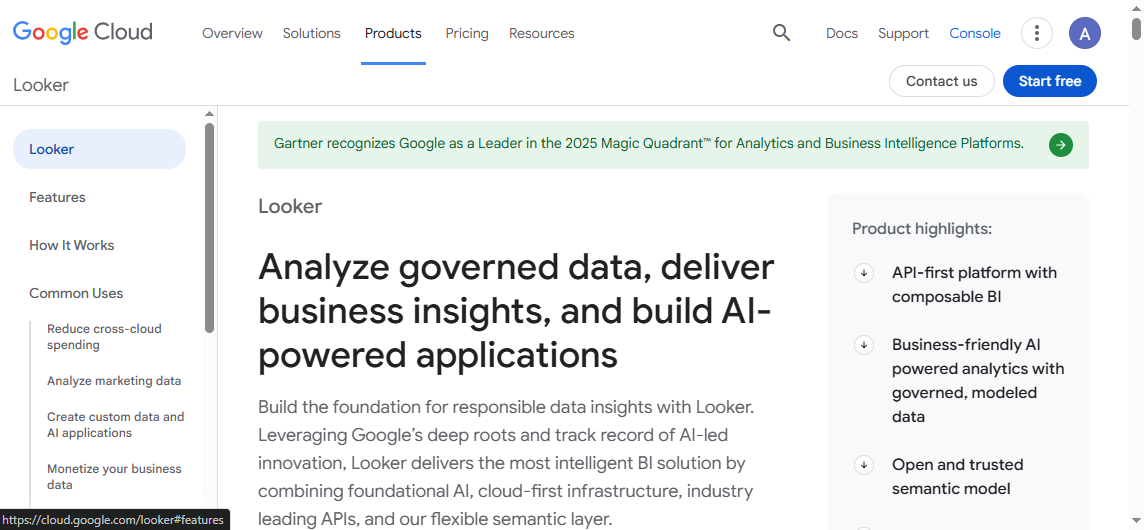
Looker
One-sentence overview: Looker is best for organizations that want governed metrics, semantic modeling, and centralized business logic.
Teams with established formatted report dependencies
What to look for in online reporting software in 2026
Choosing online reporting software in 2026 is no longer just about charts and exports. Most teams now need a blend of self-service analytics, operational reporting, governance, and secure data access across cloud and on-premise systems. The right platform depends on how your organization balances usability with control.
Ease of use: Can business users build or modify reports without depending on IT for every change?
Dashboard flexibility: Does the platform support both interactive dashboards and formal reports?
Data connectivity: Can it connect to cloud apps, data warehouses, spreadsheets, APIs, and legacy databases?
Governance: Are role-based permissions, auditability, version control, and data security built in?
Scalability: Will it perform well as users, reports, and data volumes grow?
Total cost of ownership: Consider licenses, implementation time, training, infrastructure, and support.
A tool that looks inexpensive at first can become costly if it requires constant technical intervention. Likewise, a powerful enterprise platform can deliver better long-term ROI if reporting is mission-critical.
Executives need dashboards and summary reports for fast decision-making.
Analysts need ad hoc exploration, drill-downs, and flexible visualizations.
Operations teams need scheduled reports, exception alerts, and daily process monitoring.
Finance teams need accurate, formatted, auditable reports with controlled access.
Product and SaaS teams need embedded reporting for customers and partners.
This is where platform fit matters. FineReport, for example, is especially strong when reporting needs extend beyond dashboards into operational forms, pixel-perfect reports, and high-volume business distribution.
Better for compliance, standardized metrics, and security
Often requires stronger admin oversight
Can slow down initial deployment
Implementation speed
Lightweight tools can launch quickly
Enterprise platforms may take longer but support broader use cases over time
The key is to align the tool with your reporting reality. If you need controlled board reports, scheduled finance packs, and operational documents, enterprise reporting depth matters more than casual dashboard simplicity.
In-depth comparison of 12 reporting tools for better insights in 2026
Metabase, Domo, and Sisense
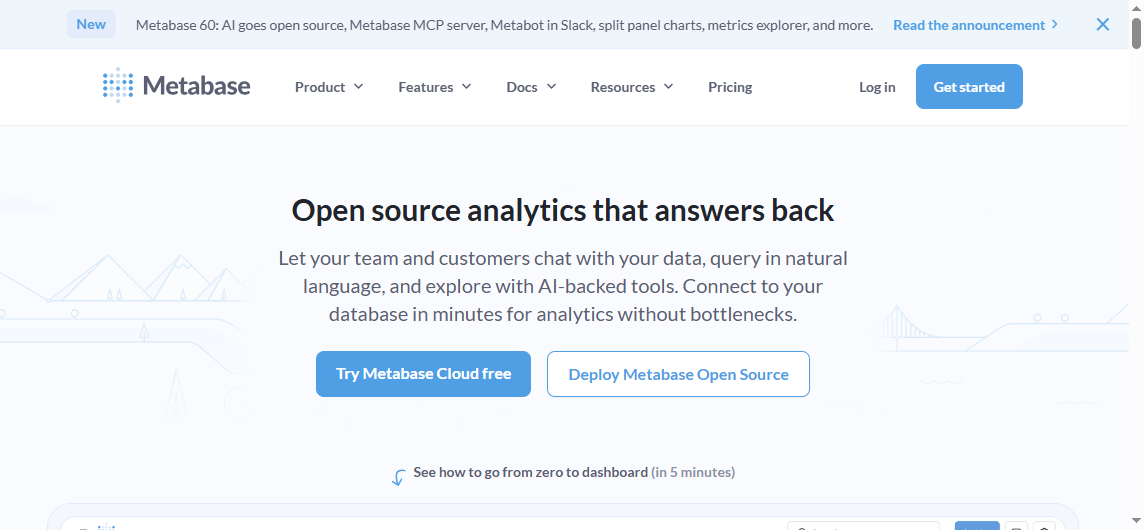
Metabase
One-sentence overview: Metabase is a strong open-source and low-cost reporting option for internal teams that want fast setup and straightforward analytics.
One-sentence overview: IBM Cognos Analytics is a governed enterprise reporting platform suited to large organizations with structured planning and compliance needs.
Power BI: Strong governance, especially with Microsoft ecosystem integrations
Tableau: Good governance, though standardization often depends on implementation discipline
Zoho Analytics: Adequate for many business teams, but less enterprise-heavy than some larger platforms
Mobile access
All four provide mobile-friendly access, but usability depends on report design. FineReport and Power BI are commonly chosen where business users need both dashboard consumption and distributed reporting across devices.
Power BI: Strong via embedded offerings, especially for Microsoft-based environments
Tableau: Suitable for embedding, especially dashboard experiences
Zoho Analytics: Useful for lighter embedded and shared analytics use cases
Pros and cons by business scenario
Best choice for highly formatted reports
FineReport is the strongest option if your business relies on complex layouts, multi-band reports, forms, print-ready outputs, or operational documents. This is where many dashboard-first tools fall short.
Best choice for self-service dashboards
Power BI is often the best fit for organizations that want broad self-service analytics at scale, particularly if users are already comfortable with Microsoft tools.
Best choice for executive visibility and visual exploration
Tableau remains one of the top choices for interactive visual storytelling, executive presentation, and deep exploratory analysis.
Best choice for budget-conscious business reporting
Zoho Analytics is often the most practical choice for smaller teams that need capable cloud reporting without enterprise-grade complexity or cost.
Which tool is the best reporting software for your team?
Choose Power BI if you want scalable BI and reporting inside a Microsoft-first ecosystem.
Choose Tableau if your priority is advanced visual analytics and exploratory dashboards.
Choose Zoho Analytics if you need affordable online reporting software for general business use.
For many enterprises, FineReport stands out because it covers a gap that dashboard-led tools often leave open: complex, production-grade reporting that still needs modern web delivery, permissions, and scalable management.
What to expect from Metabase, Power BI Free, and limited-tier products
Metabase: One of the best low-cost and open-source choices for internal analytics and lightweight reporting
Power BI Free: Useful for individual analysis, but collaboration and enterprise sharing usually require paid plans
Zoho Analytics lower tiers: Good for budget-conscious departments, though advanced scale and governance may require higher plans
Low-cost tools can be excellent starting points, but growing organizations often outgrow them when reporting volume, compliance needs, or formatting complexity increases.
Final recommendation shortlist
If you want a quick shortlist of the best online reporting software in 2026, here is the practical summary:
If your organization needs more than basic dashboards, FineReport deserves serious consideration. It is especially well suited for enterprises that need online reporting software capable of handling pixel-perfect layouts, operational workflows, secure distribution, and scalable reporting governance in one platform.
FAQs
For enterprise reporting, the best choice usually depends on whether you need pixel-perfect documents, interactive dashboards, or governed analytics. FineReport stands out for highly formatted operational reports, while Power BI and Tableau are stronger for broader BI and visual analysis.
Choose FineReport if you need print-ready, highly structured reports at scale. Choose Power BI if your business is deeply invested in Microsoft, and choose Tableau if interactive data exploration and visual storytelling are your top priorities.
Zoho Analytics is a strong fit for smaller teams that want affordable cloud reporting and self-service dashboards. Other budget-friendly options may work too, but Zoho is often easier to adopt for general business reporting.
The most important features usually include data connectors, dashboarding, scheduled delivery, permissions, and export options. If you need operational or regulated reporting, formatting control and print layout support become especially important.
Yes, many online reporting platforms support embedded analytics for customer portals, internal systems, or SaaS products. FineReport, Power BI, Looker, and several others offer embedding options, though the setup and flexibility vary by platform.
Product Trial
FineReport
Pixel-perfect reports · Interactive dashboards · Easy data entry · Digital twins