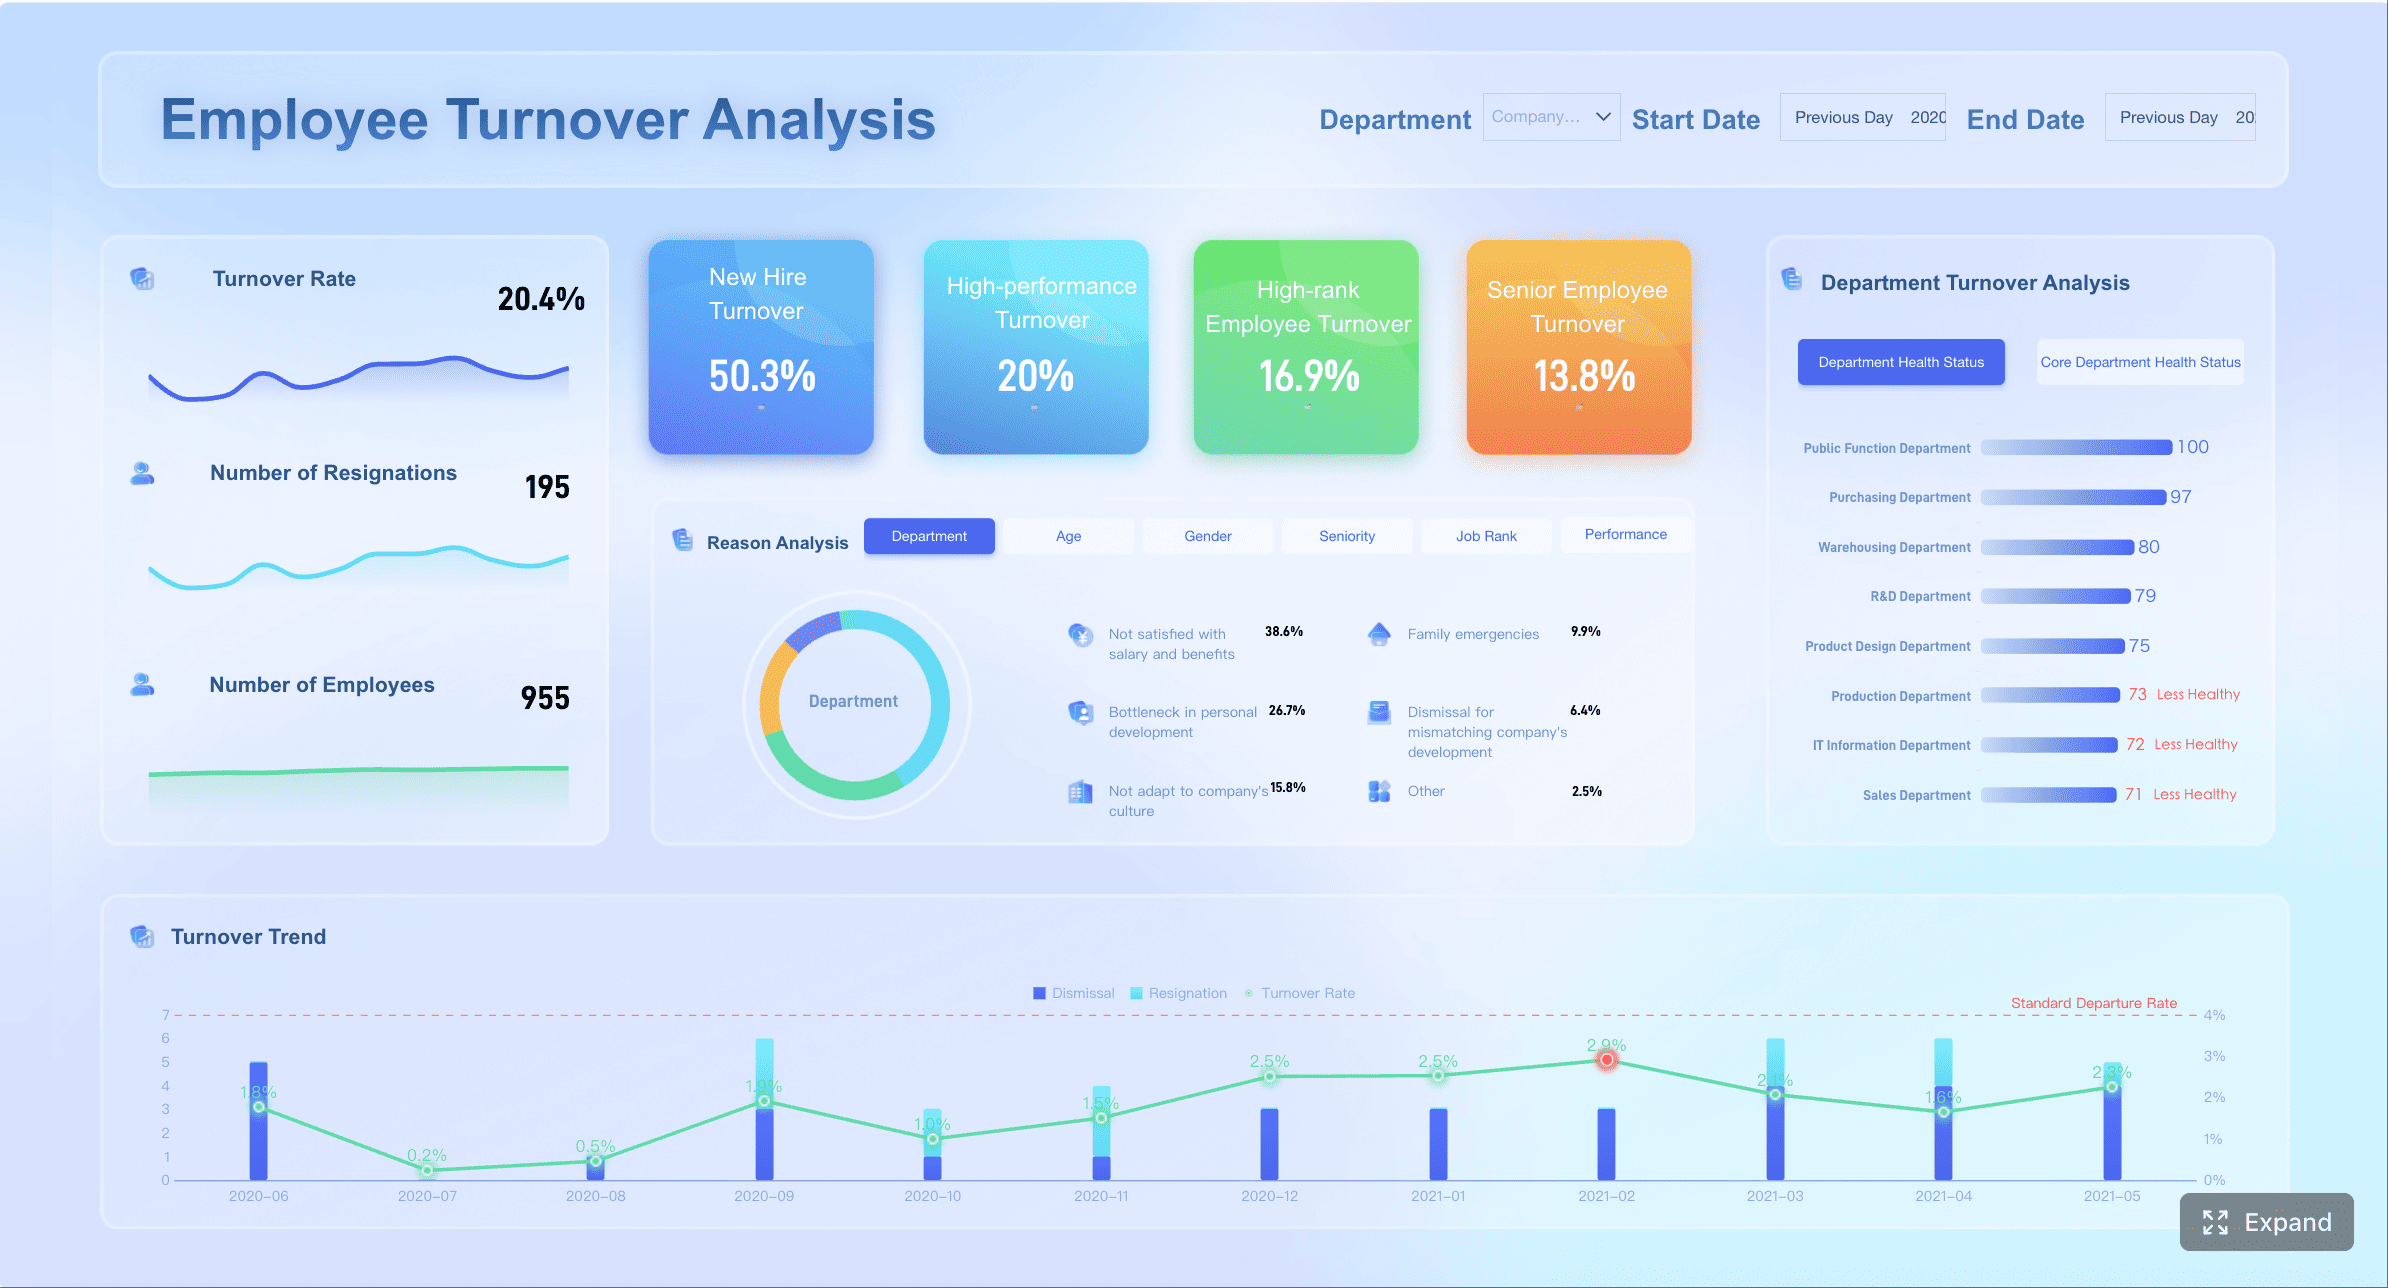
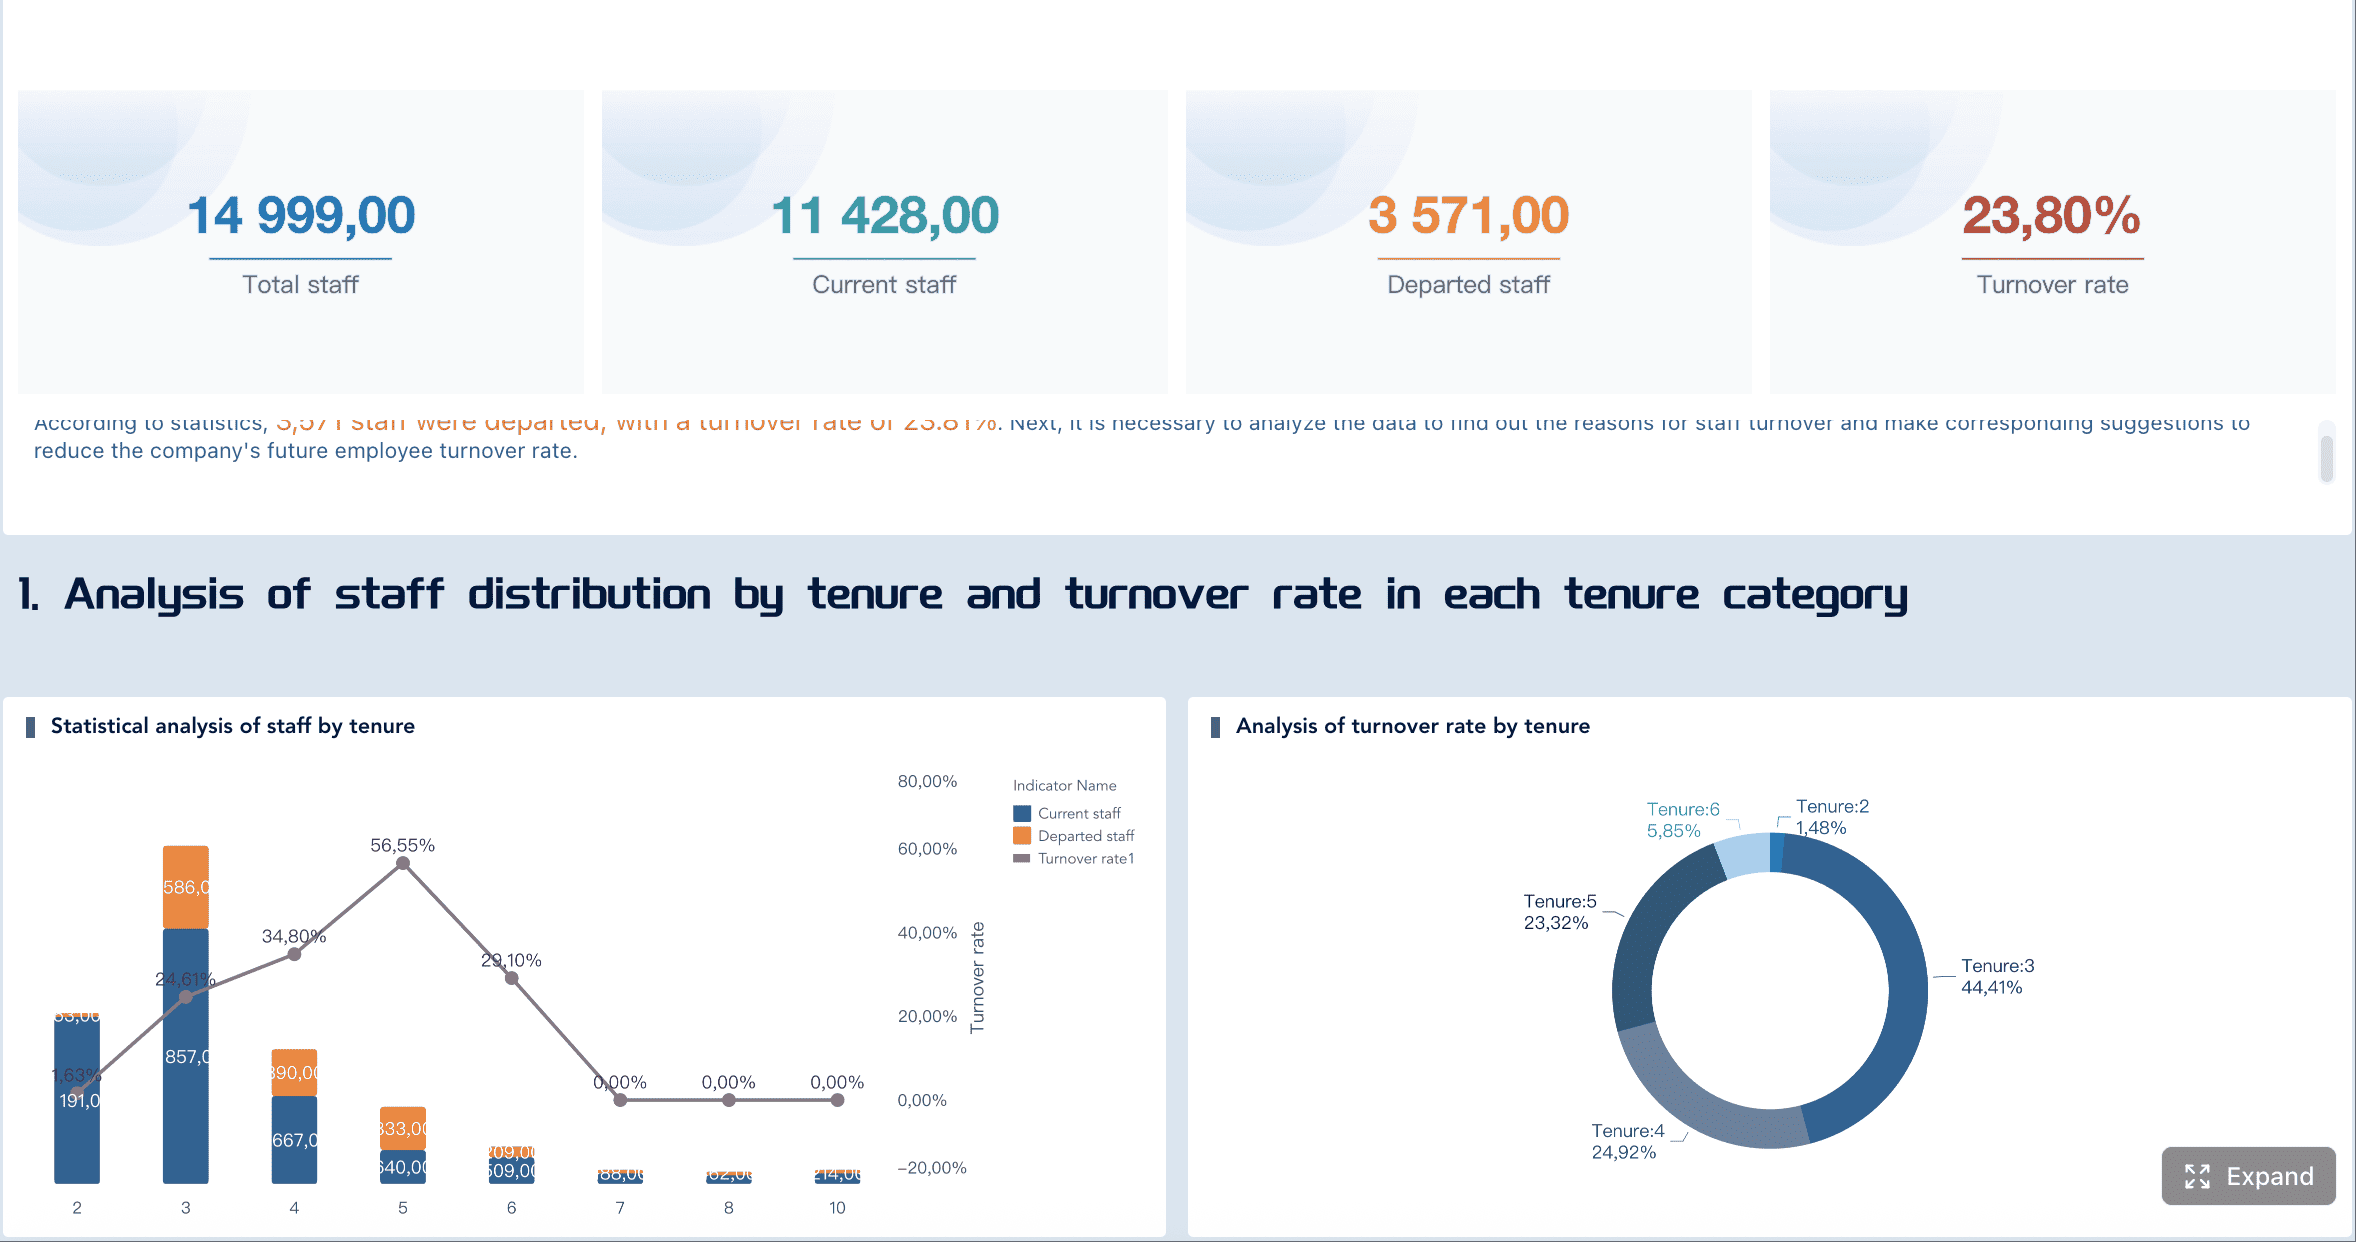
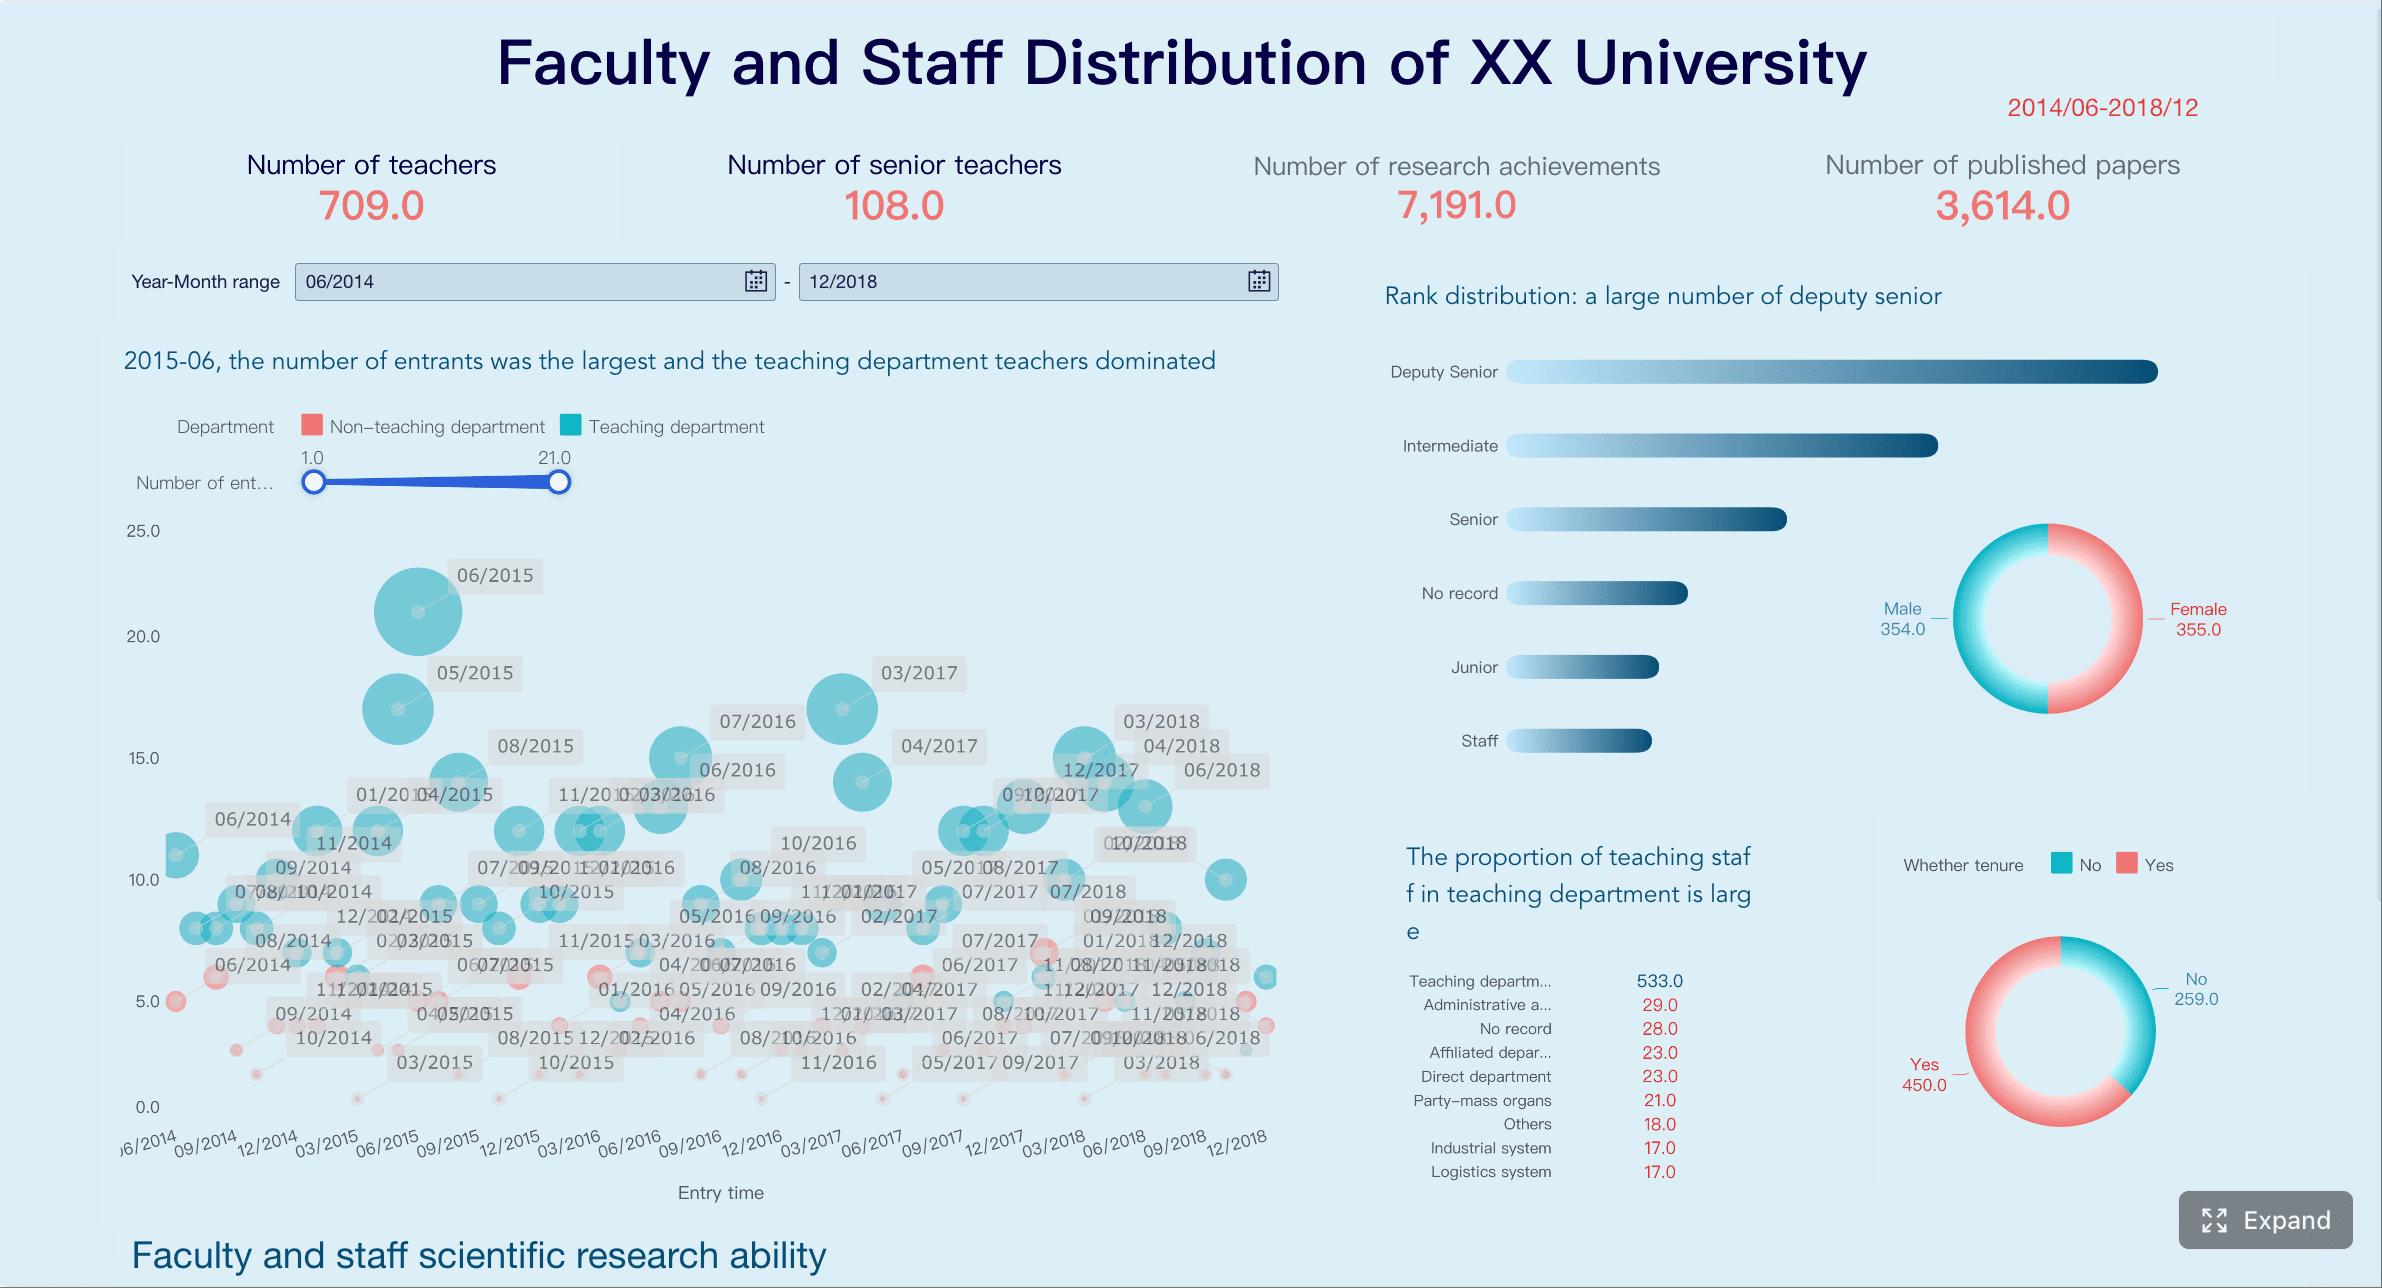
An hr report turns scattered workforce data into decisions leaders can act on. For HR managers, people analysts, and operations leaders, the challenge is rarely access to data alone—it is turning raw exports from HRIS, payroll, ATS, surveys, and performance tools into a clear story about hiring, retention, workforce risk, and business impact. A strong report helps stakeholders answer practical questions fast: Where are we losing talent? Are we hiring efficiently? Which teams need attention? What action should leaders take next?
All reports in this article are built with FineReport.
An hr report is a structured summary of workforce data designed to support a specific business decision. It is not just a list of employee numbers. It should help the audience understand what changed, why it changed, and what to do next. That means the best reports are built around decisions such as workforce planning, cost control, talent acquisition improvement, retention risk reduction, or board oversight.
Raw data matters because every conclusion in an HR report depends on source quality. If payroll records use one department structure, the ATS uses another, and exit reasons are entered inconsistently, the final report will confuse more than clarify. Reliable reporting starts with clean, consistent, well-defined data.
There is also a critical difference between raw HR data, metrics, and executive-ready insights:
Raw HR data: Unprocessed records such as employee IDs, hire dates, salary values, leave days, and application statuses.
Metrics: Calculated measures such as turnover rate, time to hire, absenteeism rate, or training completion rate.
Insights: Interpretation of what the metrics mean, such as rising turnover in one business unit after manager changes or longer time to fill in technical roles due to sourcing bottlenecks.
A monthly HR report is typically used for operational monitoring. A quarterly report is better for trend analysis and department reviews. An annual report supports strategy, budgeting, and long-term workforce planning. A board-facing report should be shorter, higher level, and focused on risk, compliance, leadership pipeline, and strategic talent implications.
Key Metrics (KPIs) for an HR Report
Below are the most common KPIs used in a high-value hr report:
Headcount: Total number of active employees in the reporting period.
Net headcount change: Growth or reduction after hires, exits, and internal transfers.
Turnover rate: Percentage of employees who left during a period.
Retention rate: Percentage of employees who stayed over a defined time frame.
Time to fill: Days required to fill an open role from approval to accepted offer.
Time to hire: Days from candidate application or first contact to offer acceptance.
Offer acceptance rate: Percentage of offers accepted by candidates.
Absenteeism rate: Share of work time lost due to unscheduled absence.
Internal mobility rate: Percentage of employees changing roles, levels, or departments internally.
Diversity mix: Representation across gender, age, ethnicity, or other approved workforce categories.
Training completion rate: Percentage of required or planned learning completed.
Performance distribution: Breakdown of employee ratings or review outcomes.
Labor cost or payroll trend: Movement in compensation cost over time.
Engagement score: Employee sentiment indicator from survey data.
Vacancy rate: Percentage of approved positions currently unfilled.
How to Turn Raw Data Into an HR Report Step by Step
Step 1: Define the audience and reporting goal
Start by deciding who the report is for. This determines the language, level of detail, and metrics you include. An HR leadership team may want deeper operational analysis. Department managers often need team-level actions. Executives want trends, risks, and business impact. The board needs only the most decision-relevant information.
Next, define the main question the report must answer. Examples include:
Why has turnover increased this quarter?
Are we hiring fast enough to support growth?
Which business units show the highest retention risk?
Are diversity goals progressing as planned?
Where are labor costs rising faster than expected?
A report without a central question becomes a data dump. A report with a clear goal becomes a decision tool.
Step 2: Gather and clean your source data
Pull data from the systems that matter most to the reporting objective. In most organizations, this includes:
HRIS for employee records and organizational structure
Payroll for compensation and labor cost data
ATS for recruitment funnel and hiring performance
Engagement tools for employee feedback and sentiment
Performance systems for review outcomes and talent calibration
Learning platforms for training participation and completion
Before analysis, clean the data carefully. Look for:
Missing values in key fields like department, manager, or hire date
Inconsistent time periods across systems
Duplicate employee or candidate records
Outdated entries that should be archived or excluded
Mismatched definitions such as voluntary vs. total turnover
Status errors, such as terminated employees still marked active
This is where many HR reports fail. Stakeholders lose trust quickly if the headcount in one page does not match the headcount in another.
Step 3: Choose the right HR metrics and report sections
Choose metrics based on the reporting goal, not because they are available. If the goal is retention, then turnover, tenure bands, exit reasons, internal mobility, manager-level patterns, and engagement trends matter more than training hours. If the goal is recruitment efficiency, focus on time to fill, source effectiveness, offer acceptance, and funnel conversion.
A practical report usually works best when grouped into sections such as:
Executive summary
Workforce snapshot
Hiring and recruitment
Retention and employee movement
Attendance, performance, or learning
Key risks and recommendations
Keep the flow logical. Start broad, then move into the detailed metrics that explain the overall picture.
Step 4: Analyze trends and turn numbers into insights
This is the point where reporting becomes valuable. Compare current results with:
Previous months, quarters, or years
Targets or internal plan values
Department or business-unit averages
Relevant benchmarks where available
Look for patterns, outliers, and likely causes. For example:
Turnover rose from 12% to 18% in one quarter, but only in customer support
Time to fill remains stable overall, but technical roles have slowed sharply
Absenteeism increased after shift changes in one location
Offer acceptance dropped where salary bands are below market midpoint
Training completion is high, but performance improvement is limited in one group
Insights should answer three things:
What changed?
Why does it matter?
What is likely driving it?
That makes the report useful to both HR and business leaders.
Step 5: Write findings, recommendations, and next steps
Your final write-up should be concise and decision-oriented. Summarize the headline changes first, then explain the business implication, then recommend the next action.
A simple formula works well:
Finding: Voluntary turnover in sales increased by 5 points quarter over quarter.
Implication: Revenue continuity and pipeline coverage may be at risk.
Recommendation: Review manager span, variable pay competitiveness, and first-year attrition by region within 30 days.
Avoid vague commentary. Leaders do not need a paragraph describing every chart. They need a clear message attached to each important metric.
What to Include in a Strong HR Report
A strong hr report balances consistency, relevance, and interpretability. It should be easy for the reader to scan while still giving enough detail to support action.
Core sections every report should cover
Most reports should include the following core elements:
Reporting period: State the exact month, quarter, or year covered.
Scope: Clarify which business units, regions, or employee populations are included.
Data sources: Identify whether the report uses HRIS, ATS, payroll, survey, or other systems.
Key definitions: Define important metrics like turnover, active employee, and time to fill.
Executive summary: Highlight the biggest changes and business implications.
Metric breakdowns: Present the core KPIs by time period, team, role, or location.
Trend commentary: Explain movement, comparisons, and likely causes.
Recommended actions: State what leaders should do next.
Common HR report types and examples
Different HR report types serve different decision needs.
Workforce and headcount reporting
This report tracks total employees, new hires, exits, transfers, and demographic mix. It is useful for workforce planning, budgeting, and org design reviews.
Recruitment and hiring performance
This report focuses on open requisitions, time to fill, source quality, funnel conversion, and offer acceptance. It helps talent acquisition leaders optimize hiring speed and efficiency.
Retention, turnover, and employee movement
This report shows voluntary and involuntary turnover, retention by tenure, internal mobility, and exit trends. It is often one of the most strategic reports because it highlights capability and continuity risk.
Compensation, attendance, performance, and learning updates
These reports track payroll movement, overtime, leave, absenteeism, performance ratings, promotion rates, training completion, and learning outcomes. They help HR connect people management to productivity and cost control.
What to include in an HR report to the board
A board report should be concise, strategic, and highly selective. Board members usually do not need department-level operational detail. They need visibility into talent-related business risk.
Focus on:
High-level workforce risks
Leadership bench strength and talent pipeline
Compliance or policy issues
Critical hiring constraints
Retention concerns in key roles
Diversity and workforce sustainability indicators
Strategic priorities and actions underway
Keep the narrative short. Include only the most decision-relevant metrics and explain their implications clearly.
HR Report Example Outline You Can Follow
If you need a practical starting structure, use the outline below for your next hr report.
Executive summary
In one short paragraph, summarize the most important changes, risks, and opportunities from the reporting period. This section should help an executive understand the report in less than a minute.
Example:
Headcount grew 3% this quarter, driven by hiring in operations and customer success. However, voluntary turnover increased in sales and first-year attrition remains elevated in two regions. Time to fill improved overall, but technical hiring continues to lag target by 12 days. Immediate focus should be placed on sales manager effectiveness, technical sourcing channels, and early-tenure retention actions.
Workforce snapshot
Include a high-level view of:
Headcount
New hires
Exits
Internal moves
Demographic mix
Department or region breakdown
This section gives readers context before they interpret more detailed metrics.
Hiring and retention metrics
This section should include the KPIs most tied to talent flow:
Use comparisons across periods and teams to highlight where intervention is needed most.
Key insights and recommended actions
End the report with a short list of takeaways. Focus on root causes and next steps, not just observations.
Example actions:
Review compensation competitiveness for hard-to-fill technical roles
Audit first-year manager experience in regions with high attrition
Simplify interview stages in roles with low offer acceptance
Increase internal mobility visibility for high-potential talent pools
Common Mistakes to Avoid When Writing an HR Report
Even experienced teams weaken an hr report by overloading it with data or skipping interpretation. Avoid these common mistakes:
Including too many metrics without a clear story: More data does not make a better report.
Reporting numbers without context: Every key metric should include comparison, target, or interpretation.
Using inconsistent definitions: If turnover or headcount rules change, trend lines become misleading.
Making the report too detailed for executives or the board: Senior audiences want implications, not raw operational logs.
Hiding data quality issues: It is better to disclose limitations than present false precision.
Using complex visuals that slow understanding: Simpler charts usually improve decision speed.
Tips for Making Your HR Report Clear, Useful, and Repeatable
A repeatable reporting process saves time and improves trust over time. These best practices are what I recommend in enterprise HR reporting environments.
1. Build a standard reporting template
Use the same structure every cycle. Keep sections, metric definitions, and chart types as stable as possible. This makes trend analysis easier and reduces stakeholder confusion.
2. Tie every chart to a business question
Do not add charts because they look impressive. Every visual should answer a practical question such as:
Are we growing in the right areas?
Where is retention risk rising?
Which hiring channels are underperforming?
Are workforce costs aligned with plan?
3. Add definitions for sensitive or complex metrics
Metrics like regrettable attrition, diversity representation, and performance distribution often require careful definition. Add brief notes so readers interpret them correctly.
4. Review with stakeholders before finalizing
A draft review with HR leaders, finance, or department heads can catch interpretation issues early. It also increases adoption because stakeholders feel aligned before the report is published.
5. Automate recurring data flows where possible
Manual spreadsheet work slows reporting, increases errors, and limits how often teams can update insights. If your HR data comes from multiple systems, dashboard automation can dramatically improve reliability and speed.
After the methodology is in place, the next step is enabling it consistently across systems and stakeholders.
How FineReport Helps You Build Better HR Reports Faster
If your team is still assembling every hr report manually, the real bottleneck is not analysis skill alone—it is reporting infrastructure. FineReport helps HR and business teams turn raw data into executive-ready dashboards, scheduled reports, and board-level summaries without rebuilding the process each cycle.
For enterprise decision-makers, this matters because reporting quality shapes decision quality. When leaders trust the numbers and understand the story quickly, they act faster and with more confidence.
A well-built HR report should do three things every time:
Show what changed
Explain why it matters
Recommend what happens next
That is exactly where FineReport becomes the enabler—not just as a dashboard tool, but as a reporting framework that makes workforce data usable at scale.
Whether you are building a monthly operational report, a quarterly talent review, or a board-facing workforce summary, the goal is the same: move from raw data to trusted action.
An effective HR report should include a clear reporting goal, trusted source data, key workforce metrics, trend comparisons, and a short explanation of what the numbers mean. It should also end with actions or recommendations for the intended audience.
Start by defining the audience and business question, then gather, clean, and standardize data from systems like HRIS, payroll, and ATS. After that, calculate the right KPIs, analyze trends, and present the findings in a simple narrative.
The most useful metrics usually include headcount, turnover, retention, time to fill, absenteeism, labor cost, and diversity trends. The right mix depends on whether the report is for operations, executives, or board-level decisions.
Monthly reports are best for routine monitoring, quarterly reports work well for trend analysis, and annual reports support planning and strategy. The reporting cadence should match how quickly leaders need to make decisions.
Common mistakes include using inconsistent definitions, pulling data from mismatched time periods, showing too many metrics, and failing to explain the business impact. A report also loses credibility quickly when numbers do not match across pages or systems.
Product Trial
FineReport
Pixel-perfect reports · Interactive dashboards · Easy data entry · Digital twins