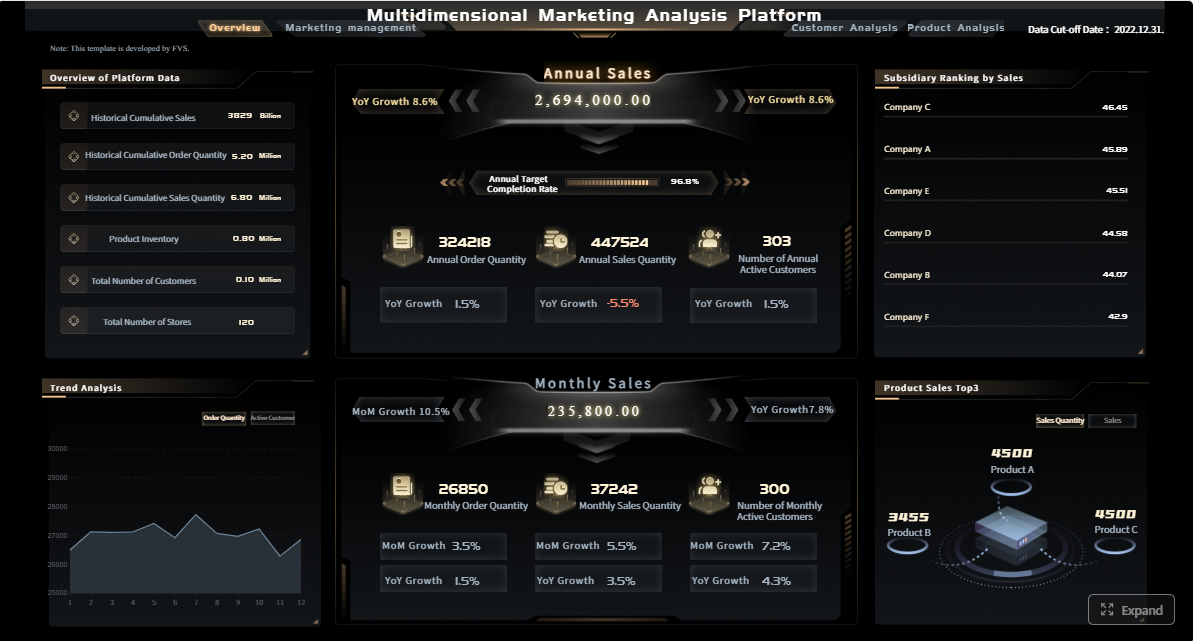
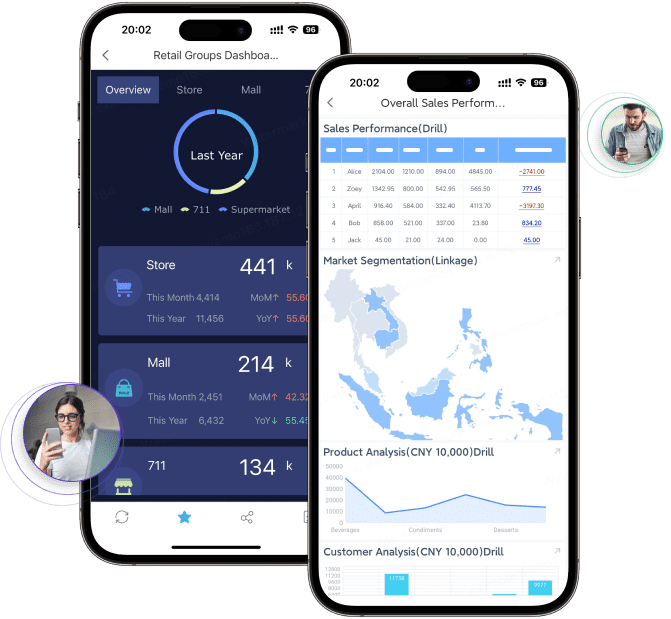
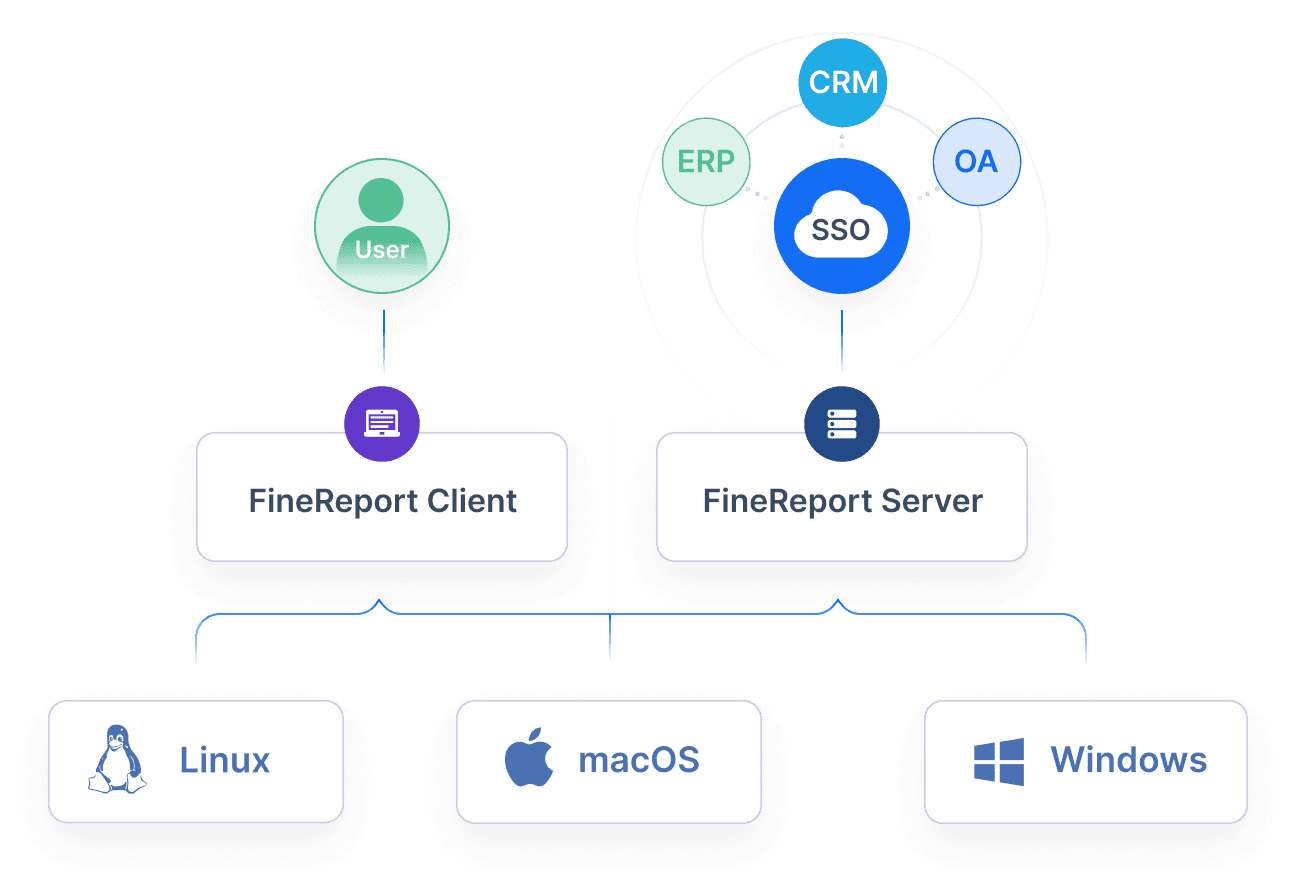
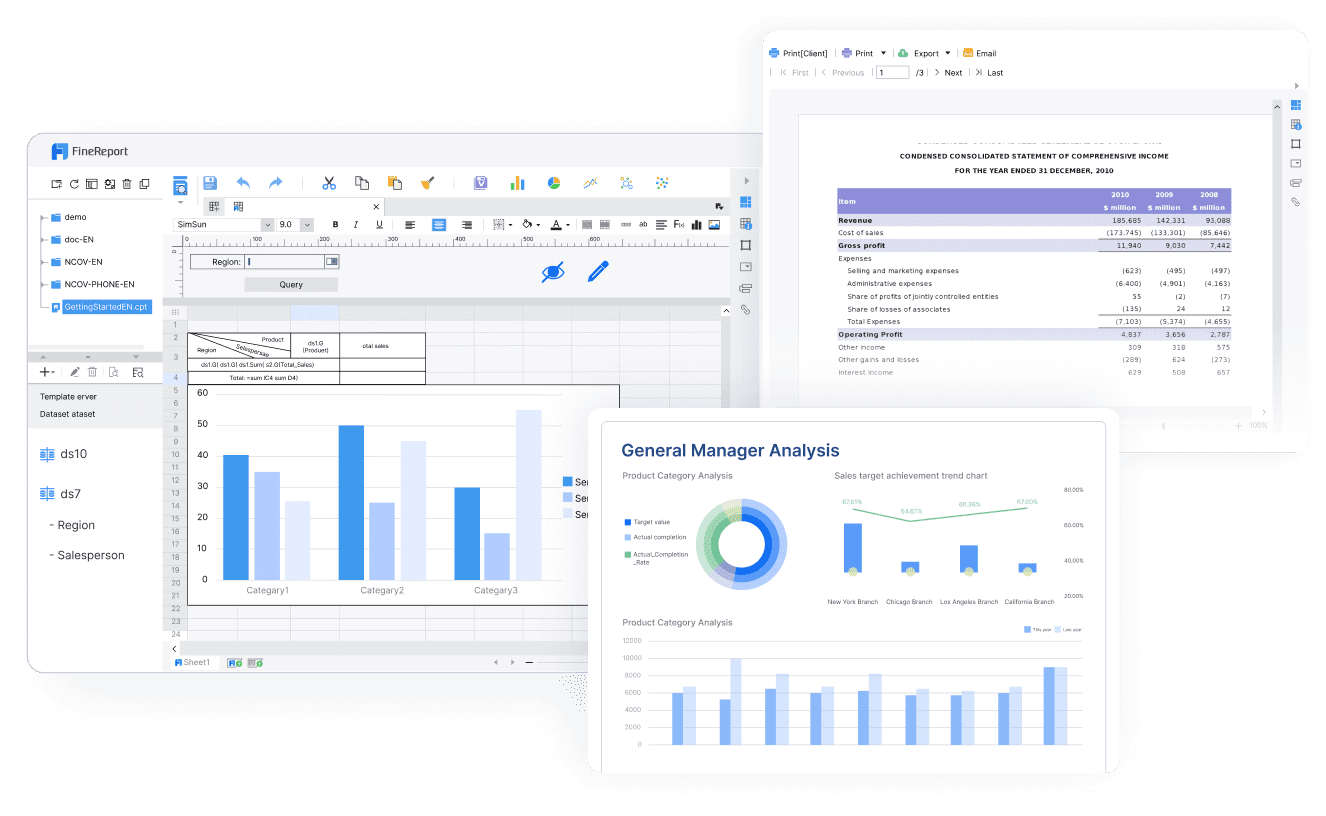
Enterprise marketing teams rarely struggle because they lack data. They struggle because performance data lives across paid media platforms, web analytics tools, CRM systems, email platforms, social channels, and offline sources—each with different definitions, refresh cycles, and attribution logic. A strong cross channel analytics report template solves that problem by turning fragmented marketing activity into one governed reporting view that leaders can trust.
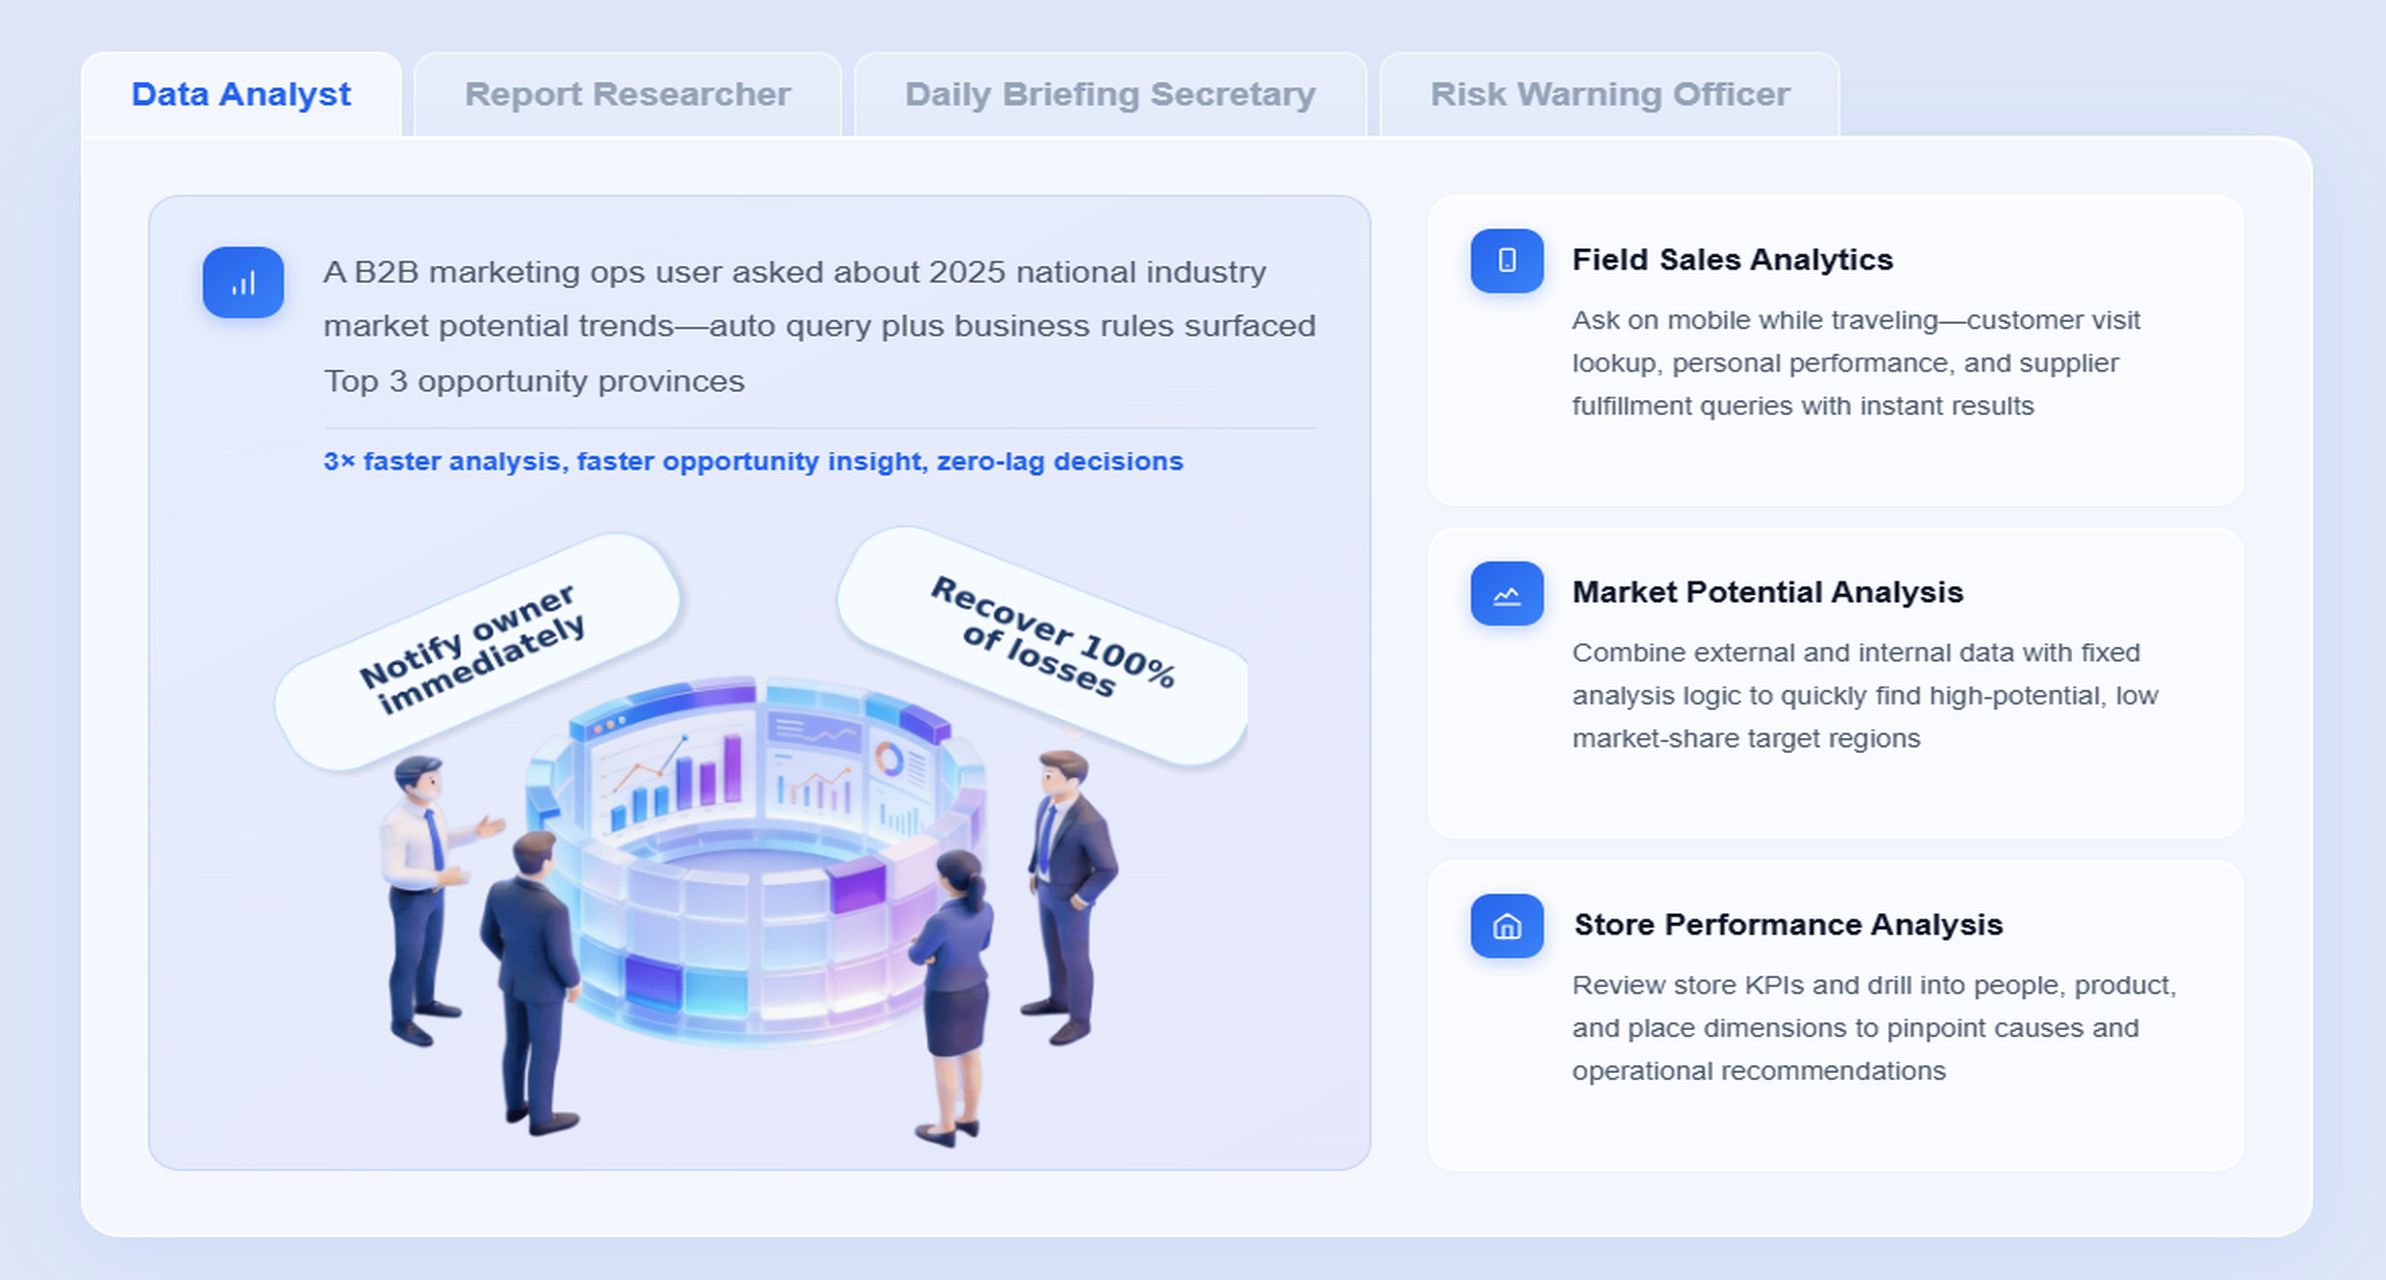
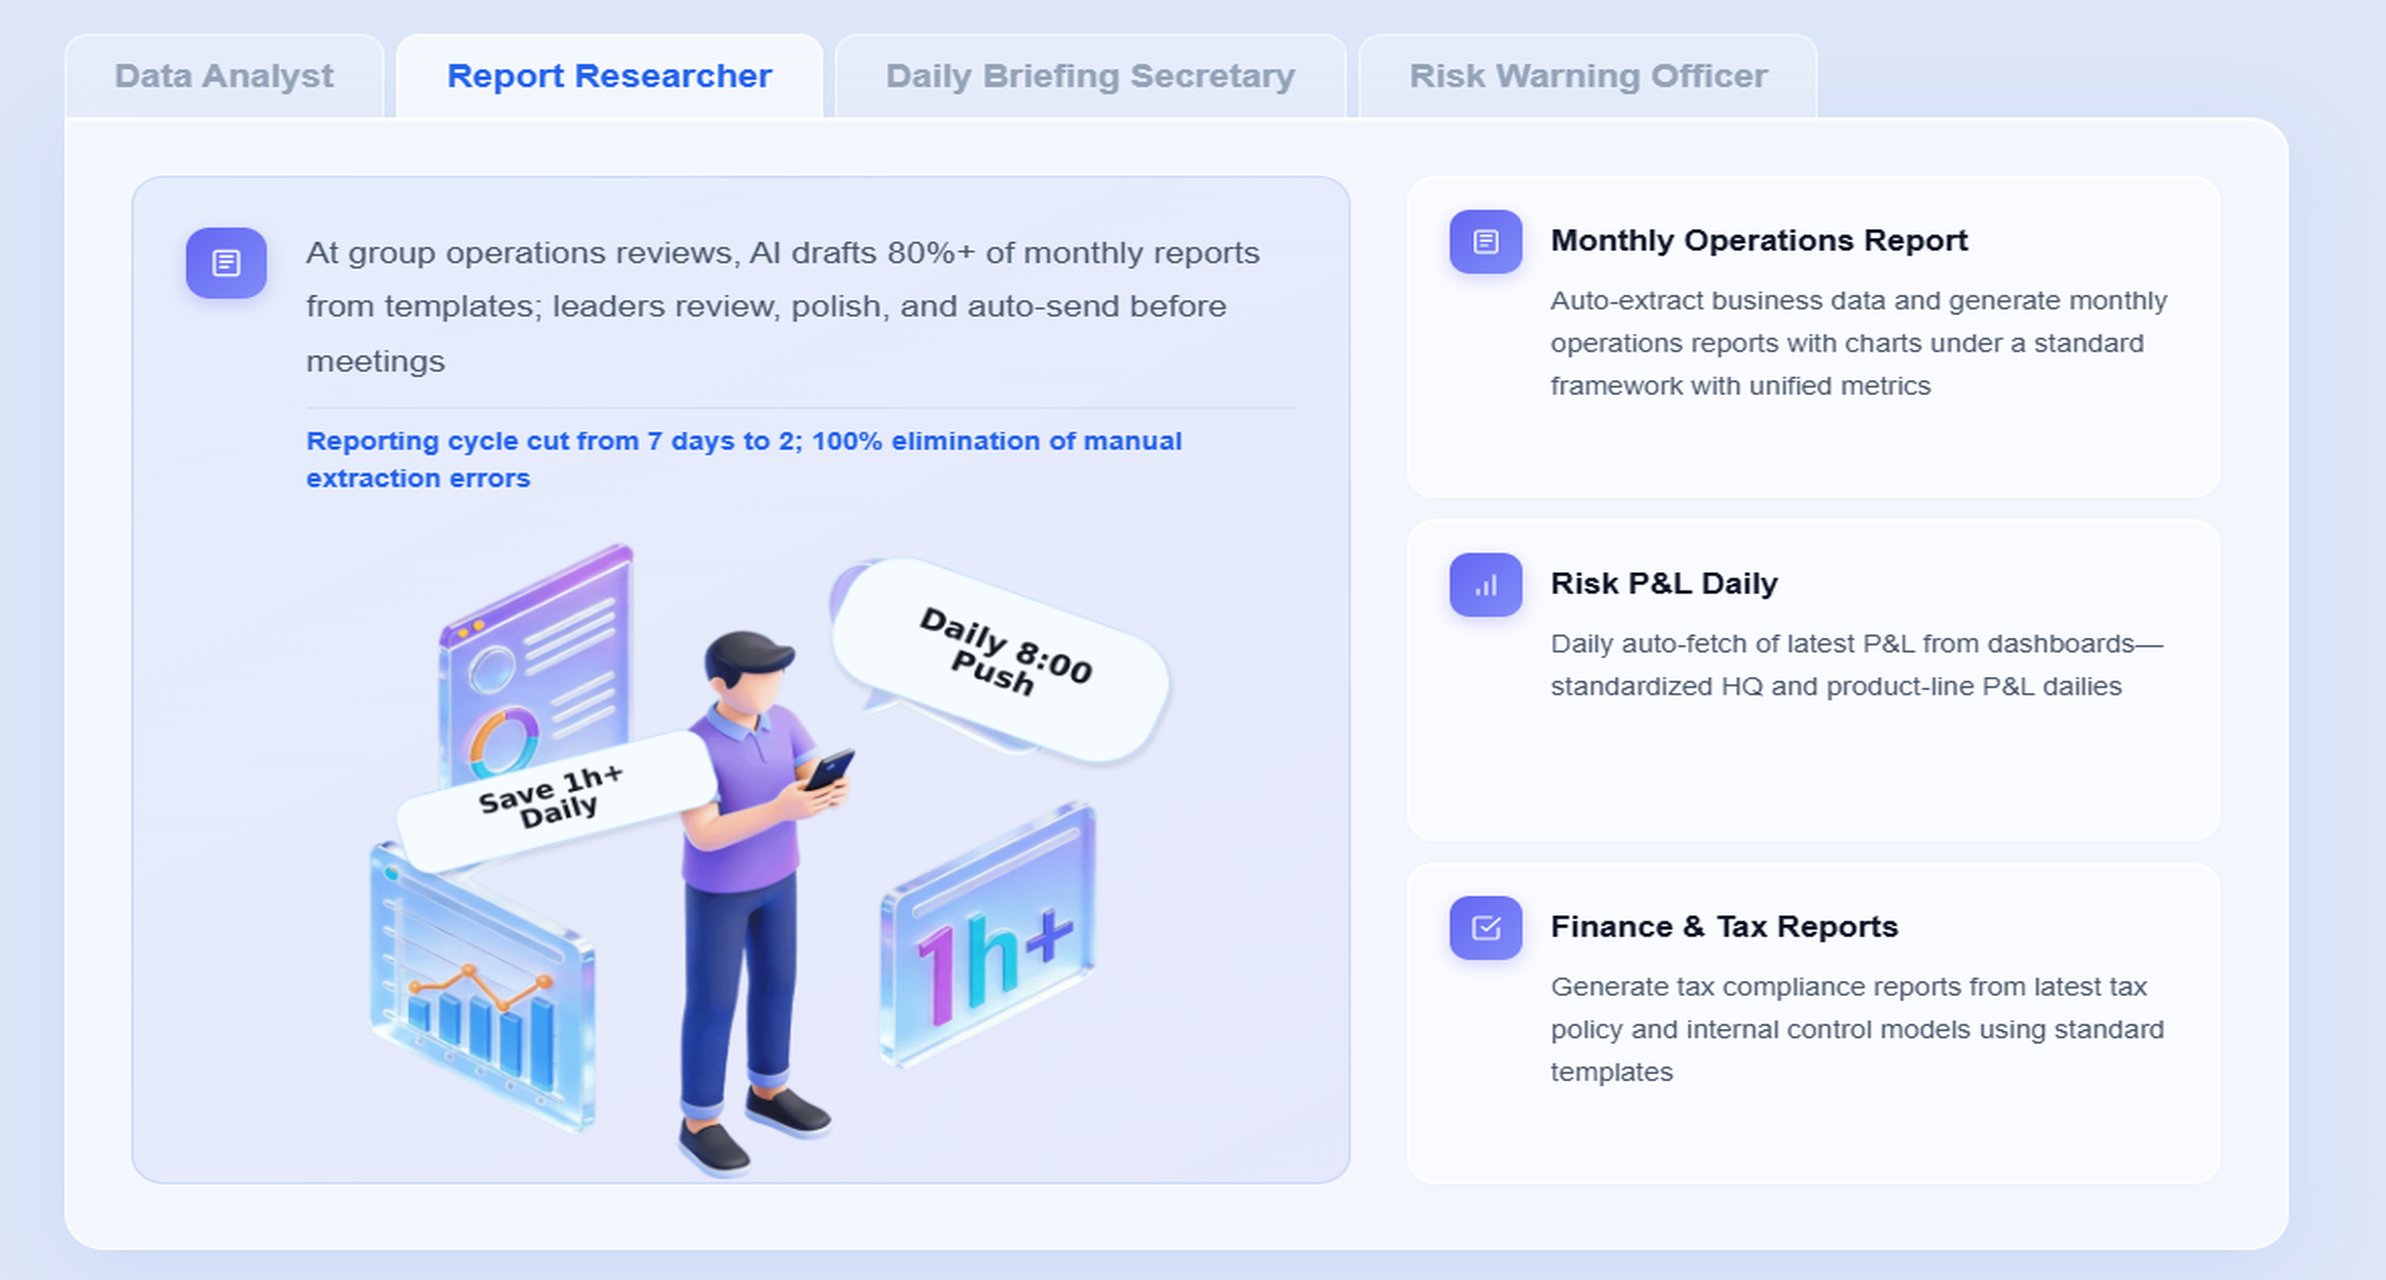
The real upgrade is not just consolidating dashboards. It is making that reporting workflow easier to consume, explain, and act on. With FineReport + Dora, teams can ask for a report summary in chat, generate structured narratives from trusted report assets, receive scheduled briefings, and push exceptions to the right owner.
Click To Try The Dashboard
All reports in this article are built with FineReport
What a Cross Channel Analytics Report Template Should Include
A useful cross channel analytics report template does more than place metrics from multiple platforms on one screen. It should answer the business questions leadership actually asks:
Which channels generate pipeline and revenue?
Where is budget being wasted?
Which campaigns drive efficient conversions?
How do regions, teams, and segments differ?
What needs follow-up this week or month?
For enterprise teams, the report also needs governance. That means consistent KPI definitions, agreed attribution rules, and controlled access to sensitive data.
Define the report’s purpose, business questions, and executive audience
Before building any template, define what decision the report supports. A CMO, regional marketing director, and channel manager do not need the same view.
Report Element: Report purpose Definition: The decision the report is meant to support, such as budget allocation, campaign optimization, or board-level performance review. Business value: Keeps the template focused on useful outcomes instead of reporting every available metric. AI use:Dora can generate a structured report summary aligned to the intended audience, such as an executive narrative for leadership or a deeper analytical explanation for channel owners.
Report Element: Executive audience definition Definition: The stakeholder group consuming the report, including executives, regional leaders, campaign managers, or analysts. Business value: Prevents overloading leaders with operational detail while ensuring analysts still have enough drill-down support. AI use:Dora can tailor the summary language, level of detail, and follow-up prompts based on the user role and permission scope defined in FineReport.
Identify the channels, campaigns, regions, and teams the template needs to cover
Cross-channel reporting breaks down quickly when scope is vague. Enterprise marketing teams usually need to align by:
paid search
paid social
organic search
organic social
email
website and landing pages
CRM pipeline stages
regional markets
business units
product lines
agency or in-house team ownership
Report Element: Scope coverage matrix Definition: The list of channels, campaigns, geographies, brands, and teams included in the report. Business value: Ensures the template can support enterprise segmentation and avoids missing critical business lines. AI use:Dora can retrieve the relevant slice of a FineReport dashboard and answer role-specific questions such as, “Show APAC paid media efficiency versus EMEA for Q2.”
Standardize the core metrics, attribution logic, and reporting cadence
A cross channel analytics report template only becomes reliable when metric definitions are standardized. For example, “conversion,” “lead,” and “qualified pipeline” often mean different things in different systems. The same issue appears in attribution windows and source-of-truth decisions.
Report Element: Core KPI definitions Definition: Agreed formulas for revenue, leads, MQLs, opportunities, cost, ROI, CAC, ROAS, and conversion rate. Business value: Makes channel comparisons valid and reduces reporting disputes. AI use:Dora can explain KPI logic in chat using the governed semantic layer from FineReport, helping users understand why a number appears the way it does.
Report Element: Attribution model and window Definition: The rules for assigning credit across touchpoints, such as first-touch, last-touch, linear, or data-driven attribution. Business value: Prevents misleading conclusions when channels play different roles in the customer journey. AI use:Dora can summarize how attribution rules affect reported outcomes and flag when users compare numbers across inconsistent models.
Report Element: Reporting cadence Definition: Daily, weekly, monthly, or quarterly refresh and review schedule. Business value: Aligns the report with operational and management routines. AI use:Dora’s Daily Briefing Secretary can push scheduled summaries, weekly highlights, and month-end briefing notes based on the latest FineReport assets.
Decide which sections belong in an executive summary versus detailed analysis
Enterprise reports work best when they separate fast decision-making content from deeper investigation views.
Report Element: Executive summary section Definition: A concise view of top KPIs, material changes, risks, and recommended actions. Business value: Lets leadership understand the business position in minutes. AI use:Dora can generate a board-ready management narrative from FineReport charts, metrics, and exception lists.
Report Element: Detailed analysis section Definition: Supporting tabs or views with campaign, channel, audience, funnel, and regional drill-downs. Business value: Helps analysts and managers investigate root causes without cluttering the top page. AI use:Dora can answer follow-up questions in chat and link back to the exact FineReport report section for validation.
Setting up a cross channel analytics report template at enterprise scale is part reporting design, part governance project, and part operational workflow. The steps below help ensure the template can actually be used repeatedly.
Align stakeholders on reporting goals and ownership
A cross-channel report often fails before the first dashboard is built because ownership is unclear. Different teams contribute different pieces:
paid media teams provide campaign and cost data
web analytics teams validate site behavior and conversions
CRM or sales ops teams confirm lead and pipeline status
regional teams explain local campaign context
finance may validate spend and ROI logic
executives use the final summary for strategic decisions
Clarify who contributes data, who validates it, and who uses the final report
Map responsibilities early:
Data contributors: Platform owners and system admins
Validators: Analysts, marketing ops, sales ops, finance, or BI teams
Consumers: Executives, regional directors, campaign leads, and operations teams
This matters because report accuracy is not only a technical issue. It is also a process issue.
FineReport helps formalize this structure by supporting governed report templates, formatted reports, distribution workflows, and operational cockpits. On top of that foundation, Dora can act as a scenario-specific AI assistant for report consumption, so users do not need to manually inspect every tab before meetings.
Set rules for naming conventions, campaign taxonomy, and governance
A template is only as good as the campaign taxonomy behind it. Standardize:
campaign naming rules
channel naming
region and market tags
funnel stage labels
source-medium mapping
product and brand hierarchies
ownership fields
Without this, channel comparisons become unreliable and AI summaries become less useful.
For IT and marketing operations teams, this is where the role shifts in the AI era: not manually assembling every report every cycle, but strengthening data connections, taxonomy discipline, semantic rules, and permission governance so AI-driven reporting can land in a controlled way.
Choose data sources and connect channels
A mature cross channel analytics report template should pull from the systems that represent the customer journey and business outcome, not only media platforms.
Map data inputs from paid media, organic social, CRM, web analytics, email, and offline sources
Typical enterprise inputs include:
Google Ads, Microsoft Ads, Meta Ads, LinkedIn Ads, TikTok Ads
GA4 or other web analytics tools
CRM and marketing automation platforms
email platforms
social content performance systems
SEO/search visibility sources
call center, retail, event, or distributor data where relevant
internal finance or ERP data for cost and revenue reconciliation
FineReport is well suited here because it can serve as the reporting foundation across varied enterprise data sources, while supporting formatted reports, dashboards, management reports, and operational cockpits in one governed framework.
Note integration limits, refresh schedules, and source-of-truth decisions
Not all systems update at the same speed, and not all metrics should be treated equally. Define:
refresh frequency by source
known API or platform limitations
trusted owner for each KPI
source of truth for spend, revenue, leads, and opportunities
reconciliation rules for mismatches
These details should be documented directly in the reporting process, not left as tribal knowledge.
Build the reporting structure and dashboard views
Once goals and data inputs are agreed, build the actual report layout.
Create sections for performance overview, channel comparison, campaign breakdown, funnel performance, and trends over time
A practical enterprise layout often looks like this:
Performance overview: Total spend, leads, pipeline, revenue, ROI, and key changes
Channel comparison: Side-by-side efficiency and contribution by channel
Campaign breakdown: Best and worst performers by objective, product, or geography
Funnel performance: Traffic to lead to opportunity to revenue progression
Trends over time: Weekly or monthly movement and seasonality
Exception list: Underperforming campaigns, budget pacing issues, or missing data
Action queue: Suggested follow-up owners and next steps
Report Element: Performance overview Definition: The top page showing the organization’s most important cross-channel results. Business value: Gives leadership a fast, shared view of marketing effectiveness. AI use:Dora can summarize the top movement drivers, explain chart changes, and prepare pre-meeting briefing notes.
Report Element: Channel comparison Definition: A view comparing channel-level spend, conversions, efficiency, and contribution. Business value: Supports budget reallocation and portfolio optimization. AI use:Dora can answer questions like, “Which two channels had the best assisted conversion efficiency this month?”
Report Element: Funnel performance Definition: A stage-by-stage view from impressions and clicks through leads, opportunities, and revenue. Business value: Reveals where customer journey leakage happens. AI use:Dora can highlight abnormal drop-offs and escalate them through a governed AI workflow.
Separate executive-facing summaries from analyst-level tabs or supporting views
Executives need concise direction. Analysts need the evidence and filters behind it. FineReport makes this separation practical by allowing teams to build role-specific dashboards and formatted outputs while preserving a governed data foundation underneath.
That separation also improves AI usability. Dora works better when it can pull from trusted, role-appropriate report assets rather than forcing one overloaded dashboard to serve everyone.
Validate accuracy and automate recurring delivery
A cross channel analytics report template becomes valuable when it is repeatable. Repeatability depends on testing, governance, and delivery automation.
Check metric definitions, attribution windows, and duplicate records before rollout
Before going live, validate:
metric formulas
attribution windows
duplicate lead or customer records
missing UTM or campaign tags
mismatched date ranges
conflicting currency or regional settings
campaign hierarchy consistency
This validation step is essential if the report will later support AI summaries. Dora can only be as reliable as the governed metrics and report assets it is allowed to use.
Automate updates, access permissions, and stakeholder distribution
Automation should include:
scheduled data refresh
recurring report distribution
role-based access
export and presentation views
alert thresholds for anomalies
stakeholder subscriptions
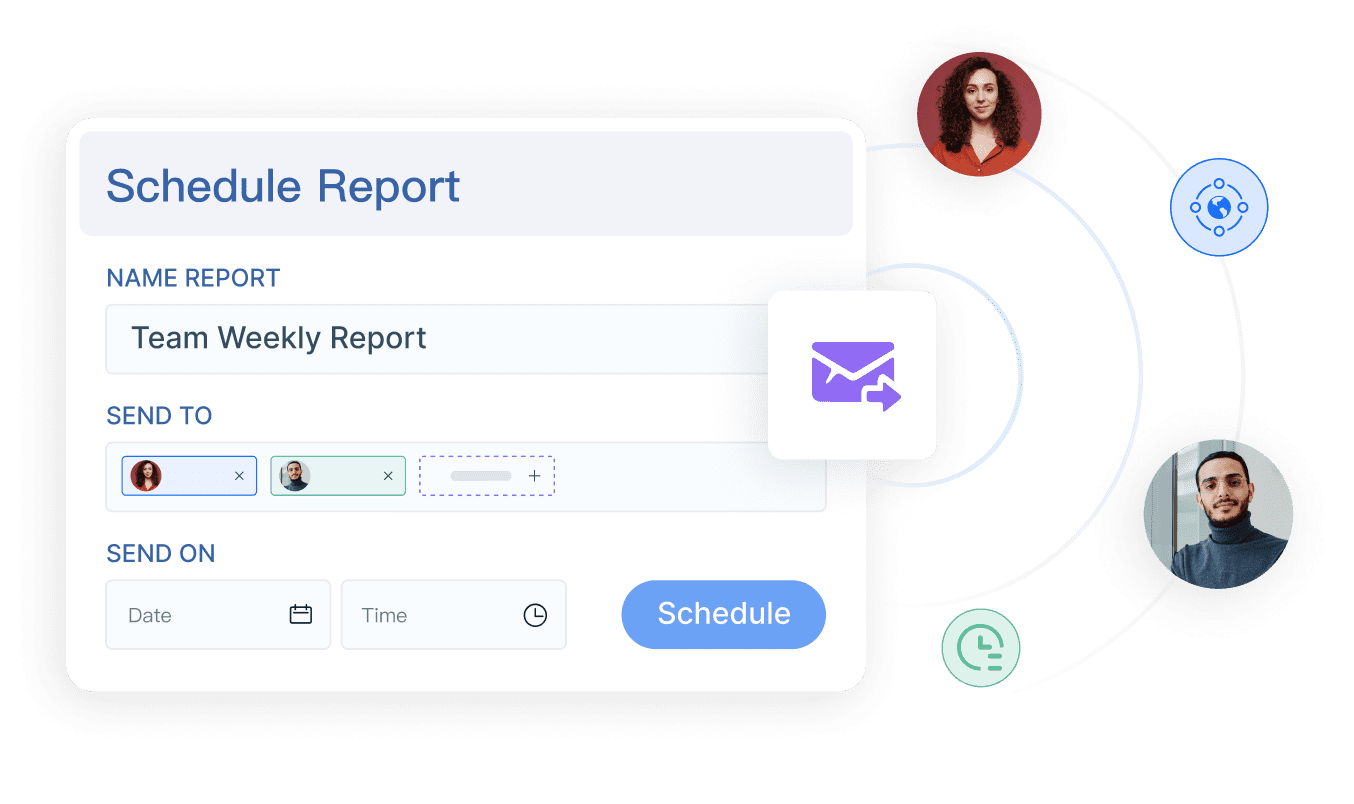
This is where FineReport + Dora becomes especially practical. FineReport handles the trusted report delivery layer, while Dora can extend that layer into scheduled management briefings, chart-based explanations, exception pushes, and follow-up reminders.
Metrics to Track Across Channels
The right metrics depend on your business model, but most enterprise teams should structure the cross channel analytics report template around top-line outcomes, efficiency signals, and funnel health.
Top-line performance metrics
These metrics show whether marketing contributes to business results.
Revenue Definition: Closed revenue or attributed revenue influenced by marketing activity. Business value: Connects marketing reporting to business impact. AI use:Dora can summarize revenue movement by channel, region, or campaign and include it in a scheduled executive briefing.
Pipeline contribution Definition: Marketing-sourced or marketing-influenced pipeline value. Business value: Helps B2B teams evaluate quality beyond raw lead volume. AI use:Dora can explain which channels contributed pipeline growth and which regions are under target.
Leads Definition: The number of captured prospects meeting agreed reporting criteria. Business value: Provides a key top-of-funnel demand indicator. AI use:Dora can compare lead flow against spend and flag unusual shifts.
Conversions Definition: Desired actions such as purchases, form fills, demo requests, or subscriptions. Business value: Measures operational performance and campaign effectiveness. AI use:Dora can generate chart explanations when conversion performance diverges across platforms.
Cost Definition: Total marketing spend or campaign-specific spend. Business value: Supports budget control and efficiency analysis. AI use:Dora can include spend pacing warnings in weekly summaries.
Return on investment Definition: Revenue or profit return relative to marketing spend. Business value: Helps leaders compare strategic value across channels and campaigns. AI use:Dora can explain ROI changes and identify which underlying KPIs drove the shift.
These metrics help explain why top-line outcomes changed.
Click-through rate Definition: Clicks divided by impressions. Business value: Indicates creative and targeting resonance. AI use:Dora can summarize campaign-level CTR declines and suggest which owner should review.
Cost per acquisition Definition: Spend divided by acquisitions or conversions. Business value: Measures channel efficiency. AI use:Dora can surface rising CPA trends and push alerts when thresholds are breached.
Reach Definition: The number of unique users exposed to a campaign or content. Business value: Helps assess awareness and coverage. AI use:Dora can compare reach growth with downstream conversion quality to avoid vanity reporting.
Impressions Definition: Total number of times content or ads were displayed. Business value: Supports exposure analysis and trend context. AI use:Dora can include impression surges in performance narratives while clarifying whether they translated into meaningful outcomes.
Engagement rate Definition: Interactions relative to exposure or audience size. Business value: Useful for content, social, and brand engagement analysis. AI use:Dora can explain engagement changes by content type or platform.
Assisted conversions Definition: Conversions where a channel contributed without receiving final credit. Business value: Prevents underinvestment in upper- and mid-funnel channels. AI use:Dora can provide a management explanation of assisted value when executives question channels with low last-click conversion counts.
Funnel and customer journey metrics
These metrics show where performance succeeds or stalls across the buyer journey.
Landing page performance Definition: Page visits, bounce or engagement behavior, and conversion outcomes by landing page. Business value: Connects channel traffic quality to on-site experience. AI use:Dora can highlight pages with strong traffic but weak conversion performance.
Lead quality Definition: The proportion of leads that progress into qualified pipeline or revenue stages. Business value: Separates useful demand from low-value lead volume. AI use:Dora can summarize which channels generate stronger downstream quality.
Opportunity progression Definition: Movement from lead to opportunity to closed outcome. Business value: Shows whether marketing activity contributes to real sales motion. AI use:Dora can compare progression rates by source and notify owners when a funnel stage stalls.
Retention Definition: Repeat purchase, renewal, or continued engagement after acquisition. Business value: Helps measure long-term channel value, not just first conversion. AI use:Dora can add retention highlights into strategic reporting summaries.
Time to conversion Definition: The elapsed time between initial touch and final conversion. Business value: Supports budget timing, nurture strategy, and attribution interpretation. AI use:Dora can explain why some channels show delayed value and should not be judged on short windows alone.
How to Customize the Template for Different Reporting Needs
A single cross channel analytics report template should not force every audience to consume the same story. It should support controlled customization without breaking governance.
Executives need a concise view of trends, risks, wins, budget efficiency, and recommendations.
A good executive layer should answer:
Are we on target?
Which channels are helping or hurting performance?
Where are the biggest risks?
What action should leadership approve next?
This is where FineReport excels as a management reporting foundation. Teams can build executive-facing formatted reports and cockpits with trusted KPI definitions, while keeping deeper investigative views available for analysts.
Dora adds another layer of value here. Instead of requiring executives to click through multiple tabs, Dora can provide a structured report summary in chat and prepare scheduled weekly or monthly briefings. For executives, that means scenario ROI: less waiting, faster review, and more timely follow-up on recurring reporting work.
Campaign and channel reporting
Campaign managers and channel owners need more granularity. Their view should break out performance by:
campaign objective
audience segment
geography
product line
platform
creative or content grouping
funnel stage
This view is not just about diagnosis. It is also where exception management becomes useful. Dora’s Risk Alert Officer or Data Analystdigital employee can detect threshold breaches, summarize underperformance, and route a push notification to the responsible owner for review.
Social media and cross-functional reporting
Enterprise teams often need reporting that supports multiple functions, not just marketing.
Examples include:
social content performance with brand engagement trends
sales alignment on lead quality and opportunity outcomes
customer success visibility into retention and expansion signals
regional operations views for local execution support
The template should therefore allow different report packages to reuse the same governed metric layer while exposing different views. FineReport provides the report and cockpit foundation; Dora makes those assets easier to consume through chat-based AI assistance and scheduled summaries.
How an AI Data Agent Automates Report Consumption
Most reporting projects focus on building dashboards. But enterprise teams also need to solve the consumption problem: people still spend too much time opening reports, interpreting charts, writing summaries, chasing exceptions, and following up with owners.
Imagine the monthly cross-channel review is approaching. The CMO does not want to inspect every chart manually, and regional leaders do not want to wait for analysts to prepare a slide narrative.
A scenario-specific Doradigital employee for this use case could be the Daily Briefing Secretary combined with the Report Researcher.
A concrete chat-style example
“Summarize this month’s cross-channel analytics report, highlight abnormal cost changes, compare paid search, paid social, email, and organic performance, and list the regions that need follow-up.”
This is not a generic chatbot interaction. It is a governed AI workflow over trusted report assets.
How the Dora workflow operates
Retrieve trusted FineReport report or operational cockpit data Dora accesses the approved cross-channel dashboard, management report, and exception list built in FineReport.
Understand KPI definitions, report templates, filters, business terms, and semantic rules
Because FineReport provides the governed reporting and semantic foundation, Dora interprets terms like pipeline contribution, assisted conversions, or qualified lead according to enterprise-approved definitions.
Generate a structured report summary and chart-based explanation Dora creates a management-ready narrative, such as: spend increased in paid social, paid search efficiency improved, email conversion rate declined, and EMEA lead quality fell below target.
Detect exceptions and threshold breaches Dora identifies abnormal CPA changes, delayed source refreshes, campaign underperformance, or unusual funnel drop-offs based on predefined rules.
Push alerts and suggested actions to responsible users
Regional managers, channel owners, or marketing ops teams receive scheduled summaries or exception pushes with links back to the FineReport source report.
Produce follow-up records and periodic review notes Dora logs the follow-up prompts, supports recurring briefing generation, and helps teams maintain a repeatable review rhythm.
Why FineReport matters in this AI workflow
AI does not remove the need for reporting discipline. It increases the need for it.
operational cockpits for recurring review scenarios
That foundation is what allows Dora to act as a reliable AI assistant or AI digital employee for report consumption. Without a governed foundation, AI outputs become harder to trust and harder to scale.
How Dora improves execution
For business users, the value is practical:
natural-language query over trusted reporting assets
chat-based answers without searching across multiple dashboards
structured report summaries and chart explanations
scheduled daily or weekly briefings
exception alerts and push notifications
follow-up support for recurring reporting routines
For IT and analytics teams, Dora also offers stronger enterprise landing capability than feature-only agent comparisons. Its governed, Skills-based execution model is designed for more controllable and auditable workflows, with lower token waste, faster execution paths, and more stable reporting scenarios than raw prompt-only agents.
In other words, Dora helps enterprises move from “people manually preparing and interpreting reports” to “AI helping people query, summarize, alert, push, and follow up” while still respecting governance.
Even a well-designed cross channel analytics report template can fail if the underlying reporting process is weak.
Mixing inconsistent attribution models across channels
Comparing one channel on last-click logic and another on data-driven attribution creates confusion fast. Choose a reporting standard and document it clearly. If multiple views are required, label them separately.
Reporting too many metrics without clear decision-making value
A dense dashboard is not the same as a useful dashboard. Keep top-level reporting focused on metrics that support action. Use supporting tabs for detail.
Ignoring data latency, tracking gaps, or platform discrepancies
Not every source updates at the same time. Some channels over-report or under-report relative to site analytics or CRM systems. Make latency and source-of-truth rules visible.
Failing to document definitions, assumptions, and update rules
If only one analyst knows how the numbers are produced, the report is not enterprise-ready. Definitions, assumptions, refresh schedules, and ownership must be formalized.
Actionable Best Practices
A strong cross channel analytics report template depends on execution discipline. These practices help teams launch successfully and expand in a controlled way.
1. Standardize report templates, KPI definitions, business terms, and exception rules
Do this before broad automation. A stable reporting template improves human understanding and gives Dora a much stronger semantic context for summaries, answers, and alerts.
2. Build a semantic layer inside the reporting workflow
Do not leave KPI interpretation to ad hoc user assumptions. FineReport should serve as the governed reporting foundation, with clear definitions for business terms, dimensions, filters, and templates. That foundation is what makes Dora’s natural-language query and structured report summary useful in an enterprise setting.
3. Treat data quality as part of the AI implementation
AI reporting quality depends on source quality. Missing tags, duplicate records, conflicting campaign names, and stale refreshes will all weaken both dashboards and AI-generated narratives. Data quality is not separate from AI success; it is part of it.
This is where Dora can act as a landed digital employee rather than an AI experiment.
5. Preserve permission governance and use human review for AI narratives
AI outputs should respect FineReport access boundaries. Start with reviewable summaries and alert workflows, then expand Dora Skills gradually as confidence in governance and data quality increases.
Teams often begin with a free dashboard, spreadsheet, or worksheet. That can be useful for prototyping, but enterprise adoption requires more than a quick start.
segmentation by region, campaign, audience, and product
flexibility to adapt attribution logic
repeatable layout and update rules
What matters is not only how quickly a template can be copied, but whether it can support enterprise governance, controlled access, flexible segmentation, and recurring delivery.
How to move from manual reporting to faster analytics setup
Build the FineReport reporting template and cockpit views
Validate calculations and ownership rules
Automate scheduled distribution
Add Dora for chat-based summaries, briefings, and exception follow-up
Expand with benchmark views, anomaly alerts, and deeper attribution analysis over time
The key is to move from manual spreadsheet stitching to a governed reporting workflow first, then layer in AI Data Agent capabilities for better consumption and execution.
Building this manually is complex. FineReport helps teams standardize trusted reports, operational cockpits, templates, and reporting workflows. Dora turns those assets into an AI assistant that can answer report questions in chat, generate structured summaries, push scheduled briefings, monitor exceptions, and follow up with responsible owners.
For enterprise marketing teams, that means a cross channel analytics report template can become more than a dashboard. It becomes a repeatable operating mechanism:
FineReport builds the trusted reporting foundation
Dora turns that foundation into a scenario-specific AI assistant or digital employee
IT focuses on data quality, governance, semantics, and reusable Skills
business users get timely summaries, answers, and alerts without hunting through reports
executives receive concise, actionable reporting narratives tied to real operating scenarios
FineReport + Dora is not only a reporting upgrade; it is a practical fourth-generation Agentic BI path. FineReport provides governed reports and operational cockpits. Dora provides the AI assistant layer for scenario execution, with more controlled Skills, lower token waste, faster execution paths, and more stable workflows than prompt-only agents.
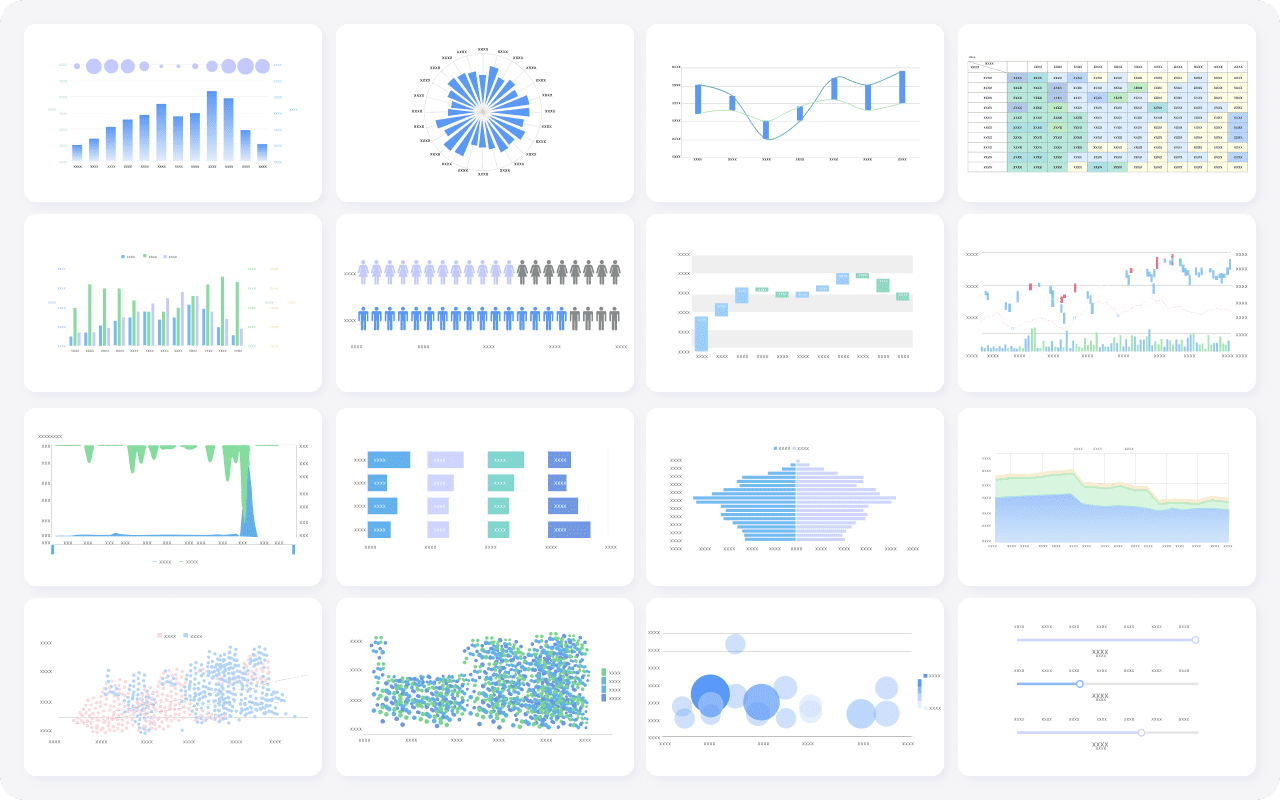
Get Ready-to-Use Dashboard Templates in Fine Gallery
The strongest Dora pitch is scenario + product + service: FineReport provides the trusted reporting foundation, Dora provides the AI digital employee, and implementation service connects data, governance, semantic setup, Skills, report templates, permissions, and rollout.
A cross-channel analytics report template is a standardized reporting framework that combines performance data from multiple marketing channels into one view. It helps enterprise teams compare spend, conversions, pipeline, and revenue using consistent definitions.
A strong report usually includes spend, conversions, revenue, ROI or ROAS, CAC or CPA, funnel metrics, and channel-level trends. Enterprise teams should also include pipeline and attribution-based KPIs that connect marketing activity to business outcomes.
Start by defining the report goal, audience, and business questions, then map the channels, regions, and teams that need coverage. After that, standardize KPI definitions, attribution rules, refresh cadence, and access controls before building dashboards and summaries.
Attribution determines how credit is assigned across touchpoints, so it directly affects which channels appear to drive results. Without a clear model and reporting window, teams can make poor budget decisions based on inconsistent numbers.
FineReport provides governed dashboards and trusted report assets, while Dora helps turn those assets into summaries, briefings, and follow-up prompts. Together, they make enterprise reporting easier to understand, share, and act on.
Product Trial
FineReport
Pixel-perfect reports · Interactive dashboards · Easy data entry · Digital twins