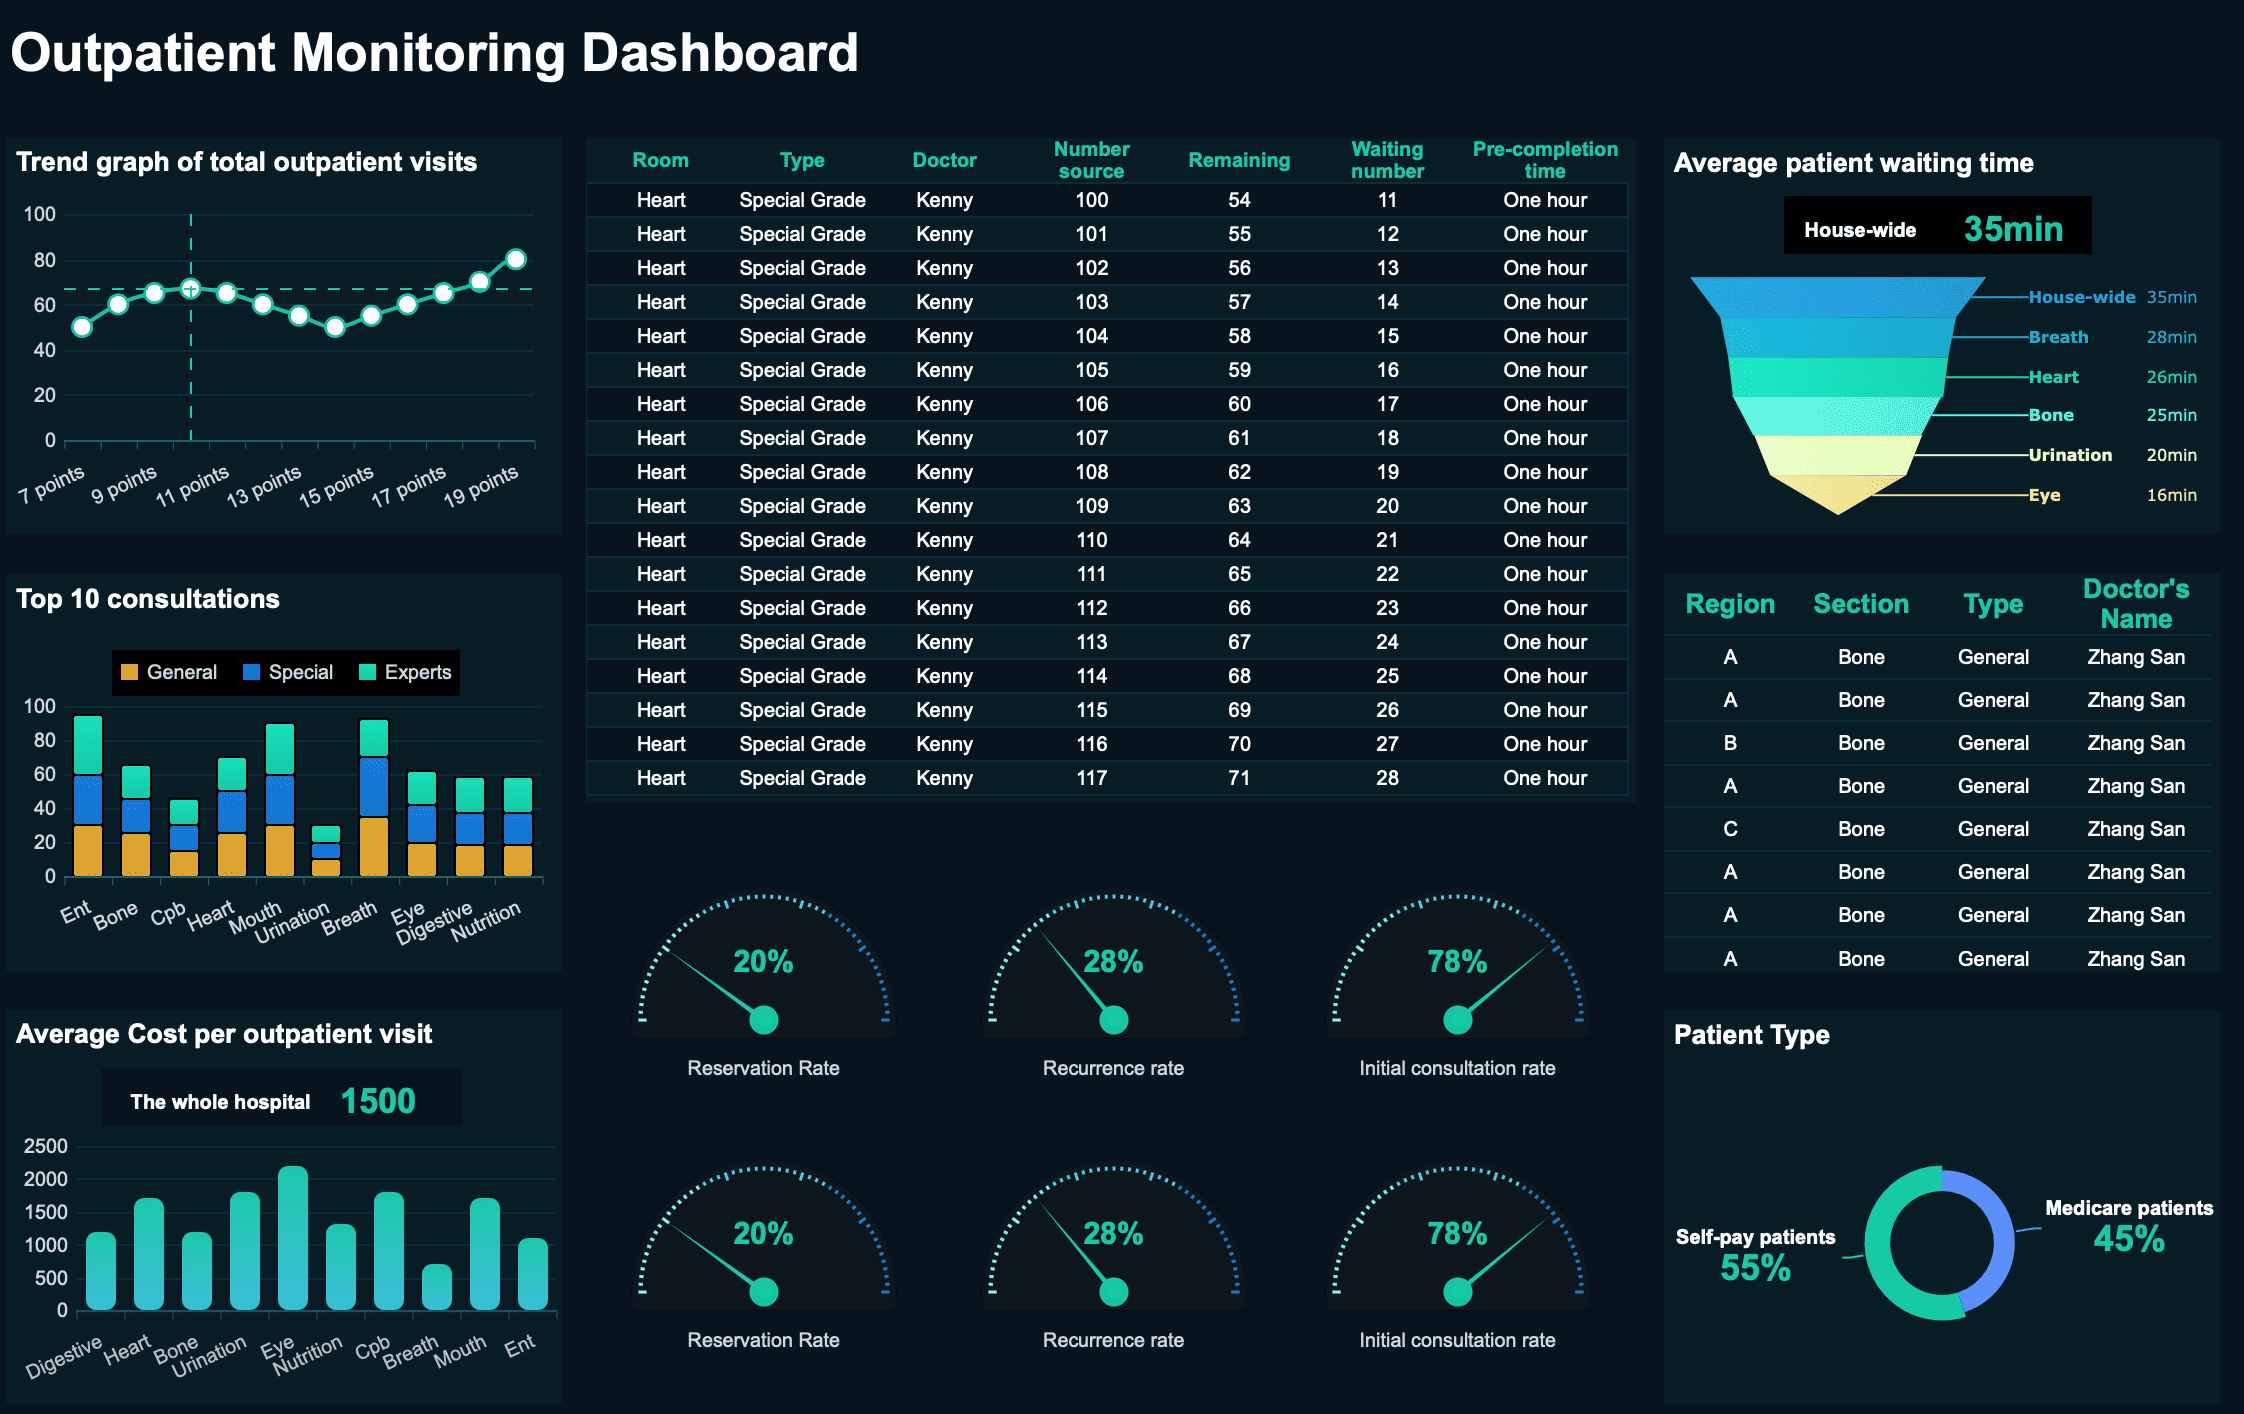
A marketing weekly report is the operating document that helps marketing leaders, channel managers, and operations teams detect performance shifts early, explain what changed, and decide what to do next. If your team is still pulling platform screenshots into slides or spreadsheets every Friday, you already know the pain: inconsistent data, too many vanity metrics, delayed decisions, and reports that stakeholders skim without acting on. A strong weekly report fixes that by turning fragmented channel data into one decision-ready view of performance, risks, and priorities.
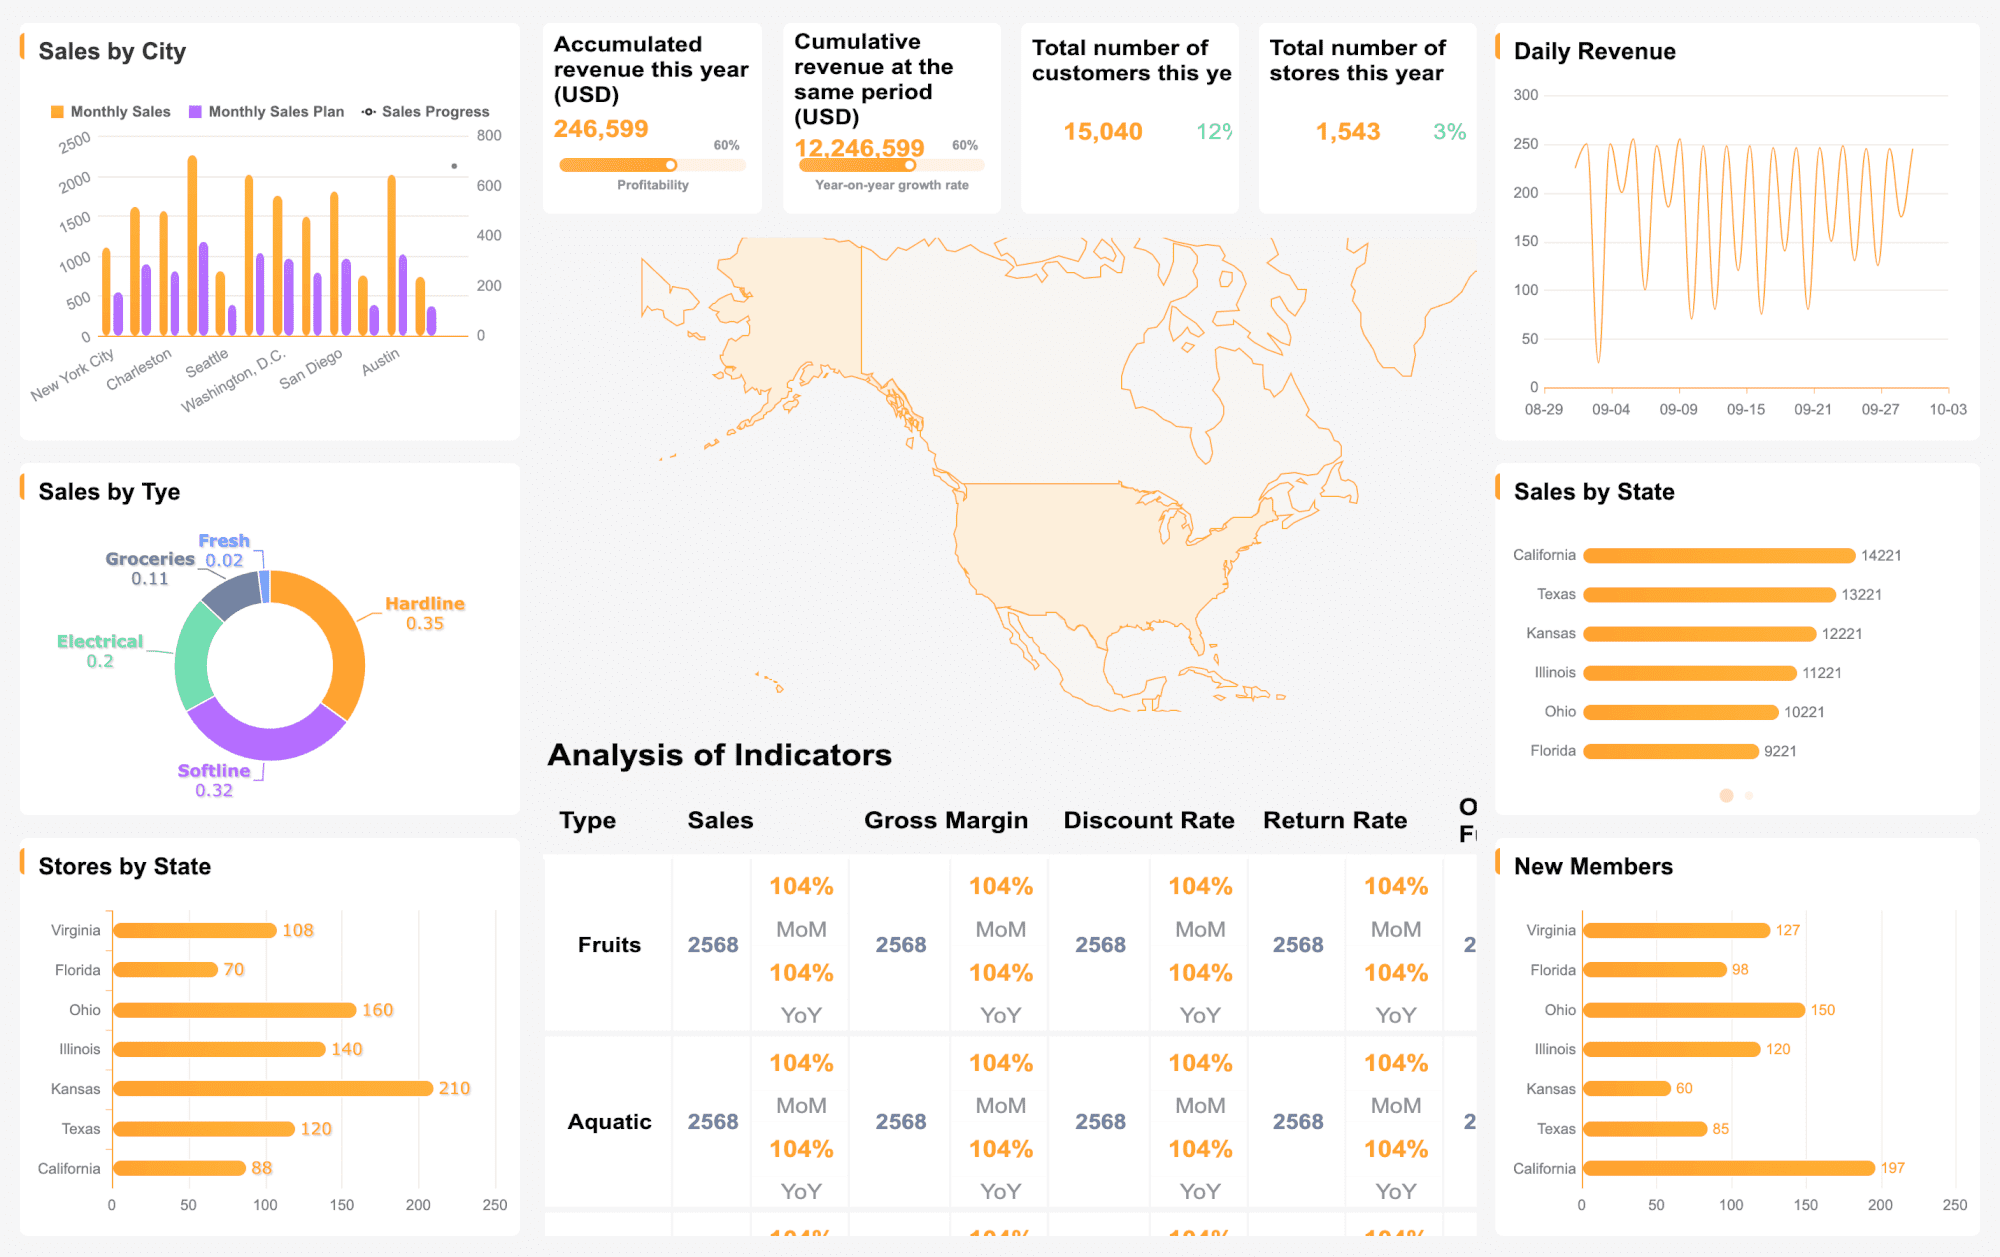
All reports in this article are built with FineReport
What a Marketing Weekly Report Is and Why It Matters
A marketing weekly report is a structured summary of marketing performance over the last seven days. It combines metrics, trends, commentary, and actions into a format that helps teams move quickly. Unlike a real-time dashboard, a weekly report answers three practical questions:
What happened this week?
Why did it happen?
What should we do next?
For modern marketing teams, this reporting cadence matters because monthly reviews are often too slow. Paid media can waste budget in a matter of days. Organic traffic drops can go unnoticed until lead volume softens. Email engagement can fall before conversion issues become obvious. Weekly reporting creates a tighter optimization loop.
Weekly reporting also improves alignment across functions. Channel specialists use it to evaluate tactical performance. Marketing managers use it to prioritize experiments and budget shifts. Sales and RevOps teams use it to understand lead flow and pipeline quality. Leadership uses it to gauge momentum, risks, and business impact without reading a 20-page deck.
Content engagement: Scroll depth, time on page, downloads, or shares; helps evaluate content quality.
Audience growth trends: Net follower or subscriber growth across channels; useful as a directional health signal.
What to Include in a Marketing Weekly Report
The best weekly reports are concise but complete. They do not try to show every available data point. Instead, they cover the essentials needed to evaluate performance and decide on next actions.
Executive summary
Start with a short executive summary at the top. This is the section most stakeholders will read first, and sometimes the only section executives will read in full. It should highlight the major wins, losses, changes, and decisions from the week.
A strong executive summary typically answers:
What improved?
What declined?
Why does it matter?
What needs attention next week?
For example, instead of writing “Paid social CTR increased 18%,” explain the implication: “Paid social CTR increased 18% week over week after creative refresh, but landing page conversion rate remained flat, so traffic quality improved faster than post-click performance.”
This section is the quantitative backbone of your report. Include the metrics that represent both early signals and final outcomes. A balanced report tracks leading indicators and outcome metrics together.
Leading indicators may include:
Sessions
Reach
Impressions
CTR
CPC
Email clicks
Landing page engagement
Outcome metrics may include:
Leads
Conversion rate
Demo requests
Purchases
Pipeline contribution
Revenue influenced
ROAS
CAC
This balance matters. If you only report outcomes, you react too late. If you only report activity metrics, you may mistake movement for progress.
Campaign and channel breakdown
Every weekly marketing report should break performance down in a consistent structure across key channels:
Paid media
Organic search
Email marketing
Social media
Content marketing
Referral or partner channels, if relevant
For each channel, show current-week results alongside at least one comparison point:
Previous week
Weekly target
Monthly pacing
Historical benchmark
Consistency is critical. If paid media is broken down by campaign but email is summarized only by total sends, the report becomes harder to interpret. Use the same reporting logic each week so trends are obvious.
This is where reporting becomes operationally useful. Numbers alone do not drive change. Each section should identify likely drivers behind performance and recommend the next action.
Useful prompts include:
Which campaign or change most likely influenced the result?
Was the shift due to volume, efficiency, conversion quality, or attribution timing?
Is this a one-week anomaly or part of a trend?
What should the team test, pause, scale, or fix next?
A practical weekly report ends with actions, not observations. For example:
Pause two underperforming paid audiences
Increase budget on branded search by 15%
Refresh subject lines for lifecycle email campaigns
Update low-converting landing page CTA and form layout
Publish follow-up content around top-converting topic cluster
How to Structure a Weekly Marketing Report Clearly
Structure determines whether the report gets used. A confusing report creates delays, debate, and misalignment. A clear report makes decision-making faster.
Start with a one-page summary
The first page should give stakeholders a fast read on overall marketing health. Include:
Top-line KPIs
Week-over-week movement
Major insights
Key risks
Recommended actions
Think of this page as the decision layer. If someone has five minutes before a leadership meeting, they should still understand the week.
Organize sections by goal, channel, or funnel stage
Choose one organizing principle and stick to it every week. The most common options are:
By goal: brand awareness, lead generation, revenue
By channel: paid, organic, email, social, content
By funnel stage: acquisition, conversion, retention
There is no universal best structure. The right choice depends on how your team works. But changing logic week to week destroys comparability. Pick one framework and make it your standard operating format.
Use visuals, benchmarks, and short commentary
Good visuals speed up understanding. They should support analysis, not replace it. Use:
KPI scorecards for top-line metrics
Trend lines for week-over-week movement
Bar charts for channel comparisons
Tables for campaign-level detail
Funnel charts for drop-off analysis
Always pair visuals with short commentary. A chart without interpretation forces every stakeholder to draw their own conclusion, which wastes time and creates confusion.
A weekly report should lead to execution. Close the report with a simple action tracker that assigns:
The action item
The owner
The due date
The expected result
This converts reporting from a passive review ritual into a management tool. Without ownership, even strong insights tend to disappear into meeting notes.
Which KPIs Matter Most in a Weekly Marketing Report
Not every KPI deserves weekly attention. The right set depends on your business model, goals, and funnel maturity. Still, most teams can build an effective weekly report around four KPI groups.
Acquisition metrics
These metrics measure top-of-funnel demand generation and traffic quality.
Key acquisition metrics include:
Sessions: Indicates how much traffic marketing is driving
Reach: Shows how many people your campaigns or content touched
Impressions: Useful for understanding visibility and media scale
Click-through rate: Evaluates creative and messaging effectiveness
Cost per click: Tracks media efficiency in paid channels
These metrics are especially important for diagnosing whether weak downstream performance started with insufficient visibility, poor targeting, or low click appeal.
Conversion metrics
These KPIs show whether traffic turns into meaningful actions.
Key conversion metrics include:
Leads: Captures raw demand volume
Conversion rate: Measures funnel effectiveness
Cost per lead: Shows whether acquisition is financially sustainable
Demo requests: Signals high-intent interest in B2B funnels
Purchases: Measures completed transactions in ecommerce or direct-response models
When reviewing conversion metrics weekly, look at both total volume and rate. More leads are not always better if quality drops sharply.
Revenue and efficiency metrics
This is where marketing performance connects to financial outcomes.
Key revenue and efficiency metrics include:
Pipeline contribution: Shows how much opportunity value marketing generated or influenced
Revenue influenced: Connects campaigns and channels to closed business impact
Return on ad spend: Essential for evaluating paid campaign profitability
Customer acquisition cost: Tracks the cost required to win a new customer
These metrics matter most to leadership because they link marketing effort to business return. For B2B teams with longer sales cycles, note attribution timing clearly so stakeholders do not overreact to incomplete weekly revenue data.
Retention and engagement signals
Retention and engagement metrics help teams understand audience quality and ongoing relationship strength.
Repeat visits: Indicates whether users are returning to continue evaluation
Content engagement: Reveals whether content is resonating and being consumed
Audience growth trends: Measures subscriber and follower momentum over time
These metrics often act as early indicators of future conversion health, especially for content-led, lifecycle-driven, or community-based marketing programs.
Common Mistakes to Avoid in Weekly Marketing Reporting
Many weekly reports fail not because teams lack data, but because they include the wrong data or present it poorly.
Tracking too many metrics without tying them to business goals
If the report includes dozens of numbers with no decision context, stakeholders cannot tell what matters. A weekly report should prioritize metrics that map directly to revenue goals, lead targets, or funnel performance.
Reporting numbers without explaining causes or recommended actions
This is one of the most common issues. “Traffic down 12%” is incomplete. The report should explain the likely cause and what the team will do next. Reporting without interpretation is just recordkeeping.
Mixing data sources or date ranges in ways that distort comparisons
Weekly reporting breaks down when one team uses Monday to Sunday, another uses platform default windows, and a third exports trailing seven-day data. Standardize definitions, attribution windows, and date logic so the report stays credible.
Building reports that are too detailed for stakeholders to use quickly
A specialist may want campaign-level granularity, but executives usually need trend, risk, and impact. If every audience gets the same level of detail, the report becomes harder to use. Create a summary layer for leadership and detailed sections for practitioners.
Weekly Marketing Report Templates and Examples to Adapt
Templates reduce reporting time and improve consistency. The goal is not to force every team into the same format, but to create a repeatable reporting system that fits the audience.
Simple template for small teams
This template works well for startups, lean in-house teams, and generalist marketers. Keep it focused on the essentials:
Executive summary
Top KPIs for the week
Channel highlights
Major wins and risks
Priorities for next week
This format is ideal when one person manages multiple channels and needs a quick operating document rather than a complex reporting package.
Specialists need deeper visibility into the channel they own. A channel-specific template can include:
Campaign-level metrics
Audience or keyword segmentation
Creative or content performance
Spend pacing
Conversion path insights
Test results and recommendations
This works well for paid media managers, SEO teams, email marketers, and social media specialists who need tactical depth beyond the executive snapshot.
Executive template for leadership updates
Leadership reports should be narrower and more strategic. Focus on:
Top-line trends
Business impact
Risks and opportunities
Budget efficiency
Forecast implications
Key decisions needed
Keep commentary concise and frame insights in business terms. Leadership rarely needs to know every campaign detail, but they do need to know what is accelerating growth, what is underperforming, and where intervention is required.
For all three template types, ready-made and editable report templates can save significant time. If your team is still building weekly reports manually from scratch, automation and reusable templates are the fastest path to consistency.
Best Practices for Building a High-Impact Marketing Weekly Report
If I were advising a marketing operations leader or growth director, I would recommend implementing weekly reporting with a disciplined, repeatable workflow.
1. Lock your KPI definitions before building the report
Agree on what counts as a session, lead, MQL, demo request, influenced revenue, and attributed conversion. This sounds basic, but it eliminates endless debate later. Weekly reports fail when teams argue over definitions instead of discussing actions.
2. Standardize one reporting cadence and one comparison method
Use the same weekly window every time and compare against the same reference point, such as prior full week or target. This is the only way to identify meaningful movement instead of noise.
3. Separate summary reporting from diagnostic detail
Build an executive layer for decisions and a deeper channel layer for operators. This keeps the report readable while still enabling analysis when a metric moves unexpectedly.
4. Add mandatory commentary for every major KPI movement
Require owners to explain any significant increase or decrease, even briefly. This forces analytical discipline and prevents stakeholders from misreading raw performance shifts.
5. End every report with decisions, owners, and deadlines
No action tracker means no operational value. Every key insight should connect to a next step, owner, and expected completion date.
Build a Smarter Marketing Weekly Report with FineReport
Building this manually is complex; use FineReport to utilize ready-made templates and automate this entire workflow.
When marketing data lives across ad platforms, analytics tools, CRM systems, email software, and spreadsheets, producing a reliable weekly report becomes a repetitive manual process. That creates delays, increases error risk, and makes weekly comparison harder than it should be. FineReport solves this by centralizing data, standardizing report logic, and turning reporting into an automated operating system.
Build executive and channel-level weekly report templates
Connect multiple data sources into one governed reporting layer
Automate recurring KPI updates and calculations
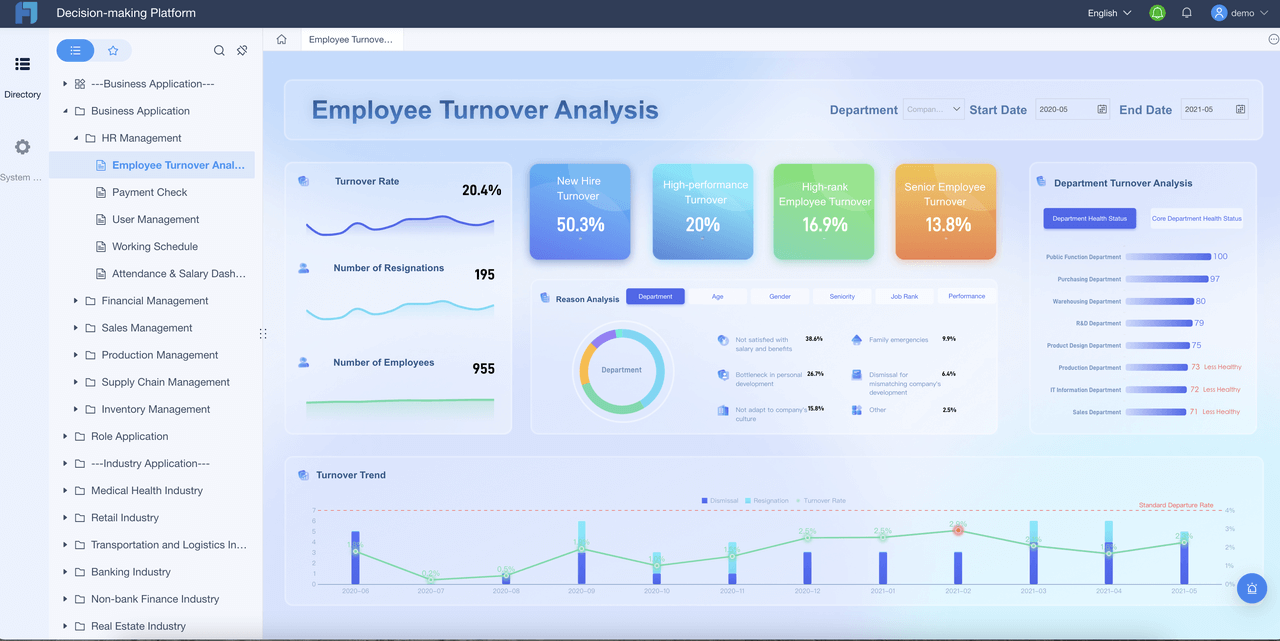
Create dashboard-style reports with charts, tables, and filters
Standardize commentary and action sections for weekly reviews
Deliver consistent reports to stakeholders on schedule
Get Ready-to-Use Dashboard Templates in Fine Gallery
If your goal is to create a marketing weekly report that stakeholders trust and teams actually use, automation is not a nice-to-have. It is the difference between reporting that consumes time and reporting that drives action.
A strong marketing weekly report should include an executive summary, core KPIs, week-over-week trends, key insights on what changed, and clear next actions. The goal is to show not just performance data, but what the team should do next.
The most useful KPIs usually include sessions, leads, conversion rate, CTR, CPC or CPL, ROAS, and pipeline or revenue impact. The right mix depends on your business model, channels, and whether you are optimizing for awareness, lead generation, or sales.
A dashboard shows live or near real-time metrics, while a weekly report adds context, interpretation, and recommendations. In short, the dashboard shows what is happening, and the weekly report explains why it happened and what to do next.
Most weekly reports should be concise enough to review in a few minutes, usually one to three pages or a single dashboard view with commentary. It should focus on the metrics and insights that support decisions, not every available data point.
Teams can automate weekly reporting by connecting ad, web analytics, CRM, and email data into one reporting tool like FineReport. This reduces manual spreadsheet work, keeps definitions consistent, and makes it easier to generate decision-ready reports on a fixed schedule.
Product Trial
FineReport
Pixel-perfect reports · Interactive dashboards · Easy data entry · Digital twins