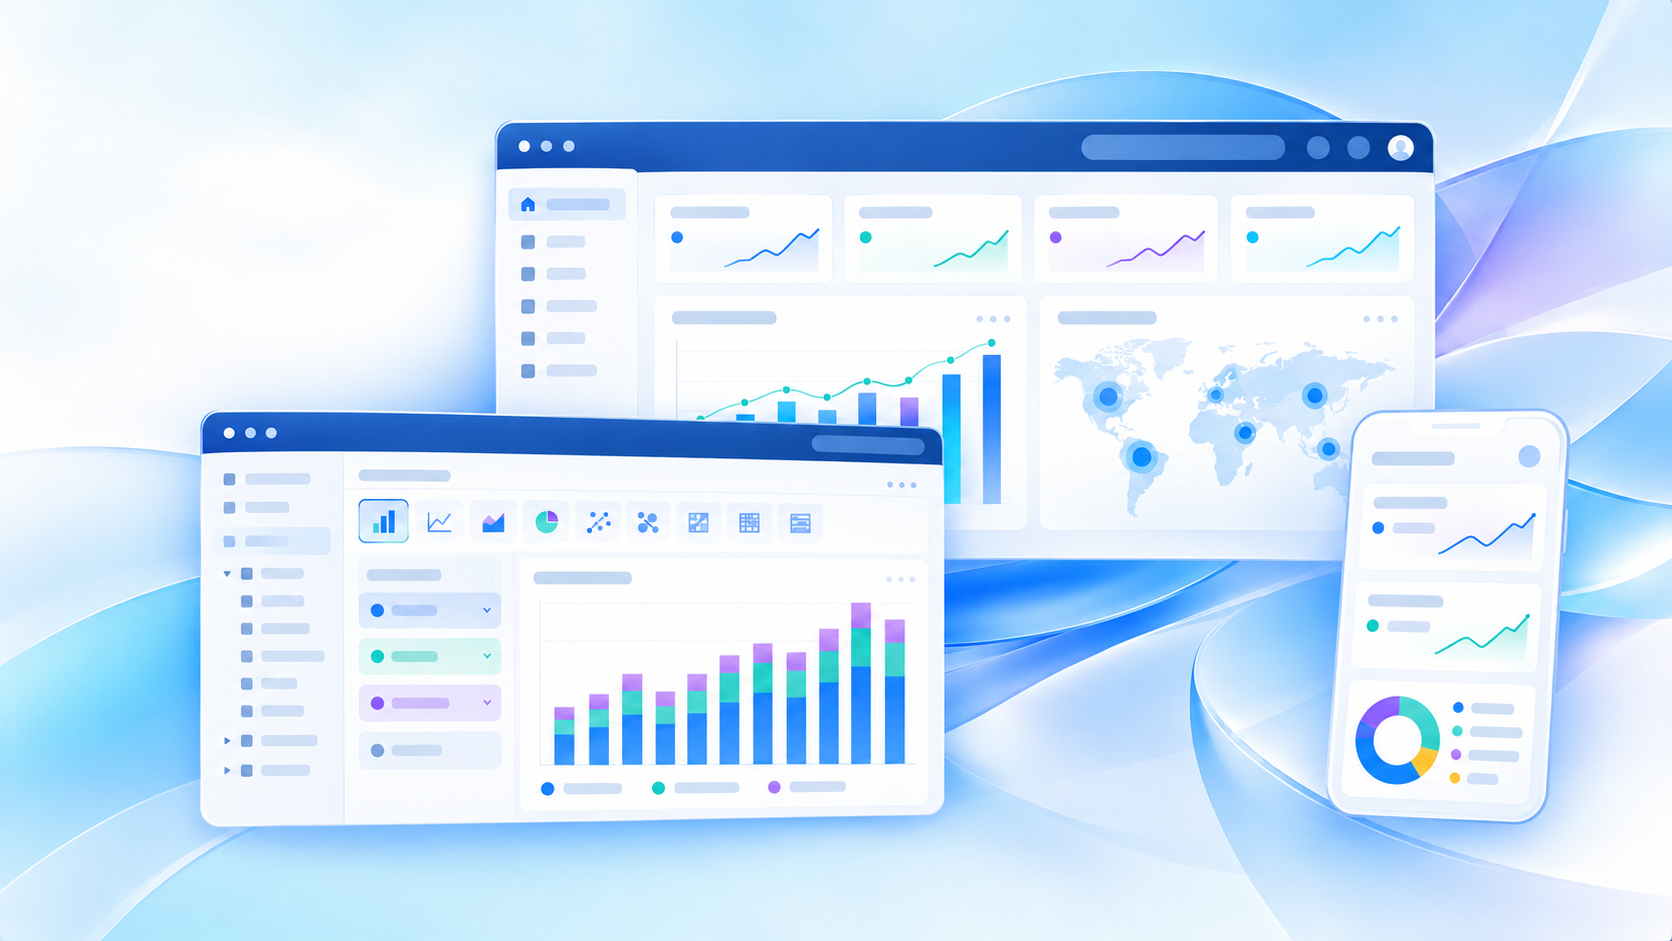
If you are searching for mode analytics, you are probably trying to answer one of three questions: what Mode Analytics actually is, whether it fits your team’s workflow, and how it compares with other BI and analytics platforms.
In simple terms, Mode Analytics is a business intelligence and analytics platform built to help teams query data, analyze it, visualize findings, and share reports in one environment. It is especially known for combining SQL-based analysis, notebooks for advanced work, and dashboards for business reporting into a single workflow.
For beginners, the most important thing to understand is this: Mode is generally designed for organizations that already have a reasonably mature data setup and want analysts to move quickly from raw data to shared insights. It is often a stronger fit for data analysts, analytics engineers, data scientists, and technical business teams than for organizations looking for a purely drag-and-drop dashboard tool for non-technical users.
What Is Mode Analytics and How Does It Work?
Define Mode Analytics in simple terms for beginners
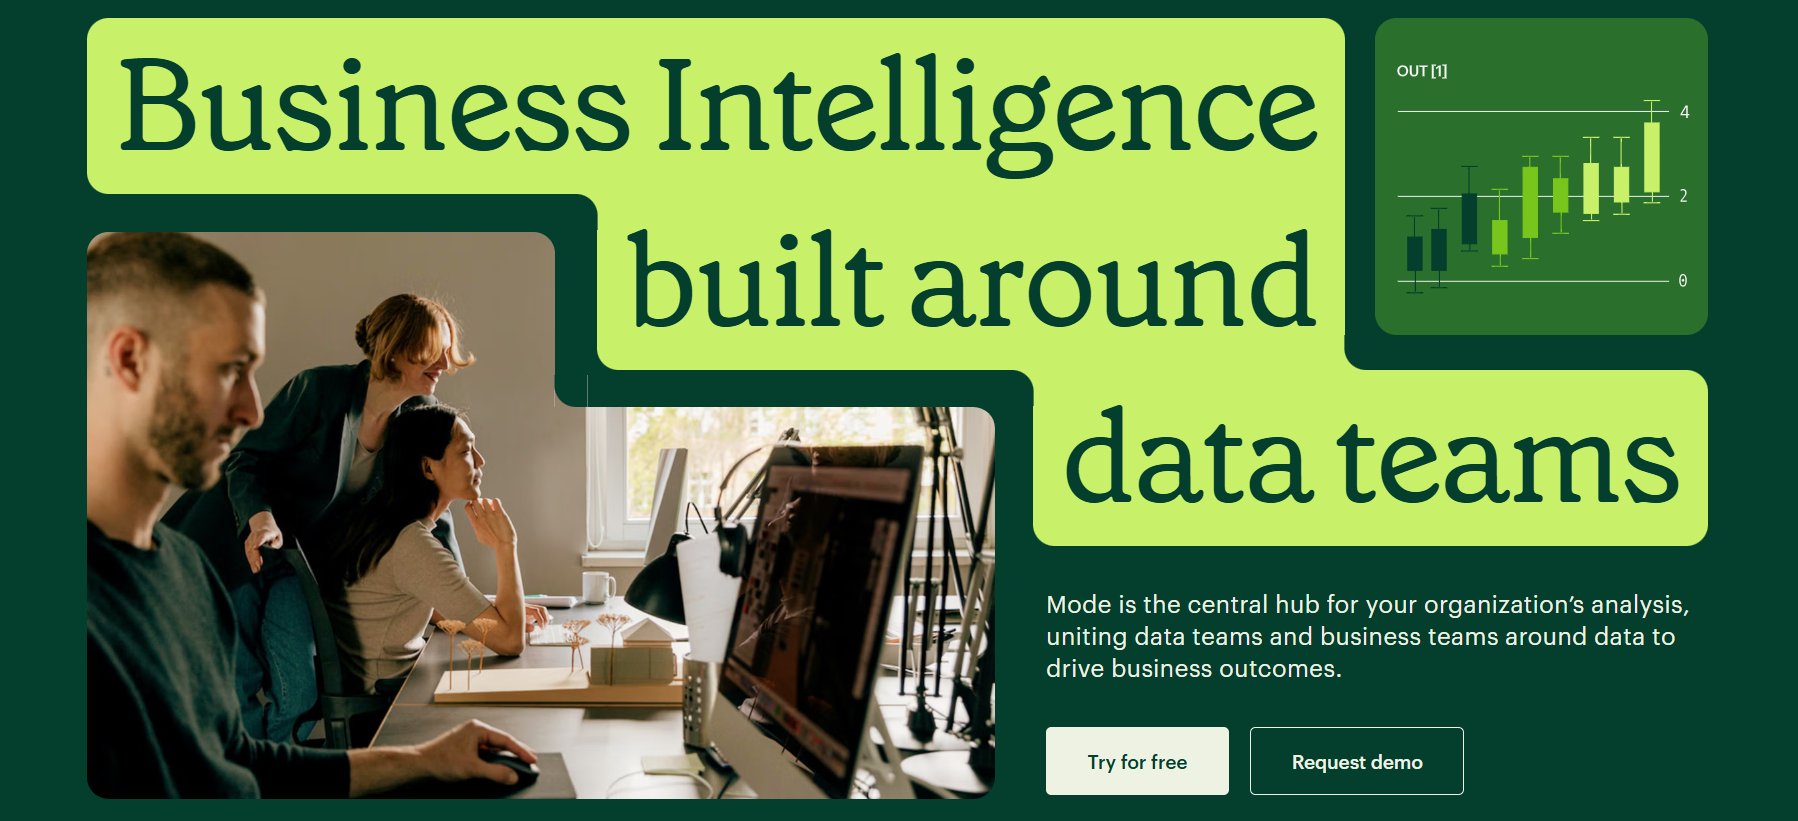
Mode Analytics is a modern BI and analytics platform that helps teams work with business data from a central place. Instead of separating querying, analysis, notebook work, and dashboard publishing across different tools, Mode brings these steps together.
A beginner-friendly way to think about it is:
- SQL helps analysts pull and shape data
- Notebook support helps them run deeper analysis
- Visualizations and dashboards help them share results with business users
That combination is what makes Mode attractive to teams that want both technical analysis and business reporting in one platform.
Explain how SQL, Python, and dashboards fit into one workflow
One of Mode’s defining ideas is that analysis should not be split across too many disconnected tools. In practice, a workflow often looks like this:
- An analyst writes a SQL query against a cloud database or warehouse.
- The query returns structured business data.
- That output can be explored visually or extended in a notebook environment for deeper analysis.
- The final result can be published as a report or dashboard for stakeholders.
This means Mode often appeals to teams that need to move quickly from ad hoc investigation to repeatable reporting.
For example, a product analyst might:
- query feature adoption by customer segment,
- use notebook logic for a more advanced statistical check,
- then publish a dashboard showing adoption trends for leadership.
Clarify the kinds of teams and data tasks the platform is built for
Mode Analytics is usually associated with teams that already rely heavily on data warehouses and technical analysis. Common users include:
- Data analysts
- Analytics engineers
- Data scientists
- Product analytics teams
- Revenue and marketing analysts
- Technical business operations teams
It is often used for tasks such as:
- recurring KPI reporting,
- exploratory analysis,
- dashboard publishing,
- cross-functional performance tracking,
- and deeper investigation of trends or anomalies.
For less technical organizations, the key consideration is whether the team wants analysts to remain at the center of insight creation, or whether more business users need to build dashboards on their own with minimal coding.
Core Features That Make Mode Analytics Popular
SQL editor and collaborative analysis
A major reason people search for mode analytics is its reputation as an analyst-friendly platform. The SQL editor is central to that.
Analysts can use the editor to:
- write and run queries,
- iterate on logic quickly,
- save work,
- organize reusable analysis,
- and share results with teammates.
This is useful when multiple analysts or data team members need to work from the same reporting logic. Instead of exporting static files back and forth, teams can collaborate around live analytical work.
For organizations with a mature warehouse environment, this can improve consistency and speed. Analysts stay close to the source data while still producing outputs that business stakeholders can consume.
Dashboards, reports, and visualizations
Mode is not just a query tool. It also supports charts, dashboards, and report sharing so findings can reach non-technical users.
Typical dashboard and reporting capabilities include:
- interactive charts,
- parameterized views,
- recurring reports,
- scheduled delivery,
- and shared stakeholder visibility.
This matters because business intelligence is not only about analysis. It is also about making sure finance, sales, operations, product, and leadership teams can see trusted metrics at the right time.
That said, the dashboard experience in analyst-centric tools is often strongest when dashboards are created and curated by technically capable users. Companies looking for broader self-service adoption across non-technical departments should pay attention to usability during trials and demos.
Python and advanced analytics support
Another reason Mode stands out is its support for notebook-style analytical work. This gives technical users the ability to go beyond standard charting or SQL summaries.
Advanced users may apply notebooks to:
- statistical analysis,
- forecasting experiments,
- model validation,
- segmentation work,
- and custom data transformations.
This is valuable for teams that do not want to move constantly between a BI layer and a separate notebook environment. It can reduce friction when analysts need both business reporting and deeper exploratory analysis.
For beginners, however, this strength can also signal a potential challenge: platforms built around technical flexibility are often less intuitive for casual business users.
Common Use Cases for Teams and Analysts
Self-service reporting and business intelligence
Mode Analytics is often used for recurring business reporting. Teams build reports around core KPIs and distribute them across departments so decision-makers can track performance.
Common examples include:
- revenue and sales performance dashboards,
- product usage reporting,
- marketing funnel monitoring,
- operations performance tracking,
- and finance summary reporting.
The term self-service here can mean different things depending on the organization. In a technical team, self-service may mean analysts can build and maintain reporting without waiting on engineering. In a broader business setting, self-service may mean end users can directly explore dashboards with filters and drill paths.
That distinction matters when evaluating fit.
Ad hoc analysis for data-driven decisions
Mode is particularly well aligned with ad hoc analysis. When a team needs to answer a specific business question quickly, analysts can query fresh data, investigate trends, and publish findings without setting up a long BI development cycle.
Examples include:
- Why did conversion drop last week?
- Which customer segments are driving churn?
- What caused a spike in returns by region?
- Which campaigns influenced pipeline growth?
This ability to go from question to answer quickly is one of the platform’s key attractions for analytics teams.
Technical assessments and analytics hiring workflows
Mode familiarity can also matter in hiring. In some organizations, especially those with modern analytics stacks, candidate experience with SQL-first BI tools may signal readiness for analyst workflows.
Hiring managers may care about whether candidates can:
- structure SQL clearly,
- explain analytical logic,
- visualize findings effectively,
- and communicate results to stakeholders.
The platform itself is not the main skill. The more important signal is the candidate’s ability to work within a collaborative analytics environment that combines querying, analysis, and reporting.
Pricing, Plans, and What to Evaluate Before Buying
When beginners ask about mode analytics pricing, they usually want a simple answer. In practice, BI pricing is rarely simple because vendors often package value around users, usage, support, governance, and enterprise controls.
A beginner-friendly way to think about pricing is to compare plan differences in terms of these areas:
- number of users,
- analyst versus viewer access,
- dashboard sharing and scheduling,
- governance and permissions,
- support levels,
- API or embedding needs,
- and enterprise security requirements.
Mode is commonly positioned with multiple plan levels that scale from smaller teams to enterprise needs. Public pricing details may vary over time, and enterprise contracts often depend on usage and deployment requirements. So instead of focusing only on a headline number, buyers should evaluate total fit.
When reviewing demos, free trials, or sales materials, compare:
- how quickly analysts can build reports,
- how easily business users can consume and explore dashboards,
- what governance controls are available,
- how sharing works across departments,
- and whether support matches your internal capabilities.
A platform that looks affordable upfront can become harder to scale if business-user adoption is low or if too much report creation depends on a small technical team.
Pros, Limitations, and Who Mode Analytics Is Best For
Strengths compared with simpler reporting tools
Compared with lighter reporting tools, Mode Analytics offers more flexibility for technical analysis. Its strengths often include:
- strong support for SQL-centric workflows,
- integrated analysis and reporting,
- notebook-enabled advanced analysis,
- collaborative report creation,
- and alignment with modern cloud data environments.
For teams that want analysts to own the workflow from query to dashboard, that can be a major advantage.
Potential drawbacks to consider
Mode may be less ideal in some situations. Common evaluation concerns include:
- a steeper learning curve for non-technical users,
- heavier reliance on analyst-built content,
- possible setup and governance complexity as usage expands,
- and less natural fit for organizations that want broad no-code dashboard authoring.
These are not necessarily flaws. They are fit considerations. A technically mature data team may see them as acceptable tradeoffs, while a business-led BI initiative may not.
Best-fit teams and situations
Mode Analytics is generally a strong fit for:
- analyst-led organizations,
- companies with cloud warehouses and mature data teams,
- product, marketing, and operations teams that depend on SQL-heavy exploration,
- and businesses that value combining analysis and reporting in one place.
It may be less ideal if your main goal is to enable many non-technical business users to independently create dashboards and explore governed data with minimal training.
Questions to Ask Before Choosing Mode Analytics
Before selecting Mode or any BI platform, ask these questions:
- What data sources must the tool support?
- Will analysts build most content, or do business users need self-service creation too?
- How important are governance, security, and permission controls?
- Do you need advanced analysis inside the BI workflow, or just dashboards and reports?
- What business outcomes should justify the cost?
These questions help you avoid buying based only on feature lists. The right tool should match your operating model, team skill level, and reporting culture.
Mode Analytics vs FineBI + Dora: Feature Comparison for Different BI Needs
Tools like Mode Analytics are widely used in the BI market, especially by technical data teams. But if your organization also needs broader business-user adoption, governed self-service dashboards, and an AI assistant layer for analytics workflows, it is worth comparing Mode with FineBI + Dora.
Here is a practical feature comparison.
| Criteria | Mode Analytics | FineBI + Dora |
|---|---|---|
| Best for | SQL-heavy data teams and technical analysts | Business teams that need self-service BI with governed analytics and AI-assisted workflows |
| Ease of use | Better for users comfortable with SQL and analytical workflows | More approachable for business users through drag-and-drop analysis and dashboard interaction |
| Dashboard design | Strong for analyst-created reports and dashboards | Strong for interactive business dashboards and broader self-service consumption |
| Data preparation | Often centered around analyst-driven query workflows | Supports governed data access and business-friendly exploration |
| Advanced analytics | Supports notebook-based analytical workflows | Focuses on self-service BI foundation; Dora extends usage with AI-driven request, analysis, and follow-up |
| Collaboration | Sharing reports and dashboards across teams | Dashboard sharing, collaborative analytics, and AI-assisted business workflows |
| Deployment | Commonly used in modern cloud data stack environments | Suitable for enterprise BI scenarios where trusted dashboards and governed analytics are important |
| Learning curve | Moderate to high for non-technical users | Generally easier for business users to adopt |
| Recommended users | Analysts, analytics engineers, technical stakeholders | BI managers, operations teams, finance teams, business analysts, and enterprises scaling governed BI |
This comparison is not about declaring one platform universally better. It is about matching the tool to the way your teams actually work.
Practical Recommendations Before You Decide
If you are evaluating Mode Analytics or similar platforms, here are five practical recommendations from a BI consulting perspective.
-
Map your users before comparing features
Separate report builders, dashboard consumers, and advanced analysts. A tool that works well for one group may frustrate another. -
Test a real business workflow, not just a product demo
Use one recurring KPI report and one ad hoc analysis scenario during the trial. This reveals whether the platform fits your day-to-day work. -
Check how much depends on technical talent
If every new metric, filter, or dashboard requires analyst bandwidth, adoption may slow as demand grows. -
Evaluate governance and trust, not only visual design
Dashboards are useful only when users trust the underlying metrics, definitions, and refresh process. -
Plan for the next stage of analytics maturity
Many teams start with dashboards, but later need AI-assisted querying, alerts, summaries, and workflow follow-up. Choose a foundation that can support that evolution.
When FineBI + Dora Is a Better Fit
If your team is mainly looking for a technical analytics workspace, Mode Analytics may be a reasonable option to evaluate. But many organizations are solving a broader problem: they need not only analysis, but also governed self-service BI, faster dashboard adoption among business teams, and a path toward AI-assisted decision workflows.
That is where FineBI + Dora becomes especially relevant.
FineBI helps enterprises build a trusted analytics foundation with:
- self-service BI for business users,
- interactive dashboard creation,
- drag-and-drop analysis,
- drill-down and data exploration,
- enterprise data connectivity,
- and dashboard sharing across departments.
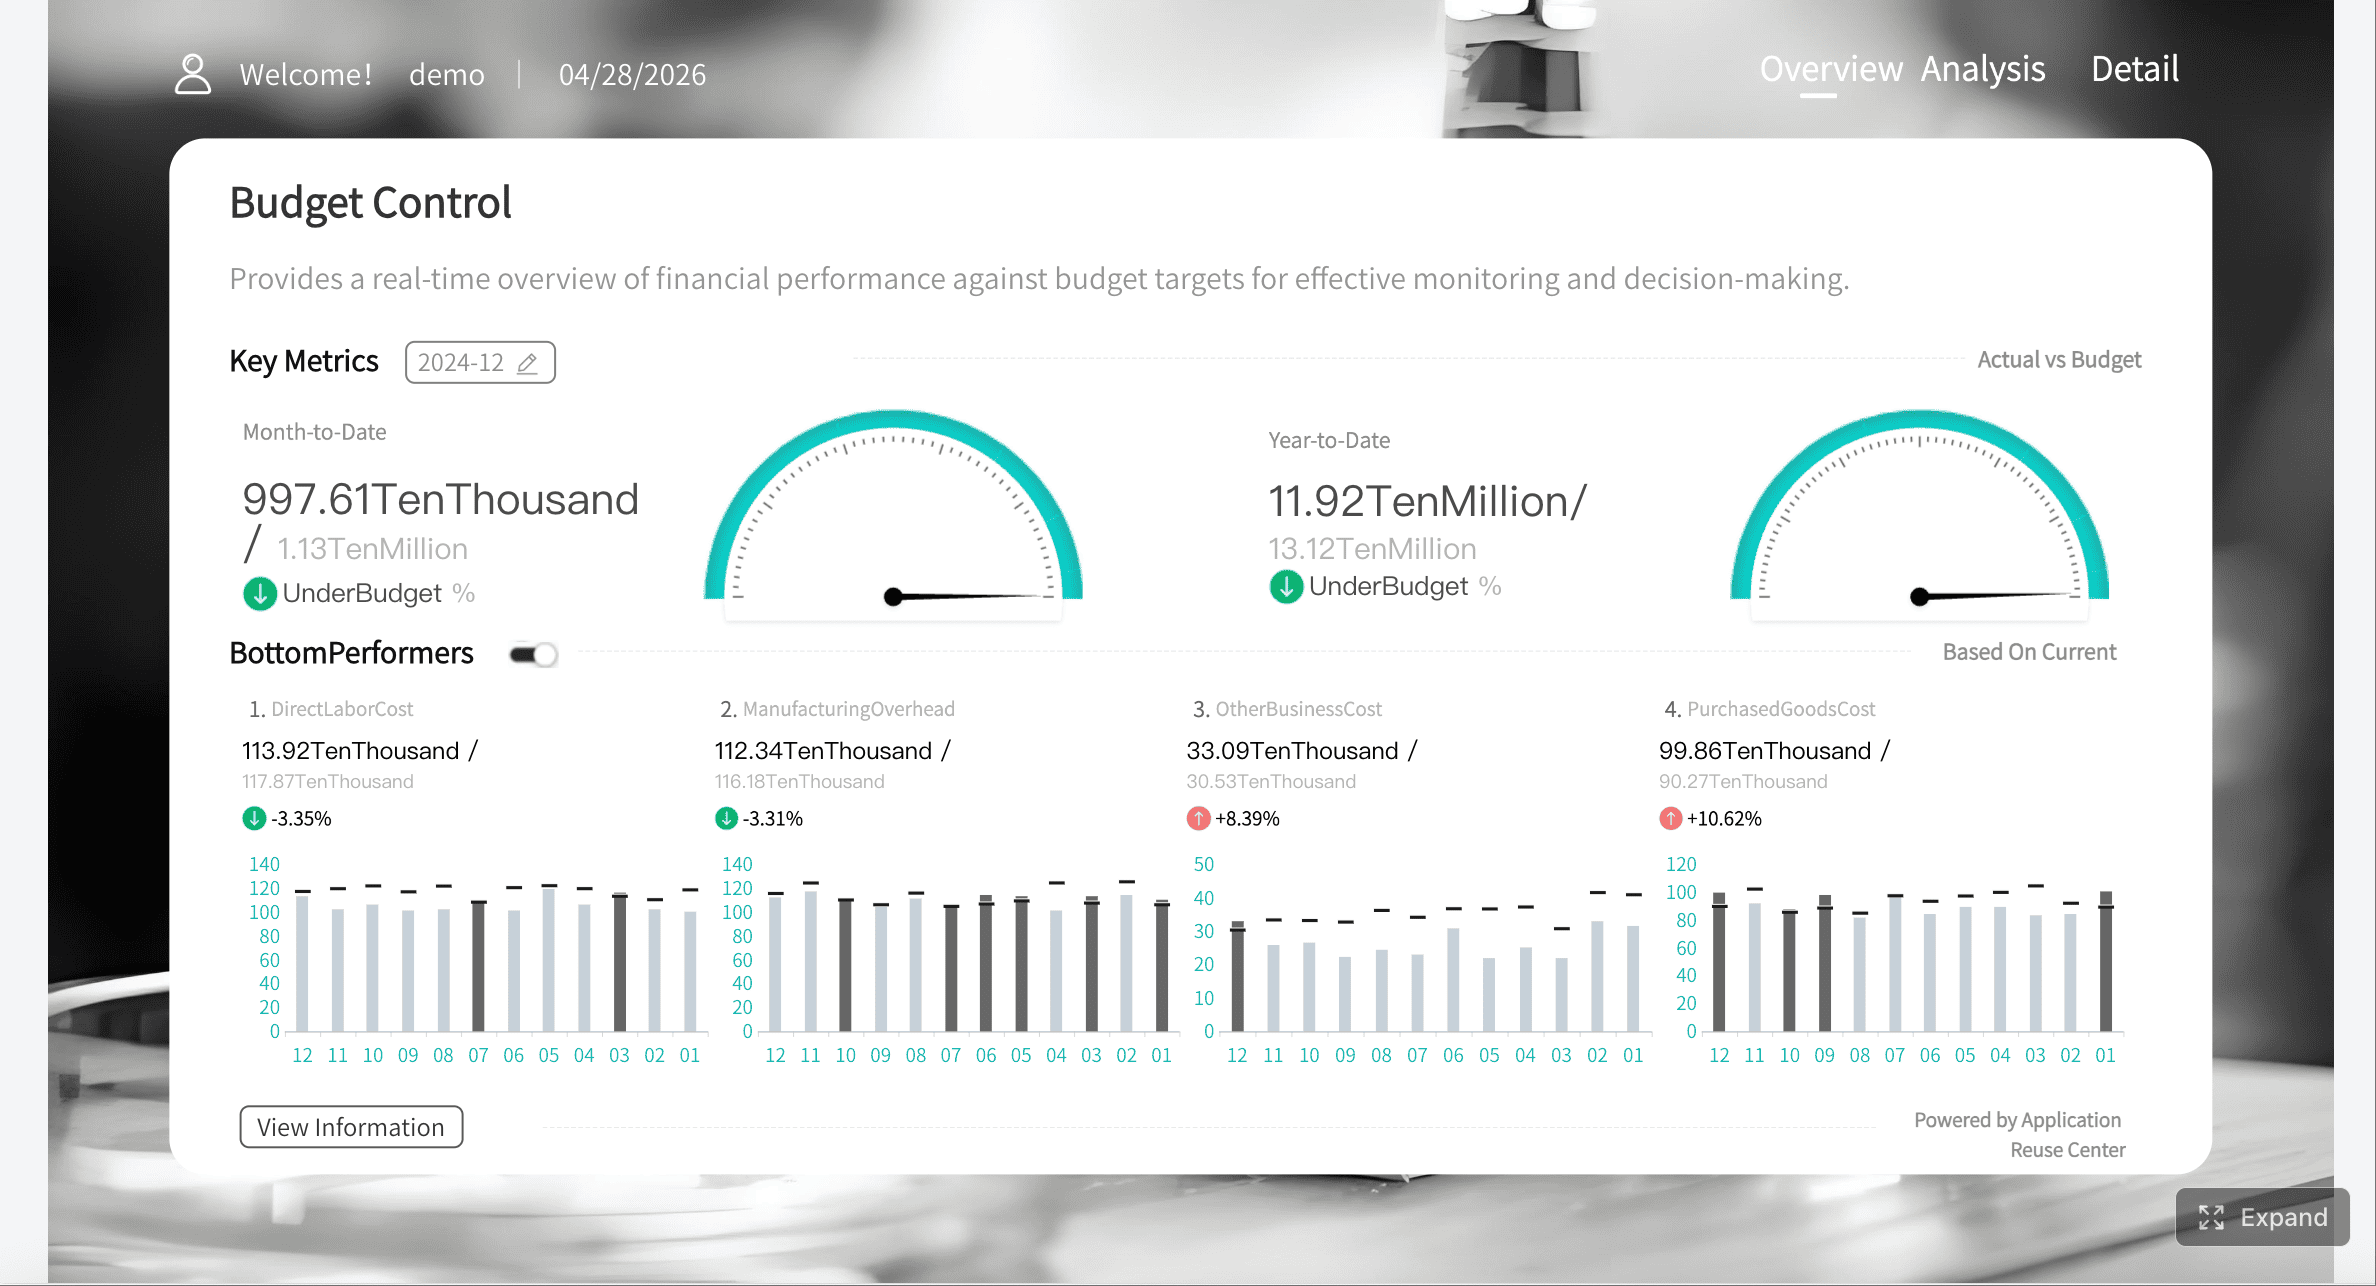
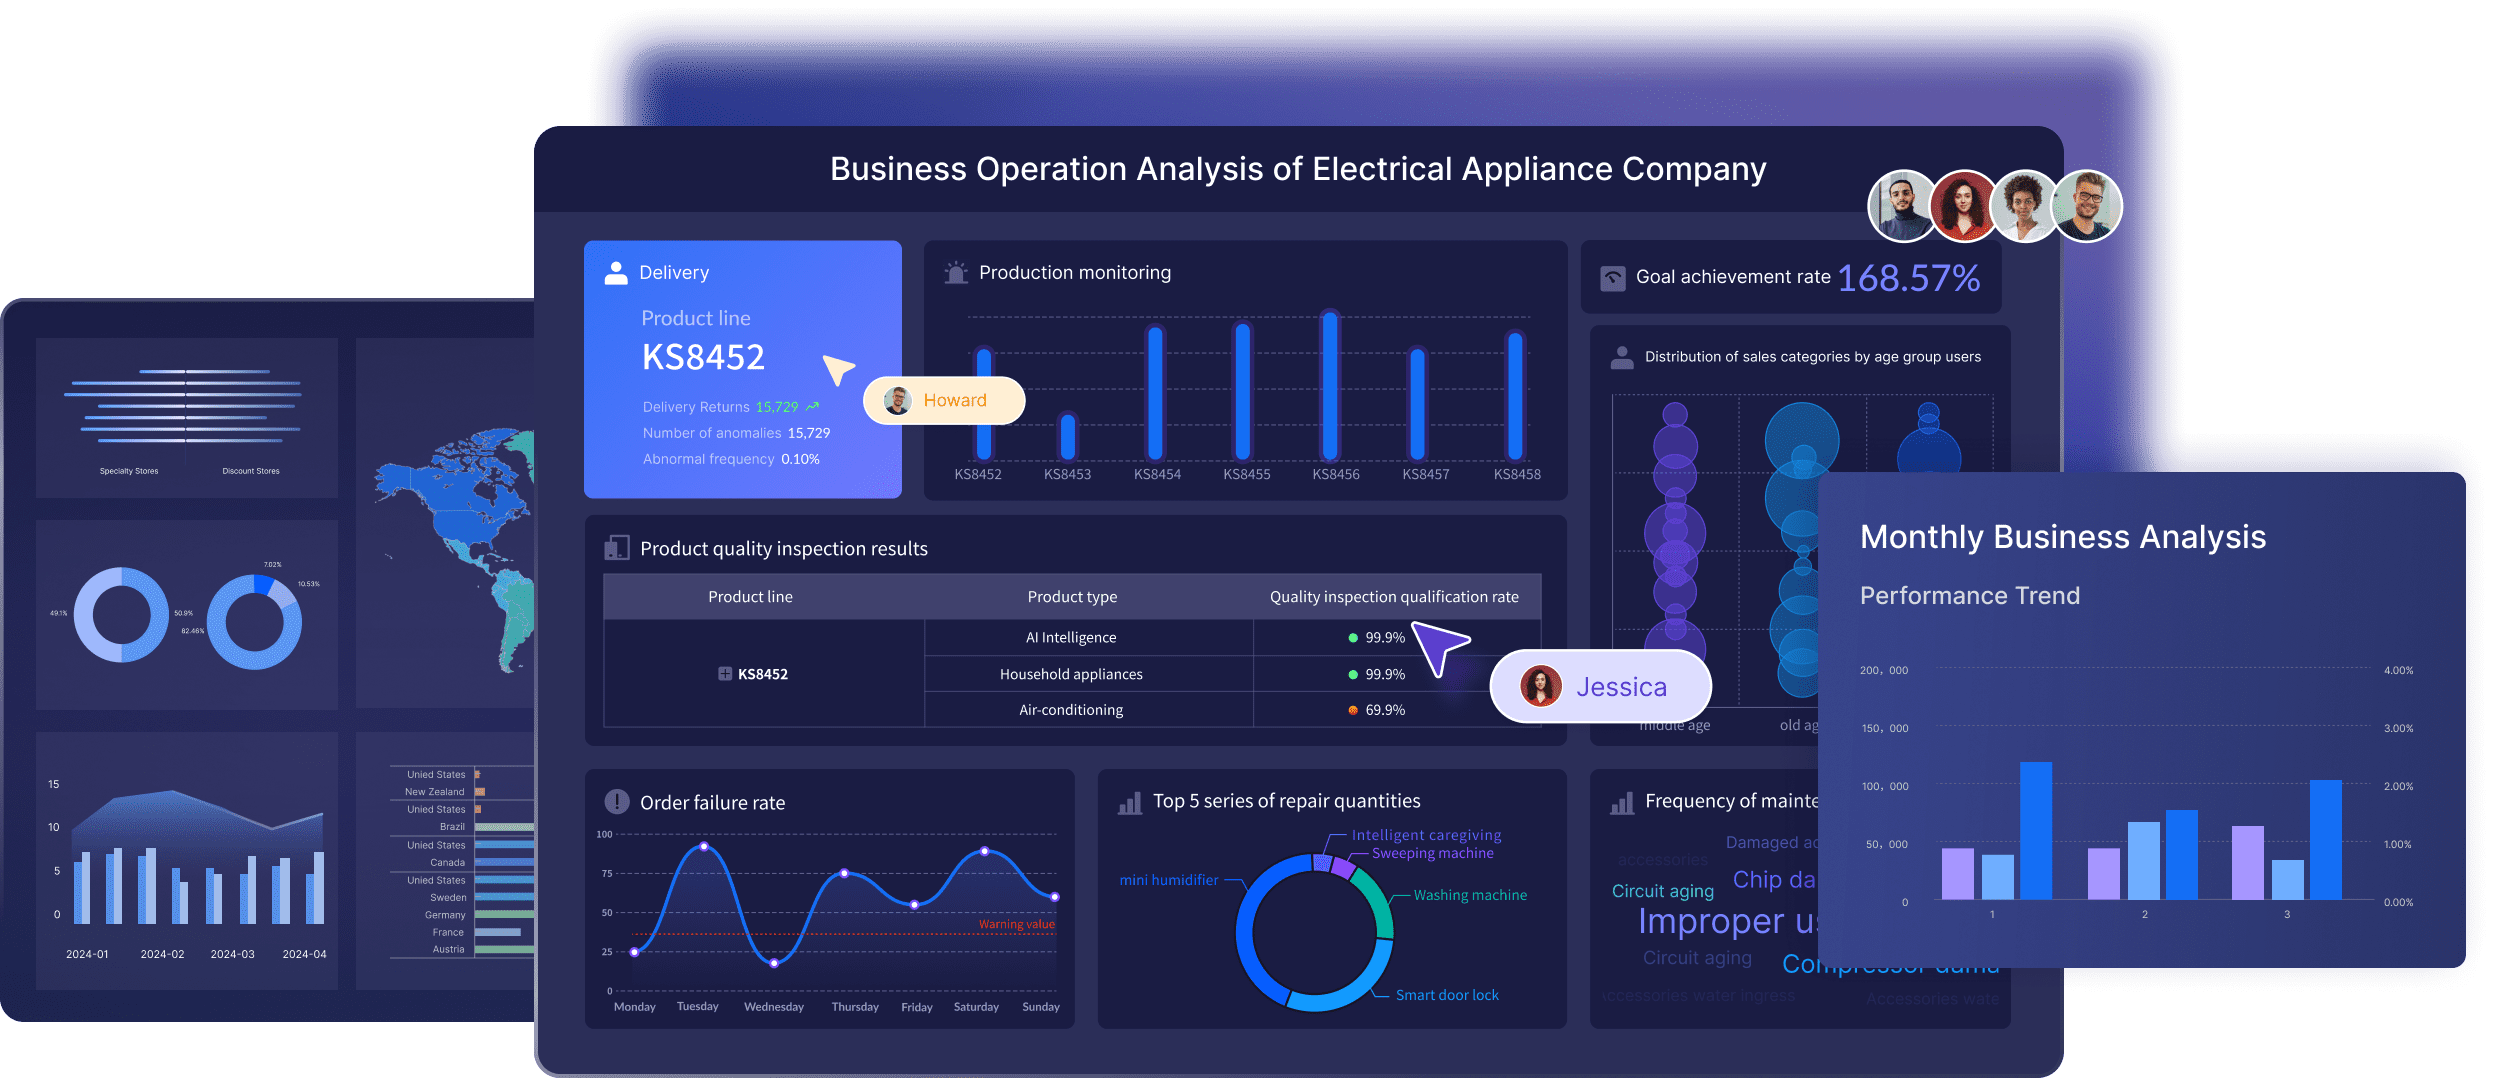
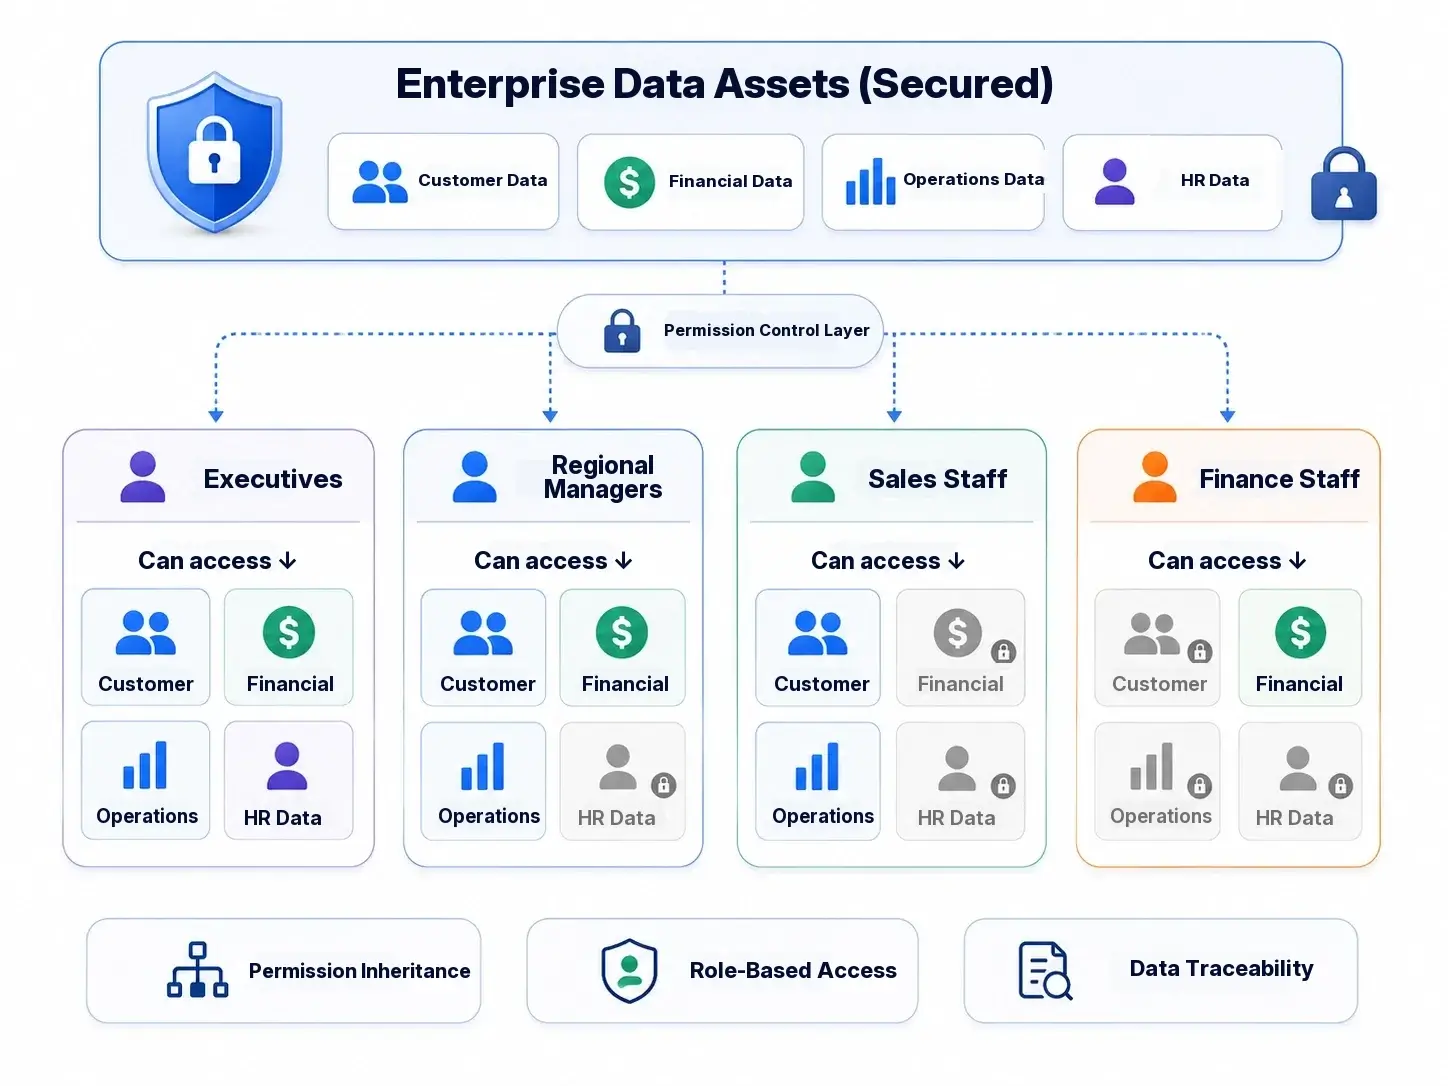
For organizations where finance, sales, operations, HR, and management teams all need easier access to data, this business-user-friendly approach can be easier to scale than an analyst-only model.
Dora adds an enterprise Data Agent layer on top of FineBI and existing enterprise data assets. Instead of acting like a generic chatbot, Dora is positioned as Agentic BI: it connects natural-language requests to a trusted semantic foundation, governed query or skill execution, and then returns answers, charts, summaries, actions, and follow-up.
That means enterprises can move beyond static dashboard viewing toward scenarios like:
- Data Analyst digital employee
- Report Researcher
- Daily Briefing Secretary
- Risk Alert Officer
In practical terms, FineBI builds the trusted dashboard, metric, and semantic foundation, while Dora turns that foundation into a scenario-specific AI assistant or digital employee. Dora can also work in enterprises that already have trusted BI or data assets, but it should not be positioned as a replacement for FineBI.

Get Ready-to-Use Dashboard Templates in Fine Gallery
Final Thoughts on Mode Analytics
Mode Analytics is a well-known platform for teams that want to combine SQL-based analysis, advanced notebook workflows, and dashboard sharing in one environment. It is especially relevant for technical teams that already work close to the data warehouse and need flexible analytical workflows.
But the right platform depends on your users and your goals.
If your priority is analyst-led exploration, Mode deserves consideration. If your priority is broad business-user self-service, governed dashboard adoption, and a path toward enterprise AI assistants built on trusted analytics, then FineBI + Dora is also worth evaluating carefully.
FAQs
Mode Analytics is used for querying data, running deeper analysis, building visualizations, and sharing dashboards in one platform. It is especially useful for teams that want to move from ad hoc analysis to repeatable reporting quickly.