A strong template for financial report is not just a formatting convenience. It is a decision system for finance leaders, operations directors, and management teams who need to understand performance fast, spot risks early, and act before small issues become cash or profitability problems. Monthly management reporting exists to convert raw accounting data into a clear operating narrative: what happened, why it happened, what it means, and what must happen next.
Click To Try The Dashboard
All reports in this article are built with FineReport
What a template for financial report should include
A practical monthly management report must serve decision-makers, not just accountants. That means the report should help executives, department heads, and finance teams evaluate business health in one structured package. The best templates reduce ambiguity, standardize monthly review routines, and ensure every report answers the same core questions: Are we performing to plan? Is cash under control? Where are the exceptions? What decisions are needed now?
The purpose of monthly management reporting and who the report is for
Monthly management reporting is designed for internal stakeholders who need operational visibility. Typical users include:
CFOs and finance managers
CEOs and executive teams
Operations directors
Department heads
Business unit leaders
Board members in summary form
Unlike year-end reporting, monthly management reports are action-oriented. They help leadership teams:
Monitor business performance against targets
Identify profitability and cost shifts quickly
Track cash sufficiency and liquidity risk
Explain major variances versus budget or forecast
Align departments on corrective actions
A well-designed template for financial report gives each audience the right level of detail. Executives need fast summaries and exceptions. Finance teams need traceable numbers. Department leaders need functional performance and ownership of actions.
The core sections every report needs: summary, performance, cash, variance, and outlook
Every monthly management reporting template should include these essential sections:
Executive summary: A concise overview of performance, risks, and decisions needed
Performance review: Revenue, margin, cost, and profitability results
Cash position: Cash balance, operating cash flow, liquidity, and runway
Variance analysis: Budget vs actual and prior-month comparisons with explanations
Forward outlook: Forecast revisions, scenario assumptions, and near-term risks
These sections work together. A report that shows revenue decline without margin impact, cash effect, or management response is incomplete. Good templates connect each section into one story.
The difference between internal management reports and formal financial statements
This distinction matters. Internal management reports and formal financial statements are not the same thing.
Internal management reports are:
Built for decision-making
Flexible in format
Often include KPIs, commentary, and department-specific cuts
Focused on speed, trends, and actions
Tailored to internal audiences
Formal financial statements are:
Built for compliance, audit, or external reporting
Structured under accounting standards
Less flexible in presentation
Focused on accuracy and disclosure
Intended for investors, regulators, lenders, or statutory use
Your monthly management report should use statement data, but go beyond it. It should translate accounting outputs into operational insights.
Recommended monthly management report layout
The ideal monthly report layout balances speed, clarity, and drill-down capability. Decision-makers should be able to scan the first page in minutes, then move into supporting analysis only when needed.
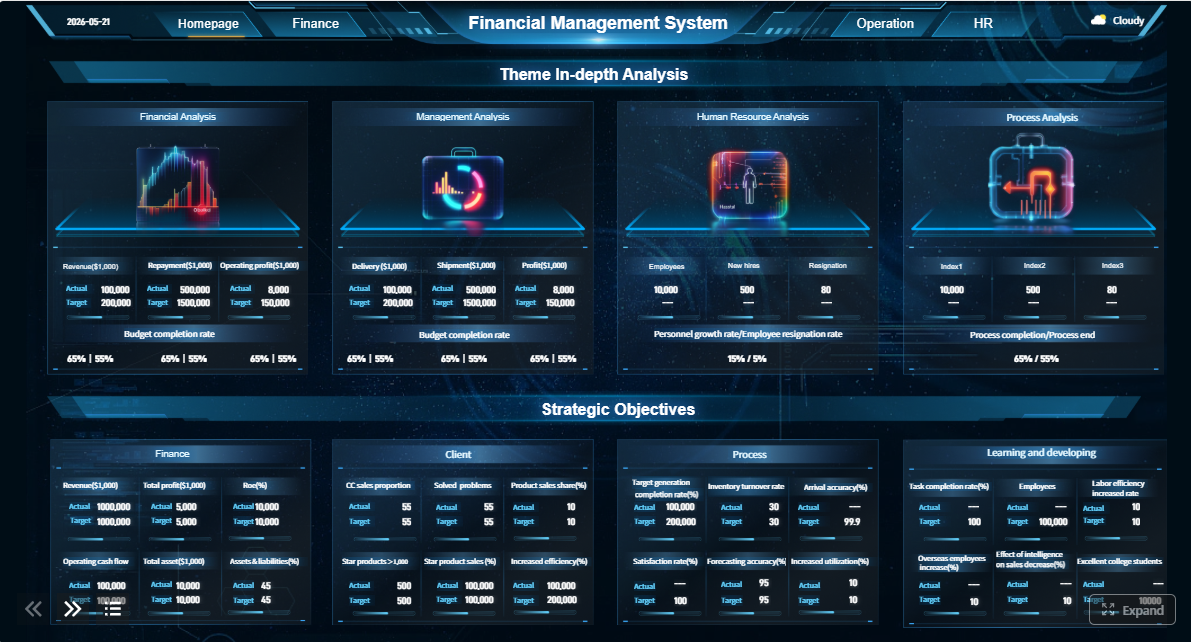
The KPI dashboard is the visual center of the monthly report. It should summarize current performance, trend direction, and exception areas without overwhelming the reader.
Revenue, gross margin, operating expenses, EBITDA, cash balance, and runway
These are the core metrics most management teams expect to see. Your dashboard should typically include:
Revenue: Total recognized revenue for the month and year-to-date
Gross margin: Gross profit as a percentage of revenue
Operating expenses: Selling, general, administrative, and other operating costs
EBITDA: Earnings before interest, taxes, depreciation, and amortization
Cash balance: Closing cash position at month-end
Runway: Months of cash remaining based on current burn rate
Trend views, target comparisons, and variance highlights
A KPI dashboard becomes useful when it adds context. Every metric should be shown with at least one of the following:
Month-over-month trend
Year-to-date view
Budget or target comparison
Prior-year comparison
Variance flag or threshold alert
Key Metrics (KPIs)
Revenue growth: Measures top-line expansion compared with prior month, budget, or prior year.
Gross profit margin: Shows how efficiently the company converts revenue after direct costs.
Operating margin: Indicates operating profitability before financing and tax impact.
Net profit margin: Reflects bottom-line earnings as a percentage of revenue.
EBITDA: A common management metric for evaluating operating performance.
Operating expenses ratio: Compares operating expenses to revenue to assess cost discipline.
Cash balance: Shows immediate liquidity available at period end.
Operating cash flow: Measures cash generated or used by core operations.
Free cash flow: Indicates cash left after capital expenditures.
Current ratio: Assesses short-term ability to cover current liabilities with current assets.
Quick ratio: Measures near-term liquidity excluding less-liquid current assets.
Cash runway: Estimates how long cash will last at current net burn levels.
Budget vs actual variance: Highlights where performance differs from plan in value and percentage terms.
Forecast accuracy: Measures how closely prior forecasts matched actual results.
Rolling 12-month outlook: Provides a forward-looking performance and liquidity view.
A management report should not reproduce full financial statements blindly. It should surface the most decision-relevant line items and trends from each statement.
Income statement, balance sheet, and cash flow highlights
At minimum, include:
Revenue, gross profit, operating expenses, and net income from the income statement
Cash, receivables, payables, debt, and equity highlights from the balance sheet
Operating, investing, and financing cash flow highlights from the cash flow statement
Present these as summarized tables with commentary-ready line items. Leaders do not need a 10-page ledger format for monthly review.
Month-over-month and budget-versus-actual comparisons
For each statement view, show comparisons that answer two different questions:
Month-over-month: What changed since the last reporting period?
Budget-versus-actual: Are we performing to plan?
This dual comparison helps distinguish normal seasonality from execution problems.
Any significant movement should be explained in business terms. For example:
Revenue shortfall caused by delayed renewals in one region
Margin compression driven by unfavorable product mix
Expense increase tied to planned hiring or unplanned vendor costs
Cash decline caused by inventory build or receivables aging
Follow-up actions, owners, and next-step deadlines
Each issue should have a next step. Add a simple action tracker with:
Issue
Recommended action
Owner
Deadline
Status
This prevents monthly reporting from becoming a passive review exercise.
KPIs to track in a monthly financial report
The right metrics depend on business model, scale, and stakeholder needs. Still, most companies should track a core set of profitability, liquidity, and forecasting KPIs every month.
Profitability and efficiency metrics
Profitability metrics show whether growth is translating into earnings. Efficiency metrics reveal whether departments and functions are using resources productively.
Gross profit margin, net profit margin, operating margin, and return on assets
Focus on these measures:
Gross profit margin: Tracks pricing power and direct cost control
Operating margin: Shows profit after operating costs but before financing and tax
Net profit margin: Captures final profitability after all expenses
Return on assets: Indicates how effectively assets are generating earnings
These metrics matter because revenue alone can hide margin deterioration. A company can grow sales and still weaken financially if cost structure worsens.
Cost ratios and productivity indicators by function or department
For better management insight, layer in functional ratios such as:
Sales and marketing expense as a percentage of revenue
G&A expense ratio
Revenue per employee
Profit per department or business unit
Cost per order, project, or service transaction
Cash flow and liquidity metrics
Cash is often the most urgent management concern. A business can survive temporary margin pressure more easily than a liquidity crisis.
Operating cash flow, free cash flow, current ratio, quick ratio, and cash conversion cycle
Track these closely:
Operating cash flow: Whether core business operations are generating cash
Free cash flow: Cash after capital expenditure commitments
Current ratio: Current assets divided by current liabilities
Quick ratio: Liquid current assets divided by current liabilities
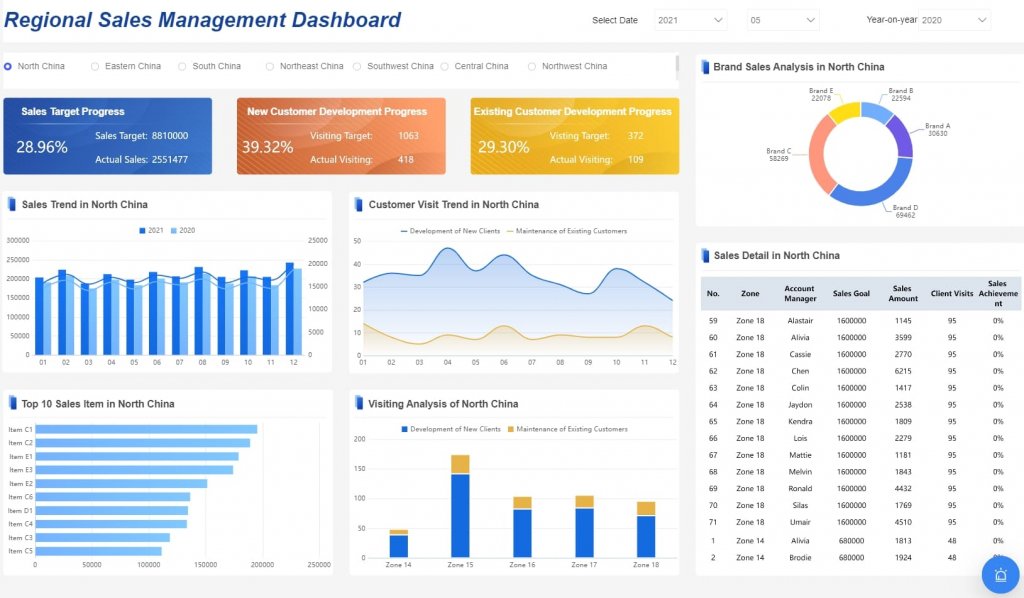
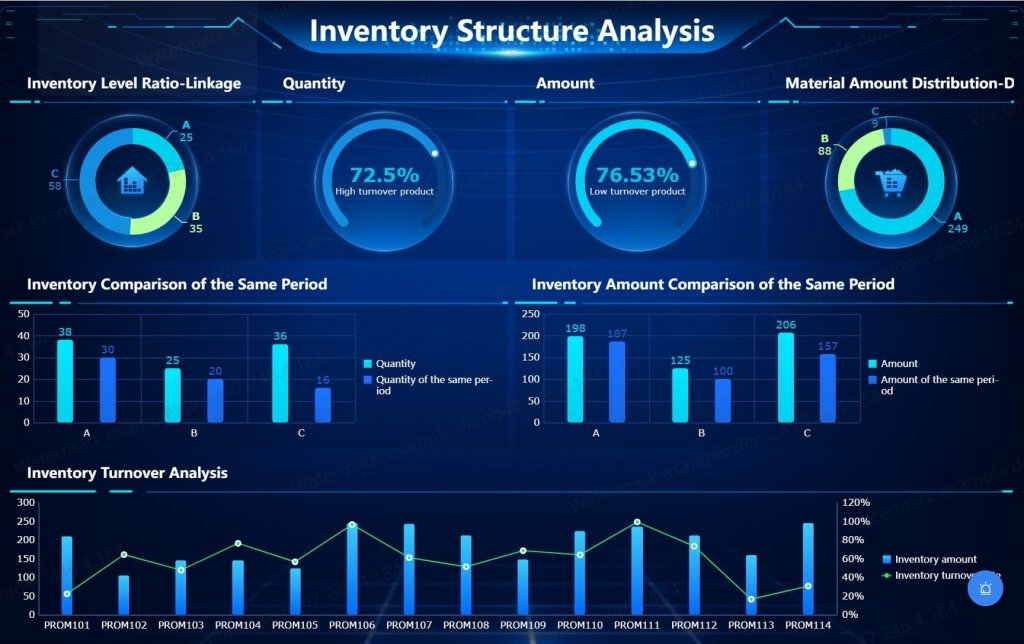
How to build an executive dashboard that supports decisions
An executive dashboard should reduce friction, not create it. Too many dashboards fail because they present everything finance can calculate instead of the few items leadership must act on.
Choose visuals that match the question
Use the simplest visual that answers the business question clearly.
Use line charts for trends over time
Use bar charts for budget vs actual or category comparisons
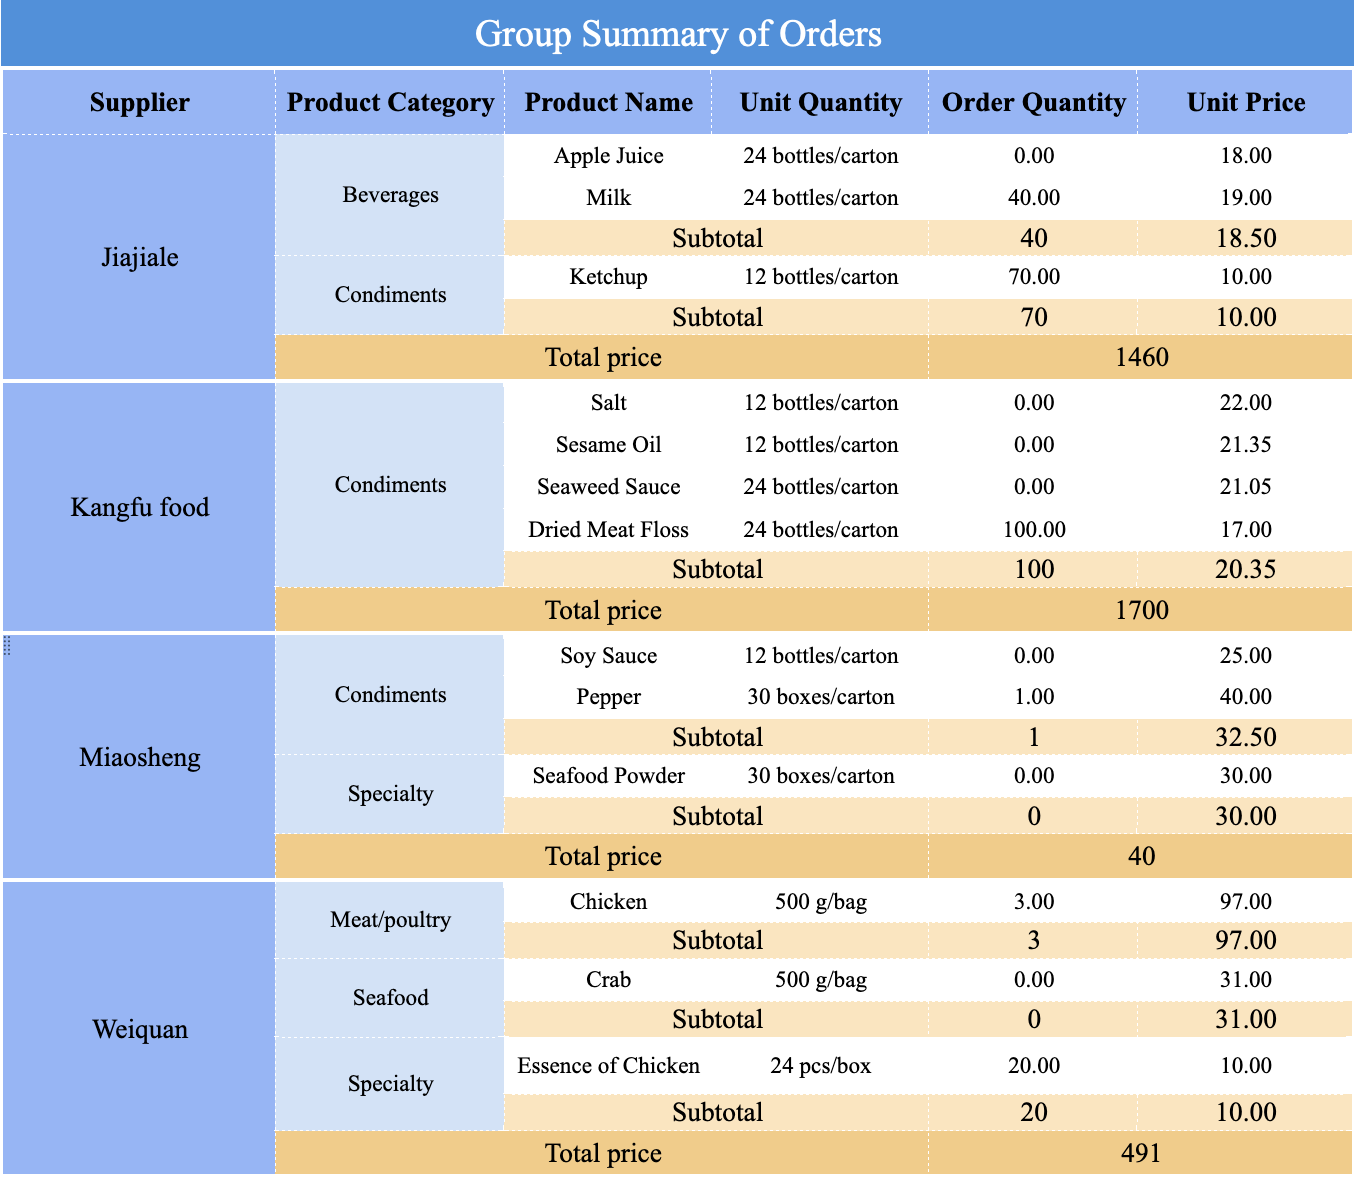
Use tables when exact values matter
Use heat maps for threshold breaches or entity-level comparisons
Use scorecards for top KPI snapshots
Avoid decorative visuals. If a chart does not improve clarity, remove it.
Keep the dashboard focused
Executives need signal, not noise. Limit the dashboard to the most decision-relevant measures and group them logically:
Financial health: Cash, liquidity, working capital
Most organizations start with spreadsheets, then eventually outgrow them. The right template approach depends on reporting complexity, data volume, and how often stakeholders need refreshed views.
Spreadsheet-based reporting options
Spreadsheets still work well for smaller teams, early-stage businesses, or highly flexible modeling needs.
When Excel-based financial management templates are useful for flexible modeling
Common mistakes to avoid in monthly management reporting
Even good finance teams weaken reporting value by making the same structural mistakes.
Overloading the report with metrics that do not drive decisions: More data does not equal better management. Prioritize metrics tied to action.
Mixing inconsistent definitions across departments or periods: If one team defines EBITDA or headcount differently, trust breaks down fast.
Reporting numbers without explanations, context, or recommended actions: Numbers alone do not guide decisions.
Failing to connect KPIs, statements, and the executive dashboard into one story: A report should explain how profitability, cash, and forecast interact.
Best practices for implementing a monthly management reporting template
If you want a finance reporting process that leadership actually uses, follow these steps:
Define the decision agenda first
Start by identifying what executives must decide each month: hiring pace, spend control, pricing, collections, inventory, or investment priorities. Then build the report backward from those decisions.
Lock KPI definitions before automating anything
Standardize formulas, owners, reporting periods, and exception thresholds. This prevents recurring debate and protects reporting credibility.
Design a one-page executive view before adding detail
Force clarity. If the leadership team cannot understand performance from page one, the report is too complex.
Build variance commentary into the workflow
Require owners to explain major changes, not just submit numbers. Root-cause commentary is what turns reporting into action.
Create a monthly review cadence with deadlines and ownership
Assign responsibility for data refresh, validation, commentary, executive sign-off, and action tracking. Consistency matters more than elegance.
Build a better template for financial report with FineReport
Building this manually is complex; use FineReport to utilize ready-made templates and automate this entire workflow.
When reporting lives in disconnected spreadsheets, finance teams spend too much time collecting files, reconciling formulas, updating charts, and reformatting outputs for each audience. That slows decision-making and increases the risk of reporting errors exactly when leadership needs speed and confidence.
FineReport helps teams standardize the full monthly management reporting cycle by enabling:
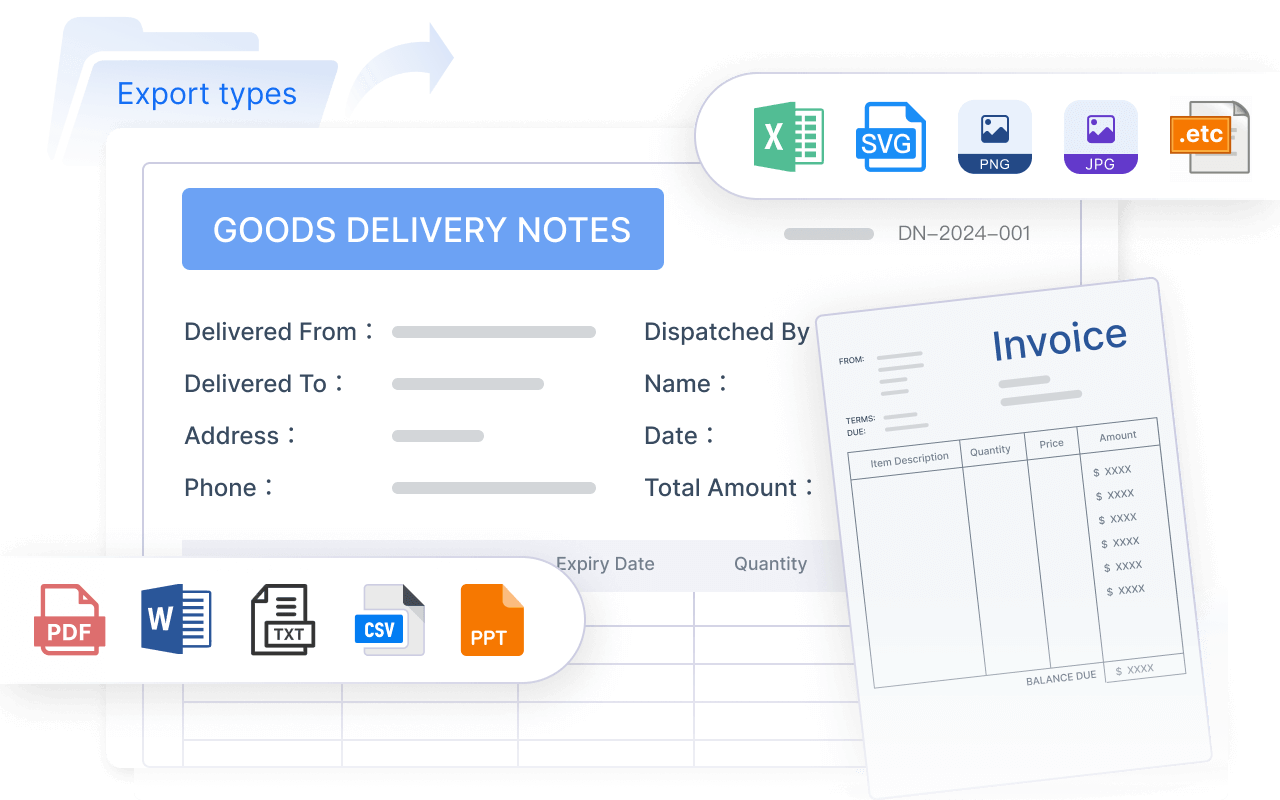
Multi-format output for dashboards, PDF, and presentations
Role-based views for executives, finance, and department heads
Consistent monthly refresh with centralized data logic
Get Ready-to-Use Dashboard Templates in Fine Gallery
For enterprise teams, that means less manual reporting work, faster executive review cycles, and stronger trust in the numbers. Instead of rebuilding the same template for financial report every month, your team can focus on analysis, risk detection, and action.
If your current monthly reporting process is too manual, too slow, or too fragmented, this is the moment to move from static templates to an automated management reporting system.
A strong monthly financial report template usually includes an executive summary, KPI dashboard, profit and loss performance, cash position, variance analysis, and forward outlook. These sections help management understand results, risks, and required actions quickly.
Management reports are built for internal decision-making and focus on trends, KPIs, commentary, and actions. Formal financial statements are structured for compliance, audit, and external reporting under accounting standards.
Most teams track revenue, gross margin, operating expenses, EBITDA, cash balance, and cash runway. Budget versus actual variance and trend views are also important for spotting issues early.
It should be short enough for executives to review quickly, with the first page covering the key story and exceptions. Detailed supporting analysis can sit behind the summary in later pages or dashboard drill-downs.
Yes, the best templates keep a consistent core structure while adapting KPIs, commentary, and detail levels for each audience. A CFO, department head, and board member often need the same data presented in different ways.
Product Trial
FineReport
Pixel-perfect reports · Interactive dashboards · Easy data entry · Digital twins