KPI dashboard tools help enterprises turn scattered business metrics into visible, actionable signals. Instead of waiting for someone to manually compile spreadsheets or explain performance changes in a meeting, teams can monitor operational cockpits, review trusted reports, and respond faster when targets drift.
For enterprise decision-makers, the need is no longer just dashboard visibility. It is also about upgrading report consumption with AI. With FineReport + Dora, teams can ask for a report summary in chat, generate structured narratives from trusted report assets, receive scheduled briefings, and push exceptions to the right owner.
Click To Try The Dashboard
All reports in this article are built with FineReport
What KPI dashboard tools are and why enterprises use them
KPI dashboard tools are software platforms that collect, organize, and display key performance indicators in a visual format. In plain language, they help teams see whether the business is on track or off track without digging through raw tables, disconnected systems, or static spreadsheets.
A good KPI dashboard tool turns raw metrics into business signals such as:
sales pipeline falling behind target
cash collection slowing down
production defects rising above threshold
customer support backlog growing
headcount capacity not matching business demand
This matters because enterprise teams do not just need data. They need timely visibility, consistent KPI definitions, and a reliable way to move from metric review to action.
Dashboards, reports, scorecards, and analytics views are not the same
Many buyers use these terms interchangeably, but they serve different purposes.
Dashboard: A visual monitoring interface for ongoing visibility. It shows current status, trends, and exceptions at a glance.
Report: A structured output for deeper review, communication, audit, or recurring management updates.
Scorecard: A goal-tracking view focused on targets, thresholds, and performance against plan.
Analytics view: An exploratory interface for deeper slicing, drilling, and investigation.
In enterprise environments, all four can coexist. A sales leader may watch a dashboard daily, review a weekly report before a meeting, use a scorecard for quarterly targets, and open an analytics view to investigate a conversion drop.
Enterprises adopt KPI dashboard tools because performance management gets harder as data volume, departments, and reporting requirements grow.
Common business reasons include:
Aligning goals across teams: Everyone sees the same KPI logic and target status.
Spotting risks early: Exception indicators help teams react before issues become expensive.
Supporting faster decisions: Managers do not have to wait for analysts to manually explain basic changes.
Improving accountability: KPIs can be tied to business owners, workflows, and escalation rules.
Standardizing management review: Executives get consistent reports and operational cockpits across business units.
This is where FineReport is especially valuable. It provides the reporting foundation enterprises need for formatted reports, complex reports, operational cockpits, management reports, and reporting workflows. Then Dora adds the enterprise Data Agent layer, helping users query, summarize, monitor, push, and follow up on KPI information using governed AI workflows.
Core features to look for in KPI dashboard tools
Not all KPI dashboard tools are built for enterprise use. Some are lightweight visibility tools. Others are broader BI or reporting platforms. The right choice depends on how much governance, customization, reporting depth, and AI-assisted execution your business requires.
Real-time and scheduled data updates across multiple sources
A KPI dashboard is only useful if the underlying data is current enough for the business decision it supports.
Look for tools that support:
multiple source connections such as ERP, CRM, HR, MES, finance, or spreadsheets
stable refresh processes for recurring dashboards and reports
Report Element: Data refresh cadence Definition: How often dashboard and report data is updated from source systems. Business value: Ensures decisions are based on current and trusted information. AI use:Dora can explain whether a KPI reflects the latest reporting cycle, summarize recent changes, and include refresh-aware commentary in a scheduled briefing.
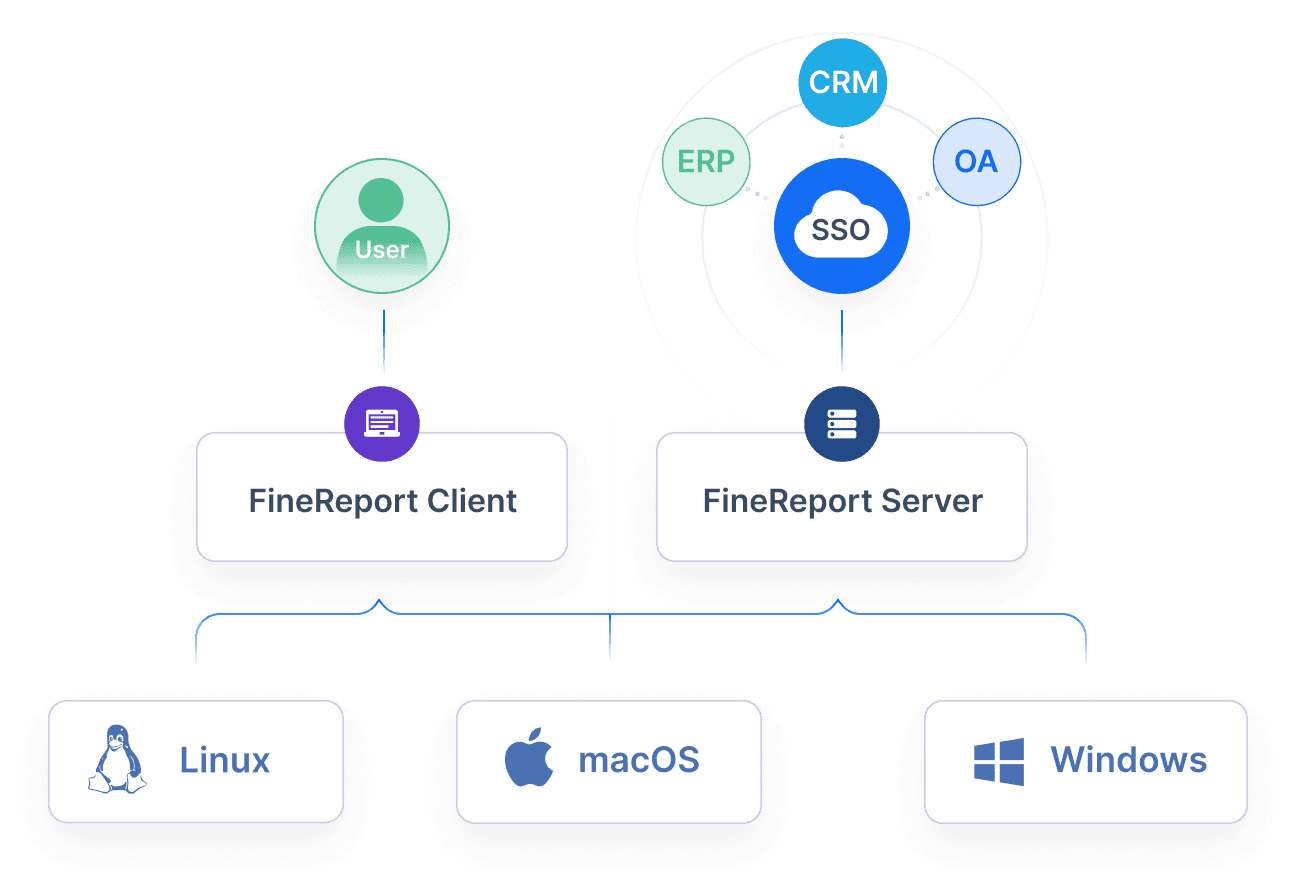
Role-based views, permissions, and governance for cross-functional teams
Enterprise KPI dashboard tools must support different audiences without exposing inappropriate data.
Look for:
role-based dashboard views
row-level or object-level permissions
governed KPI definitions
reusable templates
department-specific or region-specific access controls
Report Element: Permission model Definition: Rules that determine who can view which dashboards, reports, and KPI details. Business value: Protects sensitive data while enabling broad adoption. AI use:Dora can operate within governed access boundaries, returning chart-based answers and structured summaries only from assets the user is authorized to access.
Visualizations, alerts, drill-downs, and mobile access for daily monitoring
The best KPI dashboard tools do more than display charts. They help users notice changes quickly and investigate the cause.
Important capabilities include:
status indicators and thresholds
trend charts and comparisons
exception lists
drill-down to detail records
mobile-friendly access
push notifications or subscriptions
Report Element: Exception alert Definition: A rule that flags KPI values outside expected thresholds or tolerance ranges. Business value: Helps teams prioritize action instead of scanning every metric manually. AI use:Dora can act as a Risk Alert Officer, detect threshold breaches from trusted FineReport assets, summarize what changed, and push alerts to responsible owners for follow-up.
AI-assisted monitoring that helps detect anomalies, summarize trends, and highlight next actions
This is increasingly the differentiator between basic KPI tools and enterprise-ready Agentic BI.
A mature AI monitoring layer should help users:
ask KPI questions in natural language
retrieve trusted reports and dashboards
explain trends and abnormal changes
produce structured report summaries
push scheduled daily or weekly briefings
follow up on exception owners and overdue actions
Report Element: Management summary Definition: A structured narrative explaining KPI movement, risks, and action focus areas. Business value: Saves managers time and improves communication quality. AI use:Dora can generate a structured report summary from FineReport dashboards, chart logic, templates, and business rules rather than relying on raw prompt-only interpretation.
That matters because enterprises need more than an AI chatbot. They need an enterprise Data Agent with governed query, trusted semantics, permissions, and reusable Skills. This is where FineReport + Dora fits particularly well: FineReport provides the trusted reporting and semantic foundation, while Dora adds the AI assistant layer for report consumption, exception monitoring, and follow-up execution.
Dashboards help teams react quickly because they show the latest status in a compact visual form. They are ideal for daily standups, command-center views, operational cockpits, and management snapshots.
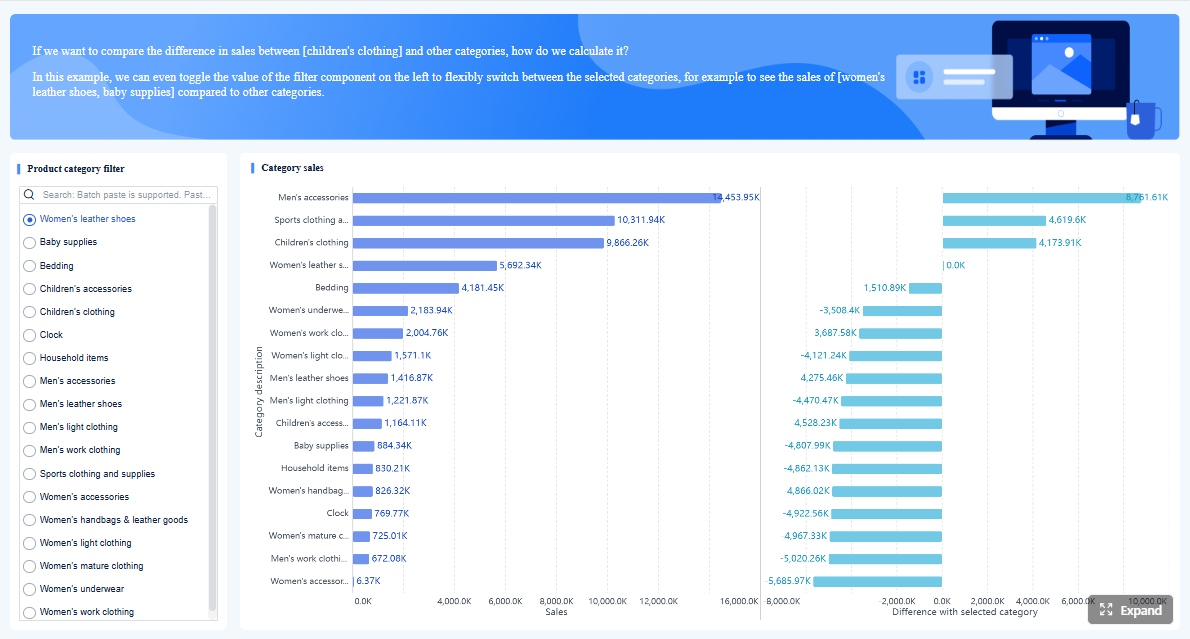
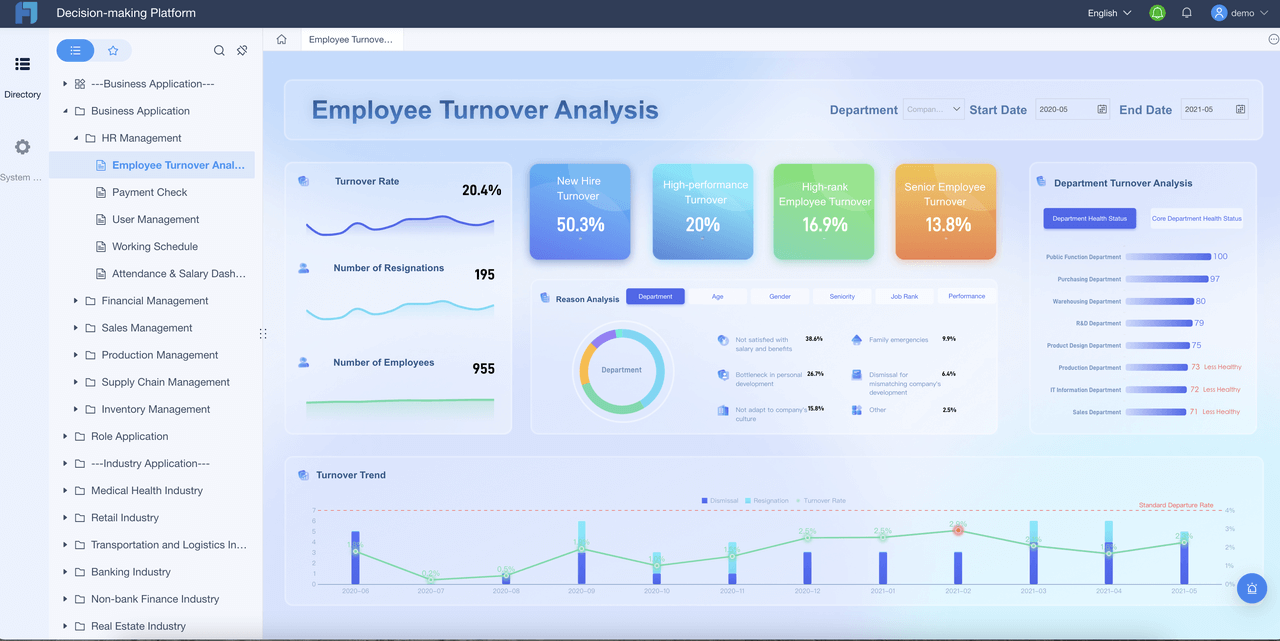
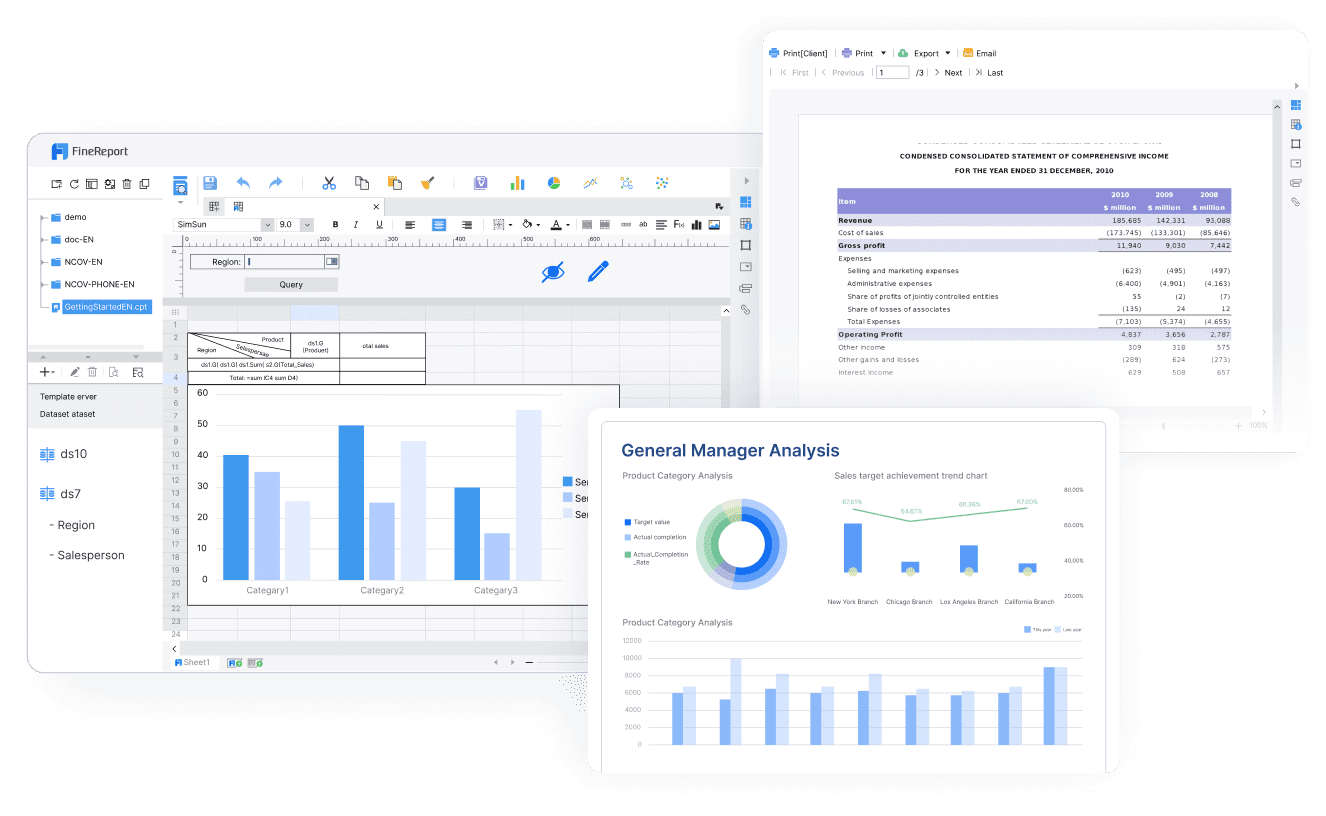
In FineReport, this means building interactive operational cockpits that combine KPIs, trends, status signals, and exception lists in one governed view.
Reports for deeper analysis and communication
Reports are better when the business needs structure, explanation, and historical record.
Use reports for:
weekly or monthly management review
board reporting
audit and compliance documentation
department performance reviews
cross-functional communication
detailed variance analysis
Reports provide more narrative space, more layout control, and more consistency for stakeholders who need formal outputs rather than a live monitoring screen.
FineReport is particularly strong here because it supports formatted reports, complex reports, periodic management reports, and automated reporting workflows. That makes it suitable for enterprises that need both highly visual cockpits and structured reporting packs.
How dashboards and reports work together
The strongest enterprise setup combines both.
A common pattern looks like this:
A dashboard highlights that a KPI is off target.
A manager drills down or opens a linked report for detail.
The report provides breakdowns, context, and commentary.
Dora summarizes the issue, identifies exceptions, and pushes follow-up tasks.
The next management briefing includes an updated narrative and action status.
This is why dashboard tools should not be evaluated in isolation. The enterprise question is not just, "Can it visualize KPIs?" It is, "Can it support monitoring, reporting, explanation, governance, and action at scale?"
Common KPI dashboard examples across business functions
Different functions need different KPI views, but the design principles are similar: clear definitions, business ownership, thresholds, and a repeatable review cadence.
Executive and company-wide performance dashboards
Executive KPI dashboards usually focus on a small set of strategic indicators.
Common executive KPIs include:
revenue vs. target
gross margin
operating efficiency
order growth
cash flow status
regional performance
strategic initiative progress
Report Element: Revenue vs. target Definition: Actual recognized revenue compared with planned revenue for a given period. Business value: Shows whether growth objectives are being met. AI use:Dora can summarize regional gaps, explain trend changes, and prepare a scheduled executive briefing.
Report Element: Gross margin Definition: Revenue minus direct costs, expressed as value or percentage. Business value: Reveals profitability quality, not just top-line growth. AI use:Dora can highlight margin compression, compare business units, and surface products or regions needing review.
Report Element: Strategic initiative progress Definition: Status of major projects or transformation goals against milestones. Business value: Helps executives connect performance outcomes with execution progress. AI use:Dora can combine KPI movement with progress notes and generate meeting-ready narratives.
Sales, marketing, and customer success dashboards
Revenue teams need a balance of forward-looking and outcome metrics.
Common examples include:
pipeline coverage
lead-to-opportunity conversion
campaign ROI
customer acquisition cost
renewal rate
churn rate
net revenue retention
customer satisfaction and SLA performance
Report Element: Pipeline health Definition: Current sales opportunity volume, stage distribution, and coverage against target. Business value: Indicates whether future revenue is strong enough to support plan. AI use:Dora can answer natural-language questions about stage drop-off, regional weakness, and overdue deals from trusted FineReport sales reports.
Report Element: Campaign performance Definition: Results of marketing campaigns across traffic, leads, conversion, and cost. Business value: Helps teams allocate budget toward effective channels. AI use:Dora can generate chart explanations, compare campaign periods, and prepare a weekly marketing summary.
Report Element: Retention and service quality Definition: Metrics such as renewal rate, CSAT, first response time, and backlog. Business value: Protects recurring revenue and customer experience. AI use:Dora can detect anomalies, push service risk alerts, and notify owners when service KPIs move outside defined thresholds.
Report Element: Defect rate Definition: Percentage of products or processes that fail quality standards. Business value: Impacts cost, customer satisfaction, and operational stability. AI use:Dora can act as a Risk Alert Officer, summarize abnormal defect increases, and push alerts to quality owners.
Report Element: Cash flow status Definition: Current inflow, outflow, and liquidity position over a defined period. Business value: Supports treasury visibility and financial control. AI use:Dora can generate finance-friendly summaries from trusted FineReport reports and flag overdue receivables or unfavorable changes.
Report Element: Workforce capacity Definition: Available staffing compared with workload or production demand. Business value: Helps balance labor cost and operational throughput. AI use:Dora can include workforce bottlenecks in management briefings and explain where staffing pressure may affect service or production KPIs.
How an AI Data Agent Automates Report Consumption
Traditional KPI dashboard tools solve visibility. They do not fully solve the work of consuming, explaining, and acting on reports. That is where Dora adds measurable enterprise value.
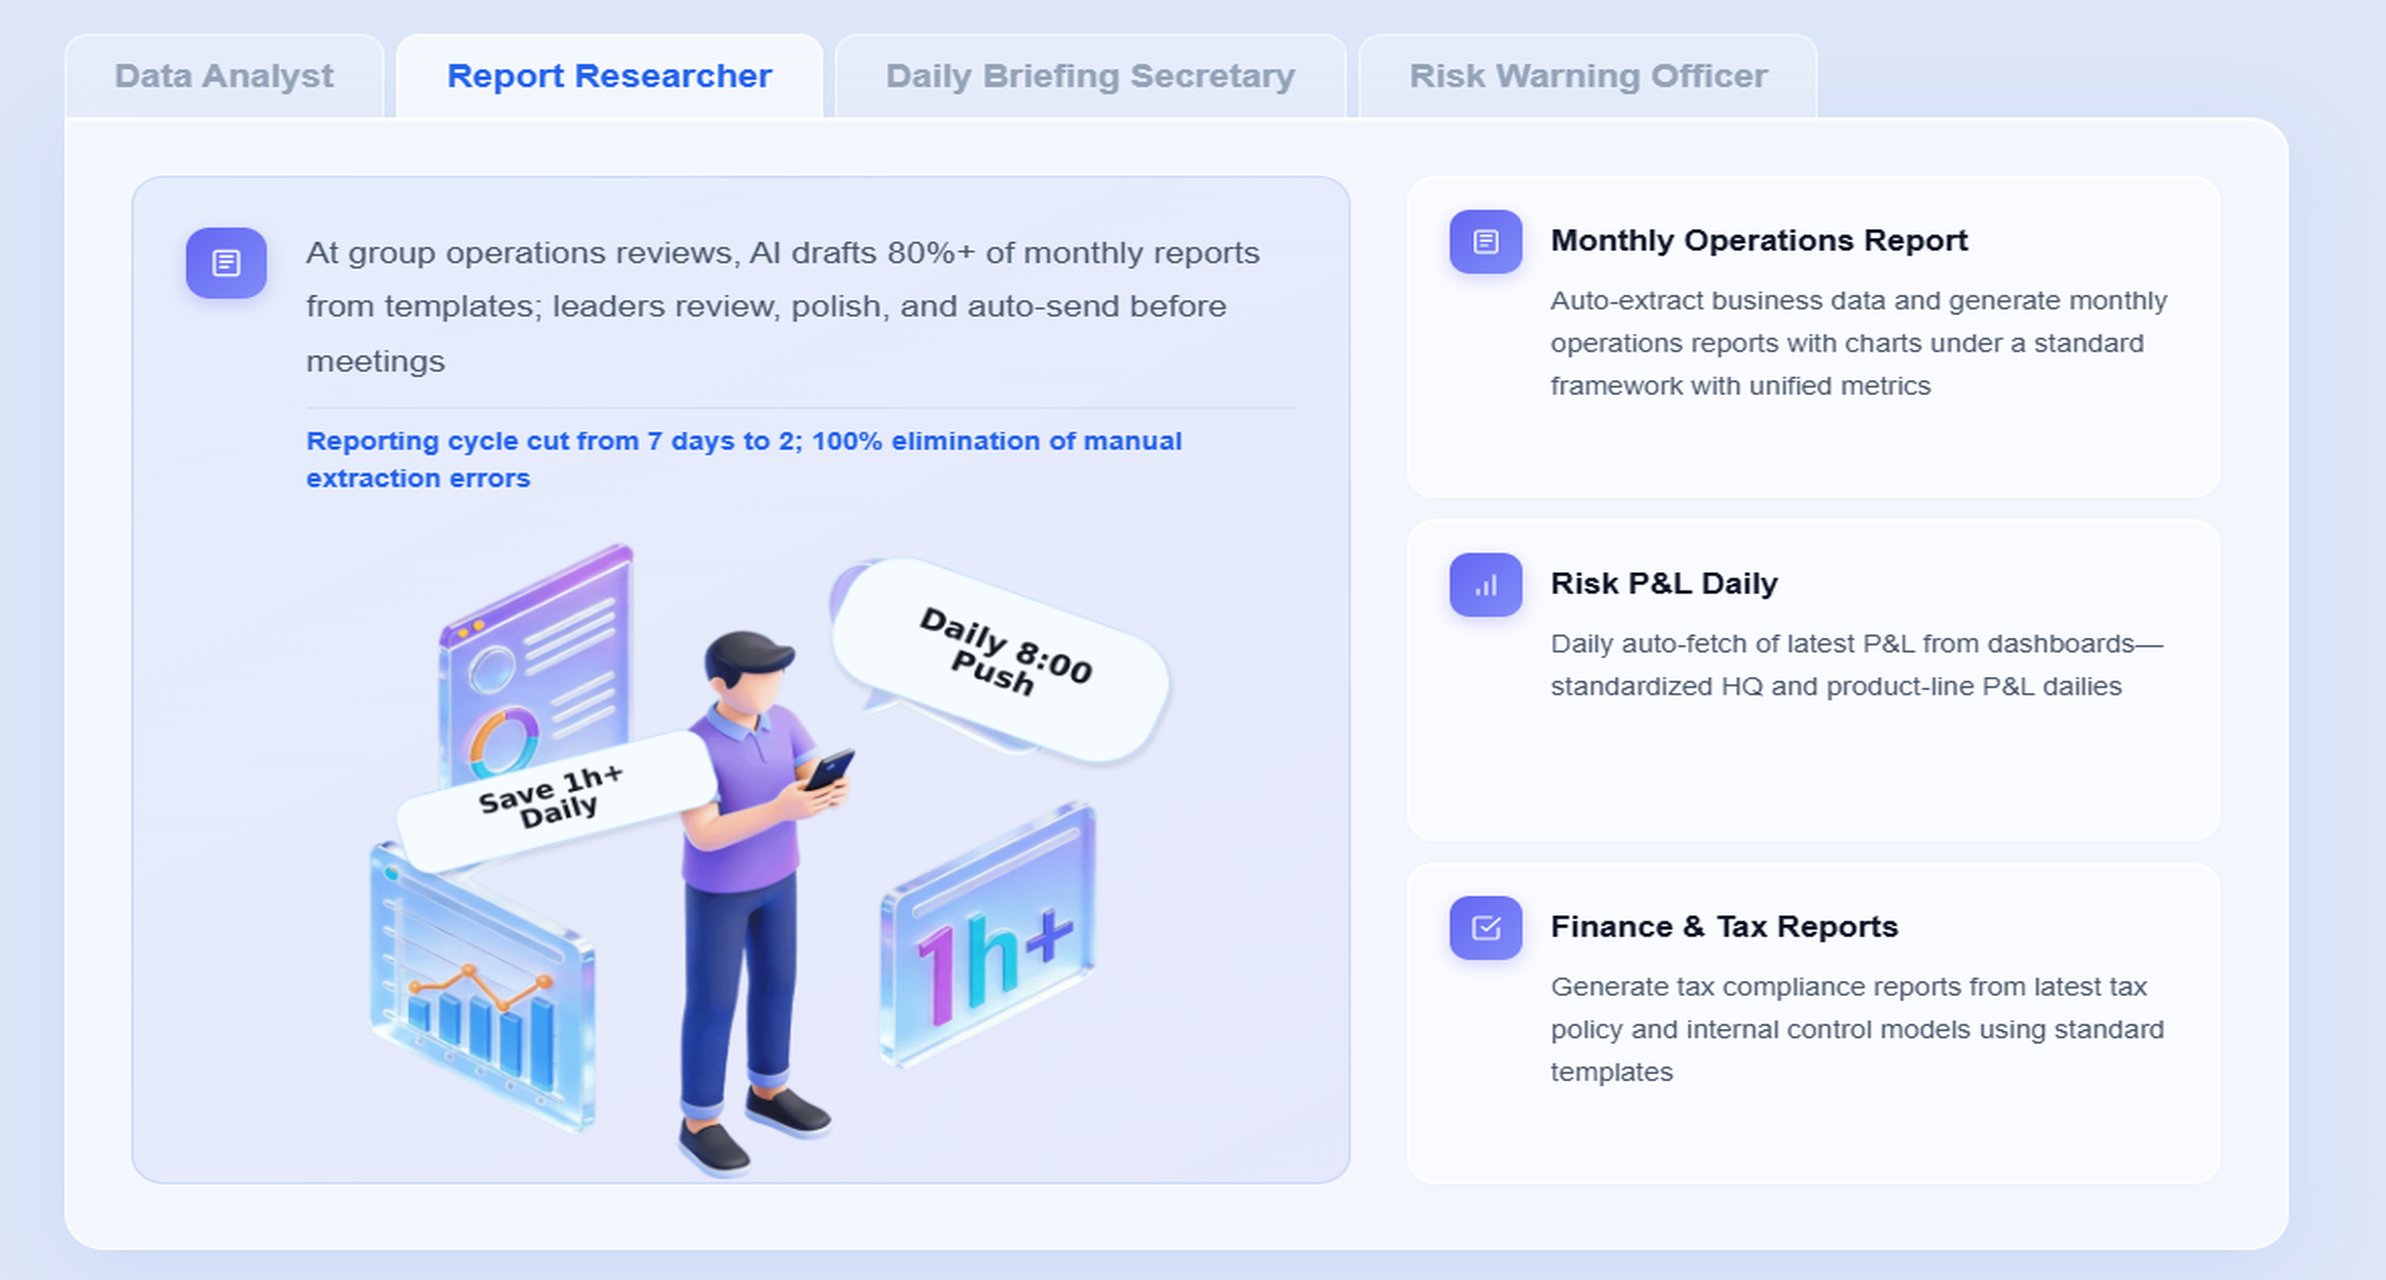
Dora is FanRuan’s enterprise Data Agent platform. It sits on top of FineReport and existing enterprise data/report assets as an AI assistant or AI digital employee layer. Instead of asking users to open multiple dashboards, interpret charts manually, and write summaries from scratch, Dora helps users complete the reporting scenario through governed AI workflows.
A practical KPI monitoring scenario
Imagine an operations director reviewing a weekly company KPI cockpit. The dashboard already exists in FineReport and includes revenue, order fulfillment, defect rate, receivables aging, and staffing status.
Instead of manually reading every chart, the director asks Dora:
“Summarize this week’s KPI dashboard, highlight abnormal changes in margin, defect rate, and receivables aging, and list the departments that need follow-up.”
This is not a generic chatbot interaction. It is a governed Agentic BI workflow built on trusted reporting assets.
Retrieve trusted FineReport dashboard or report assets Dora pulls the relevant operational cockpit, report sections, charts, and exception lists from FineReport.
Understand KPI definitions and semantic rules Dora uses the trusted semantic layer, KPI definitions, templates, business terms, and filter logic already governed in the reporting environment.
Generate a structured report summary in chat Dora produces a management-ready summary with chart explanations, key movements, and focus areas rather than a vague text response.
Detect exceptions and abnormal changes Dora identifies threshold breaches, unusual trend changes, overdue items, or operational anomalies based on configured business rules.
Push alerts and summaries to the right owners Dora can deliver scheduled daily or weekly briefings, exception notifications, and responsible-party follow-up messages.
Create follow-up records and recap outputs Dora supports review workflows by preserving action context, follow-up status, and recurring summary outputs for managers.
Why FineReport matters in the AI workflow
AI is only useful if the underlying reporting assets are trustworthy.
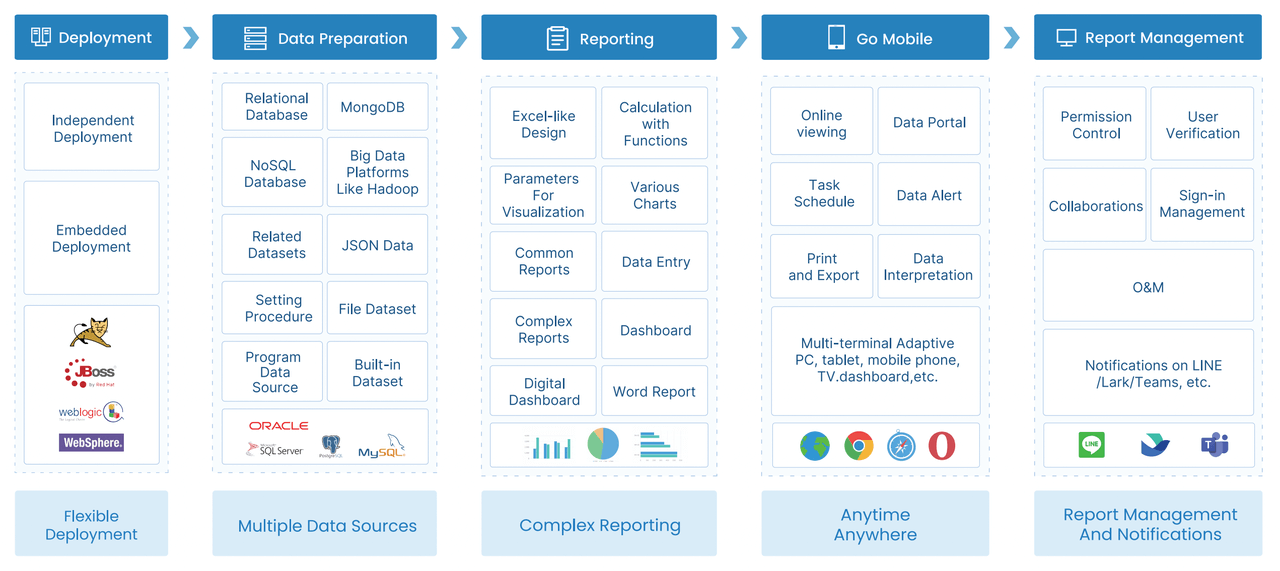
FineReport provides the enterprise foundation through:
That foundation is what makes Dora enterprise-ready. Dora does not guess its way through unmanaged data. It works on top of trusted assets, governed query logic, and reusable Skills. That gives enterprises stronger landing capability than feature-only agent comparisons.
How Dora improves execution beyond dashboard viewing
The AI value is not limited to answering one question. Dora helps enterprises reduce the friction of recurring KPI work by enabling:
natural-language query over trusted reporting assets
chat-based report consumption
retrieval of reports, cockpits, metrics, and exception details
generation of structured report summaries and management narratives
scheduled daily or weekly briefings
exception alerts and push notifications
digital employees for repeatable reporting workflows
skills-based execution for more controllable and auditable AI workflows
This is also where Dora differs from raw prompt-only agents. Enterprises need governed AI workflows that reduce token waste, improve response speed, and increase workflow stability through Skills, semantic rules, KPI governance, and report templates. That makes FineReport + Dora a practical path to fourth-generation Agentic BI.
How to choose the right platform for your enterprise
Choosing among KPI dashboard tools is not just a feature checklist exercise. The right platform depends on your data landscape, reporting complexity, decision cadence, and governance requirements.
Match the tool to your data, users, and decision cadence
Start by asking:
Which systems hold your core KPI data?
How often do users need updates?
Do you need both dashboards and formal reports?
Are users executives, analysts, frontline managers, or all of the above?
How much customization is required?
A simple KPI tool may work for a single department with basic visualization needs. But enterprises often need broader capabilities such as multi-source integration, formatted reports, data permissions, and workflow support.
If you need both operational cockpits and management reporting, FineReport is typically a better fit than a tool focused only on lightweight dashboard display.
Evaluate usability, scalability, and total cost
Enterprise selection should consider:
user adoption and ease of use
dashboard and report design flexibility
governance and security controls
data model maintainability
licensing fit for broad business use
training effort for report developers and business users
long-term support and implementation complexity
It is also worth evaluating the AI roadmap. Ask whether the platform can support enterprise-grade AI consumption of reporting assets, not just add a superficial assistant layer.
Review leading options and category differences
In practice, the market usually breaks into three categories:
Simple KPI tools: Good for quick dashboard setup and small-team visibility
BI platforms: Better for broader analytics, data modeling, and self-service exploration
Reporting and operational cockpit platforms: Better for enterprises that need governed reports, formatted outputs, workflows, and management packs
For many enterprises, the ideal architecture is not “dashboard tool only.” It is a governed reporting foundation plus an AI assistant layer. That is the core value proposition of FineReport + Dora.
Best practices for implementation and AI-assisted KPI monitoring
Strong KPI dashboard tools still fail when the implementation approach is weak. The following practices help enterprises build dashboards and AI monitoring that actually land.
Start with clear goals and a focused metric set
Do not track every available metric. Choose KPIs tied to business outcomes and management decisions.
Best practice:
limit each dashboard to a focused purpose
define KPI owners
align each KPI to a target and review cadence
separate leading indicators from lagging indicators
A dashboard becomes useful when every metric answers a real business question.
A KPI dashboard should tell users what needs attention, not just show colorful charts.
Best practice:
use clear thresholds and status indicators
highlight exceptions prominently
support drill-down into root causes
link dashboards to reports or action workflows
define what happens when a KPI goes off target
Action-oriented design is especially important for executives and operational managers who need fast interpretation.
Standardize KPI definitions, report templates, and business terms
This is essential for both reporting consistency and AI readiness.
Best practice:
define each KPI centrally
standardize formulas and dimensions
reuse report templates across departments
document business terms and exception rules
This gives FineReport a stronger semantic and reporting foundation and improves Dora’s ability to return accurate chart-based answers and structured summaries.
Preserve permissions and governance in AI workflows
AI monitoring should respect the same access rules as reports and dashboards.
audit who can request, receive, and act on AI outputs
This is what makes Dora suitable as an enterprise Data Agent rather than a generic assistant layer.
Use AI monitoring responsibly
AI should support judgment, not replace governance.
Best practice:
validate data quality before rollout
review AI-generated narratives in early phases
start with recurring high-value reports
define alert thresholds and escalation paths
expand Skills gradually after human validation
Dora can be highly effective as a Data Analystdigital employee, Daily Briefing Secretary, or Risk Alert Officer, but reliable enterprise outcomes still depend on trusted data, semantic setup, KPI governance, and standardized report assets.
Building this manually is complex. FineReport helps teams standardize trusted reports, operational cockpits, templates, and reporting workflows. Dora turns those assets into an AI assistant that can answer report questions in chat, generate structured summaries, push scheduled briefings, monitor exceptions, and follow up with responsible owners.
For enterprises evaluating KPI dashboard tools, this matters because the challenge is no longer only dashboard creation. The real challenge is making KPI visibility operationally useful across recurring reviews, executive communication, and exception response.
natural-language query over trusted reporting assets
report and cockpit retrieval
structured report summaries and chart explanations
scheduled summaries and daily or weekly briefings
exception alerts and push notifications
governed follow-up workflows through reusable Skills
FineReport + Dora is not only a reporting upgrade; it is a practical fourth-generation Agentic BI path. FineReport provides governed reports and operational cockpits. Dora provides the AI assistant layer for scenario execution, with more controlled Skills, lower token waste, faster execution paths, and more stable workflows than prompt-only agents.
Get Ready-to-Use Dashboard Templates in Fine Gallery
The strongest Dora pitch is scenario + product + service: FineReport provides the trusted reporting foundation, Dora provides the AI digital employee, and implementation service connects data, governance, semantic setup, Skills, report templates, permissions, and rollout.
If your enterprise is comparing KPI dashboard tools, the most practical question is not just which product can display metrics. It is which platform can support governed dashboards, trusted reports, and AI-assisted monitoring that business teams will actually use.
A KPI dashboard tool helps enterprises collect and display important business metrics in one place so teams can quickly see performance, risks, and trends. It supports faster decisions by turning scattered data into clear visual signals.
A dashboard is mainly for ongoing monitoring and quick status checks, while a report is a structured output for deeper review, communication, and recurring updates. Many enterprises use both together for daily visibility and formal management reporting.
Key features include multi-source data integration, timely refresh schedules, role-based permissions, drill-down analysis, alerts, and mobile access. Enterprises should also look for strong governance so KPI definitions stay consistent across teams.
Yes, many KPI dashboard tools support near real-time updates, exception tracking, and automated alerts when metrics move outside target ranges. This helps teams act sooner instead of waiting for a weekly or monthly review.
FineReport provides the reporting and dashboard foundation for operational cockpits, management reports, and governed KPI views. Dora adds AI-driven summaries, chat-based report access, scheduled briefings, and exception follow-up to help teams act on KPI changes faster.
Product Trial
FineReport
Pixel-perfect reports · Interactive dashboards · Easy data entry · Digital twins