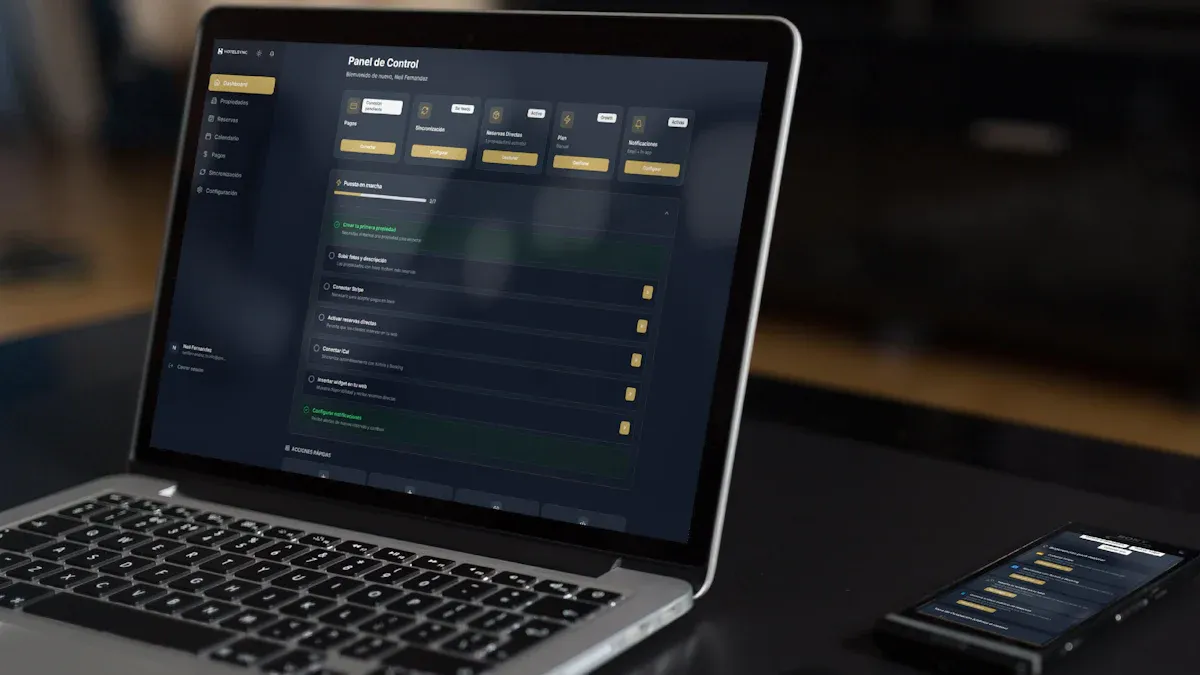
Executives do not need another crowded social media report. They need a social media management dashboard that turns multi-platform activity into fast, trustworthy decision support. That means one place to review performance, understand risk, spot opportunities, and decide where teams should adjust budget, messaging, campaigns, or response priorities.
With FineReport + Dora, teams can ask for a report summary in chat, generate structured narratives from trusted report assets, receive scheduled briefings, and push exceptions to the right owner. Instead of manually stitching together screenshots from LinkedIn, Instagram, TikTok, X, YouTube, ad platforms, and web analytics, enterprises can build a governed dashboard foundation in FineReport and then upgrade report consumption with Dora’s AI assistant layer.
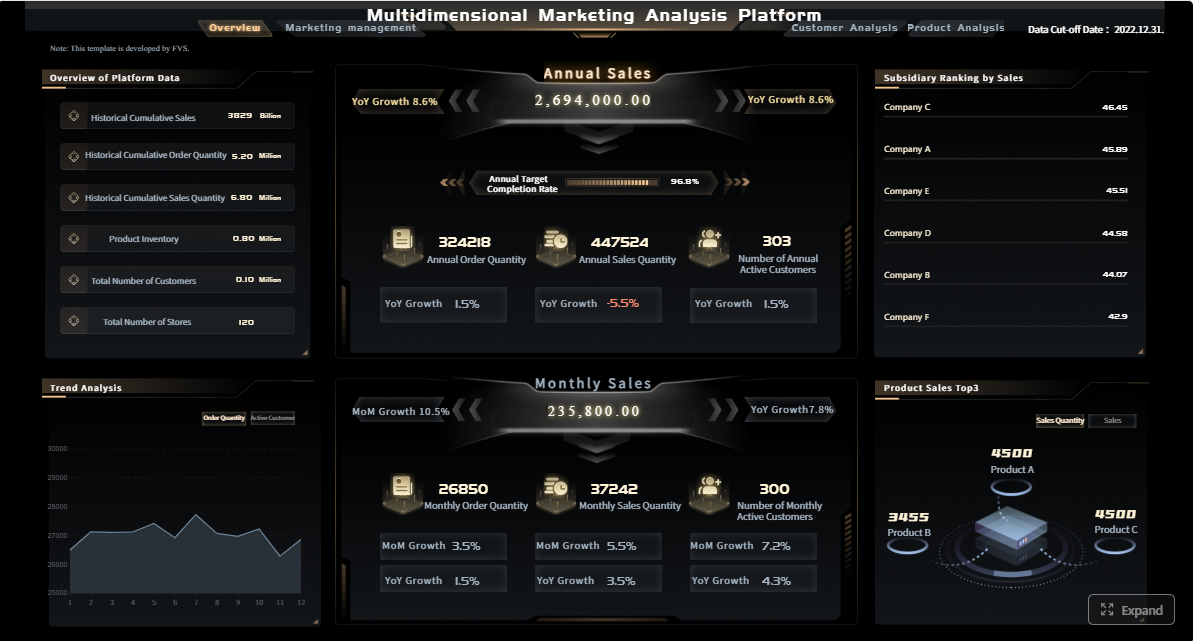 Click To Try The Dashboard
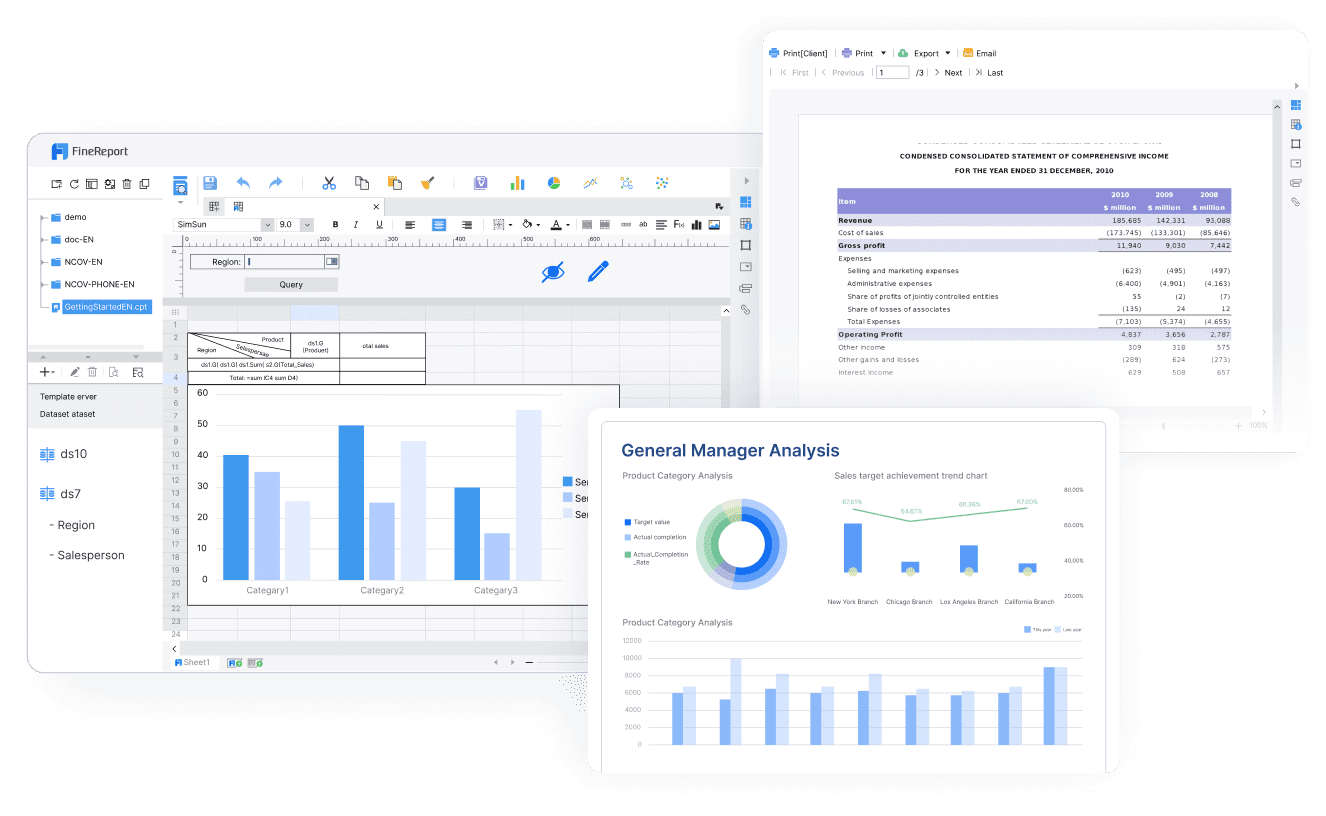
All reports in this article are built with FineReport
What an executive-ready social media management dashboard should do
A strong social media management dashboard for executives is not the same thing as an operating screen for social media managers. It should help leaders answer a short list of business questions quickly:
- Are social investments improving awareness, engagement, traffic, and revenue influence?
- Which channels are gaining momentum?
- Which campaigns need attention?
- Are there customer care or reputation risks that require escalation?
- Where should the team shift budget, content focus, or staffing?
Define the dashboard’s purpose: fast decision support, not day-to-day community management
Executives rarely need post-level publishing controls, inbox workflows, or detailed moderation queues. They need a concise, high-confidence view of performance and exceptions.
That means the dashboard should prioritize:
- summary KPIs
- trend lines
- target vs. actual performance
- campaign highlights
- risk indicators
- short explanations of major changes
FineReport role: FineReport provides the structured reporting foundation for executive summaries, formatted management reports, and operational cockpits.
Dora AI use: Dora can turn those assets into chat-based summaries, scheduled briefings, and exception follow-up workflows.
Clarify the executive audience, reporting cadence, and the decisions the dashboard should influence
Before building the dashboard, define:
- Audience: CEO, CMO, regional marketing head, brand director, customer care leader, or board-level stakeholder
- Cadence: weekly, monthly, quarterly, or campaign-close
- Decision scope: budget reallocation, channel strategy, campaign optimization, crisis response, team prioritization, or executive review prep
A monthly executive dashboard may emphasize brand visibility, lead contribution, and reputation signals. A weekly leadership dashboard may focus more on campaign pacing, paid efficiency, response performance, and emerging issues.
Separate strategic visibility from channel-level operational detail to keep the view concise
The best approach is layered reporting:
- Executive snapshot for business impact
- Cross-channel scorecard for trend comparison
- Drill-down pages for campaign, content, audience, or platform analysis
- Exception layer for unusual changes and follow-up actions
This structure prevents the common mistake of forcing executives to read the same dashboard used by daily operators.
Choose the KPIs executives actually need to see
A social media management dashboard becomes valuable when its KPIs are tied to business outcomes and organized for action.
Tie metrics to business goals
Social data should map to enterprise goals, not just platform activity.
Awareness
- Report Element: Reach and impressions across channels
Definition: The number of unique users reached and total content exposures.
Business value: Indicates brand visibility and campaign scale.
AI use: Dora can summarize whether awareness growth is broad-based or driven by a specific campaign, channel, or paid push.
Engagement
- Report Element: Engagement rate
Definition: Interactions relative to audience size, reach, or impressions based on your approved formula.
Business value: Shows whether content is resonating, not just being seen.
AI use: Dora can explain unusual jumps or declines and include this KPI in a scheduled management briefing.
Traffic
- Report Element: Social-driven site visits or landing page traffic
Definition: Sessions or visits attributed to social links, tracked through web analytics and campaign tagging.
Business value: Connects social performance to downstream digital behavior.
AI use: Dora can compare traffic contribution by channel and generate chart-based answers in chat.
Lead generation
- Report Element: Leads or form fills influenced by social
Definition: Conversions from social-driven sessions or campaign paths based on agreed attribution rules.
Business value: Helps prove social’s role in demand generation.
AI use: Dora can summarize lead contribution by campaign and highlight underperforming channels.
Customer care
- Report Element: Response time and resolution rate
Definition: Average response time to social inquiries and percentage of issues resolved.
Business value: Signals service quality, reputation protection, and staffing sufficiency.
AI use: Dora can detect threshold breaches and trigger owner notifications as a Risk Alert Officer.
Revenue influence
- Report Element: Pipeline, assisted conversions, or revenue-linked outcomes
Definition: Social’s contribution to commercial results based on your enterprise attribution model.
Business value: Gives executives a clearer ROI lens.
AI use: Dora can generate structured management narratives that connect performance trends to business outcomes.
Build a balanced scorecard across channels
Executives need a balanced view, not a single metric dashboard. A practical cross-channel scorecard should include:
Reach
- Definition: Total and unique audience exposure across channels
- Business value: Measures scale and brand visibility
- AI use: Dora can compare period-over-period trends and note where gains are concentrated
Engagement rate
- Definition: Interaction rate based on an approved formula
- Business value: Indicates content relevance and audience response quality
- AI use: Dora can explain if strong reach is failing to translate into audience engagement
Share of voice
- Definition: Brand conversation share versus competitors or category discussion share
- Business value: Shows market visibility and competitive presence
- AI use: Dora can include share-of-voice changes in executive weekly briefings
Audience growth
- Definition: Net follower or subscriber growth by platform
- Business value: Reveals whether brand presence is compounding
- AI use: Dora can identify whether growth is steady, campaign-driven, or inconsistent
Conversion indicators
- Definition: Click-throughs, landing page actions, signups, leads, or sales influence
- Business value: Ties social activity to measurable outcomes
- AI use: Dora can produce a structured summary of which channels are generating business response
Response performance
- Definition: Response time, backlog, resolution rate, or SLA compliance
- Business value: Important for service-heavy brands and reputation-sensitive industries
- AI use: Dora can monitor exceptions and escalate overdue cases
Add targets, benchmarks, and trend lines so performance has context. An executive dashboard without targets often produces discussion, but not decisions.
Avoid vanity metrics and reporting noise
Executives do not need to review every available platform metric. Remove metrics that do not lead to a decision.
Common examples of reporting noise include:
- raw likes without engagement context
- follower totals without growth quality
- post counts without outcome linkage
- isolated views without retention or action context
- duplicate metrics repeated at too many levels
Instead, emphasize:
- exceptions
- trend breaks
- target misses
- high-performing campaigns
- emerging risks
- sudden customer sentiment changes
A concise dashboard makes executive attention more effective.
Design cross-channel reporting that executives can read quickly
Cross-channel reporting is where many dashboards fail. Data gets aggregated too early, or platform differences are ignored, making the output look neat but misleading.
Standardize data definitions across platforms
Before combining sources, align:
- naming conventions
- campaign tags
- business unit labels
- date ranges
- fiscal periods
- attribution rules
- engagement formulas
- paid vs. organic classifications
For example, an engagement rate formula must be consistent enough for enterprise reporting, even if platform-native calculations differ. You should also clearly note where direct comparison is imperfect, such as between short-form video views and feed impressions.
FineReport role: FineReport helps consolidate data from multiple systems into governed report structures, with reusable report templates and KPI logic.
Dora AI use: Dora relies on that trusted semantic layer to answer questions accurately and consistently instead of guessing from raw, disconnected metrics.
Create one summary view and a few drill-down layers
Executives should start with a single page that answers the headline questions:
- What improved?
- What declined?
- What is off target?
- What needs action now?
Then provide drill-down paths for:
- campaign performance
- channel comparison
- audience segments
- paid vs. organic
- content themes
- customer care exceptions
In FineReport, this works well as an executive cockpit backed by detailed reports. Leaders can stay at the summary level while analysts and marketing managers can drill deeper when needed.
Compare channels without losing platform nuance
Cross-channel reporting should show aggregate performance, but it should not flatten every platform into the same story.
For example:
- LinkedIn may drive higher-quality B2B traffic with lower engagement volume
- TikTok may drive broad awareness but lighter direct conversion
- Instagram may support strong community engagement and brand affinity
- X may be more important for customer care, announcements, or issue monitoring
- YouTube may contribute more to education, retention, and long-form influence
A strong social media management dashboard combines:
- enterprise-level trend views
- channel-level context
- short commentary on why change happened
This is where Dora becomes highly useful. Rather than forcing leaders to interpret every chart manually, Dora can generate concise explanations tied back to FineReport dashboards and approved KPI definitions.
Add AI briefings that explain the story behind the numbers
The reporting challenge is no longer only dashboard production. It is also report consumption. Executives want the story behind the numbers, not just the numbers themselves.
Use AI to summarize trends and anomalies
AI briefings are most useful when they convert trusted dashboard outputs into structured narratives such as:
- what changed this period
- what likely drove the change
- which KPI is at risk
- what should be reviewed next
Examples include:
- weekly executive social briefing
- monthly brand performance summary
- campaign close-out narrative
- customer care risk alert summary
- competitor visibility update
Dora value: Dora is not just generating generic text. It works as an enterprise Data Agent on top of trusted reporting assets. That means it can retrieve FineReport cockpit data, interpret KPI definitions, summarize chart changes, and push a readable management update to the right stakeholders.
Turn reports into recommendations
Once summary quality is strong, AI can support controlled recommendations such as:
- shift paid spend toward higher-converting channels
- review creative themes that drove high saves or shares
- investigate response backlog in a specific region
- test new content timing based on recent engagement patterns
- increase monitoring for a fast-moving sentiment issue
Recommendations still need human review. Brand context, campaign intent, reputation sensitivity, and business priorities all matter. The goal is not autonomous decision-making. The goal is faster, more structured executive preparation and follow-up.
Build guardrails for accuracy and trust
AI briefings should only be shared broadly when governance is in place.
Key guardrails include:
- approved data sources
- standardized KPI definitions
- prompt and summary templates
- permission-based access
- human review checkpoints
- exception thresholds
- documented assumptions
- confidence notes where needed
This is why enterprise AI reporting lands better when it is built on governed reports rather than raw prompts alone. FineReport provides the trusted report and operational cockpit foundation. Dora adds the governed AI workflow layer for summaries, alerts, pushes, and follow-up.
How an AI Data Agent Automates Report Consumption
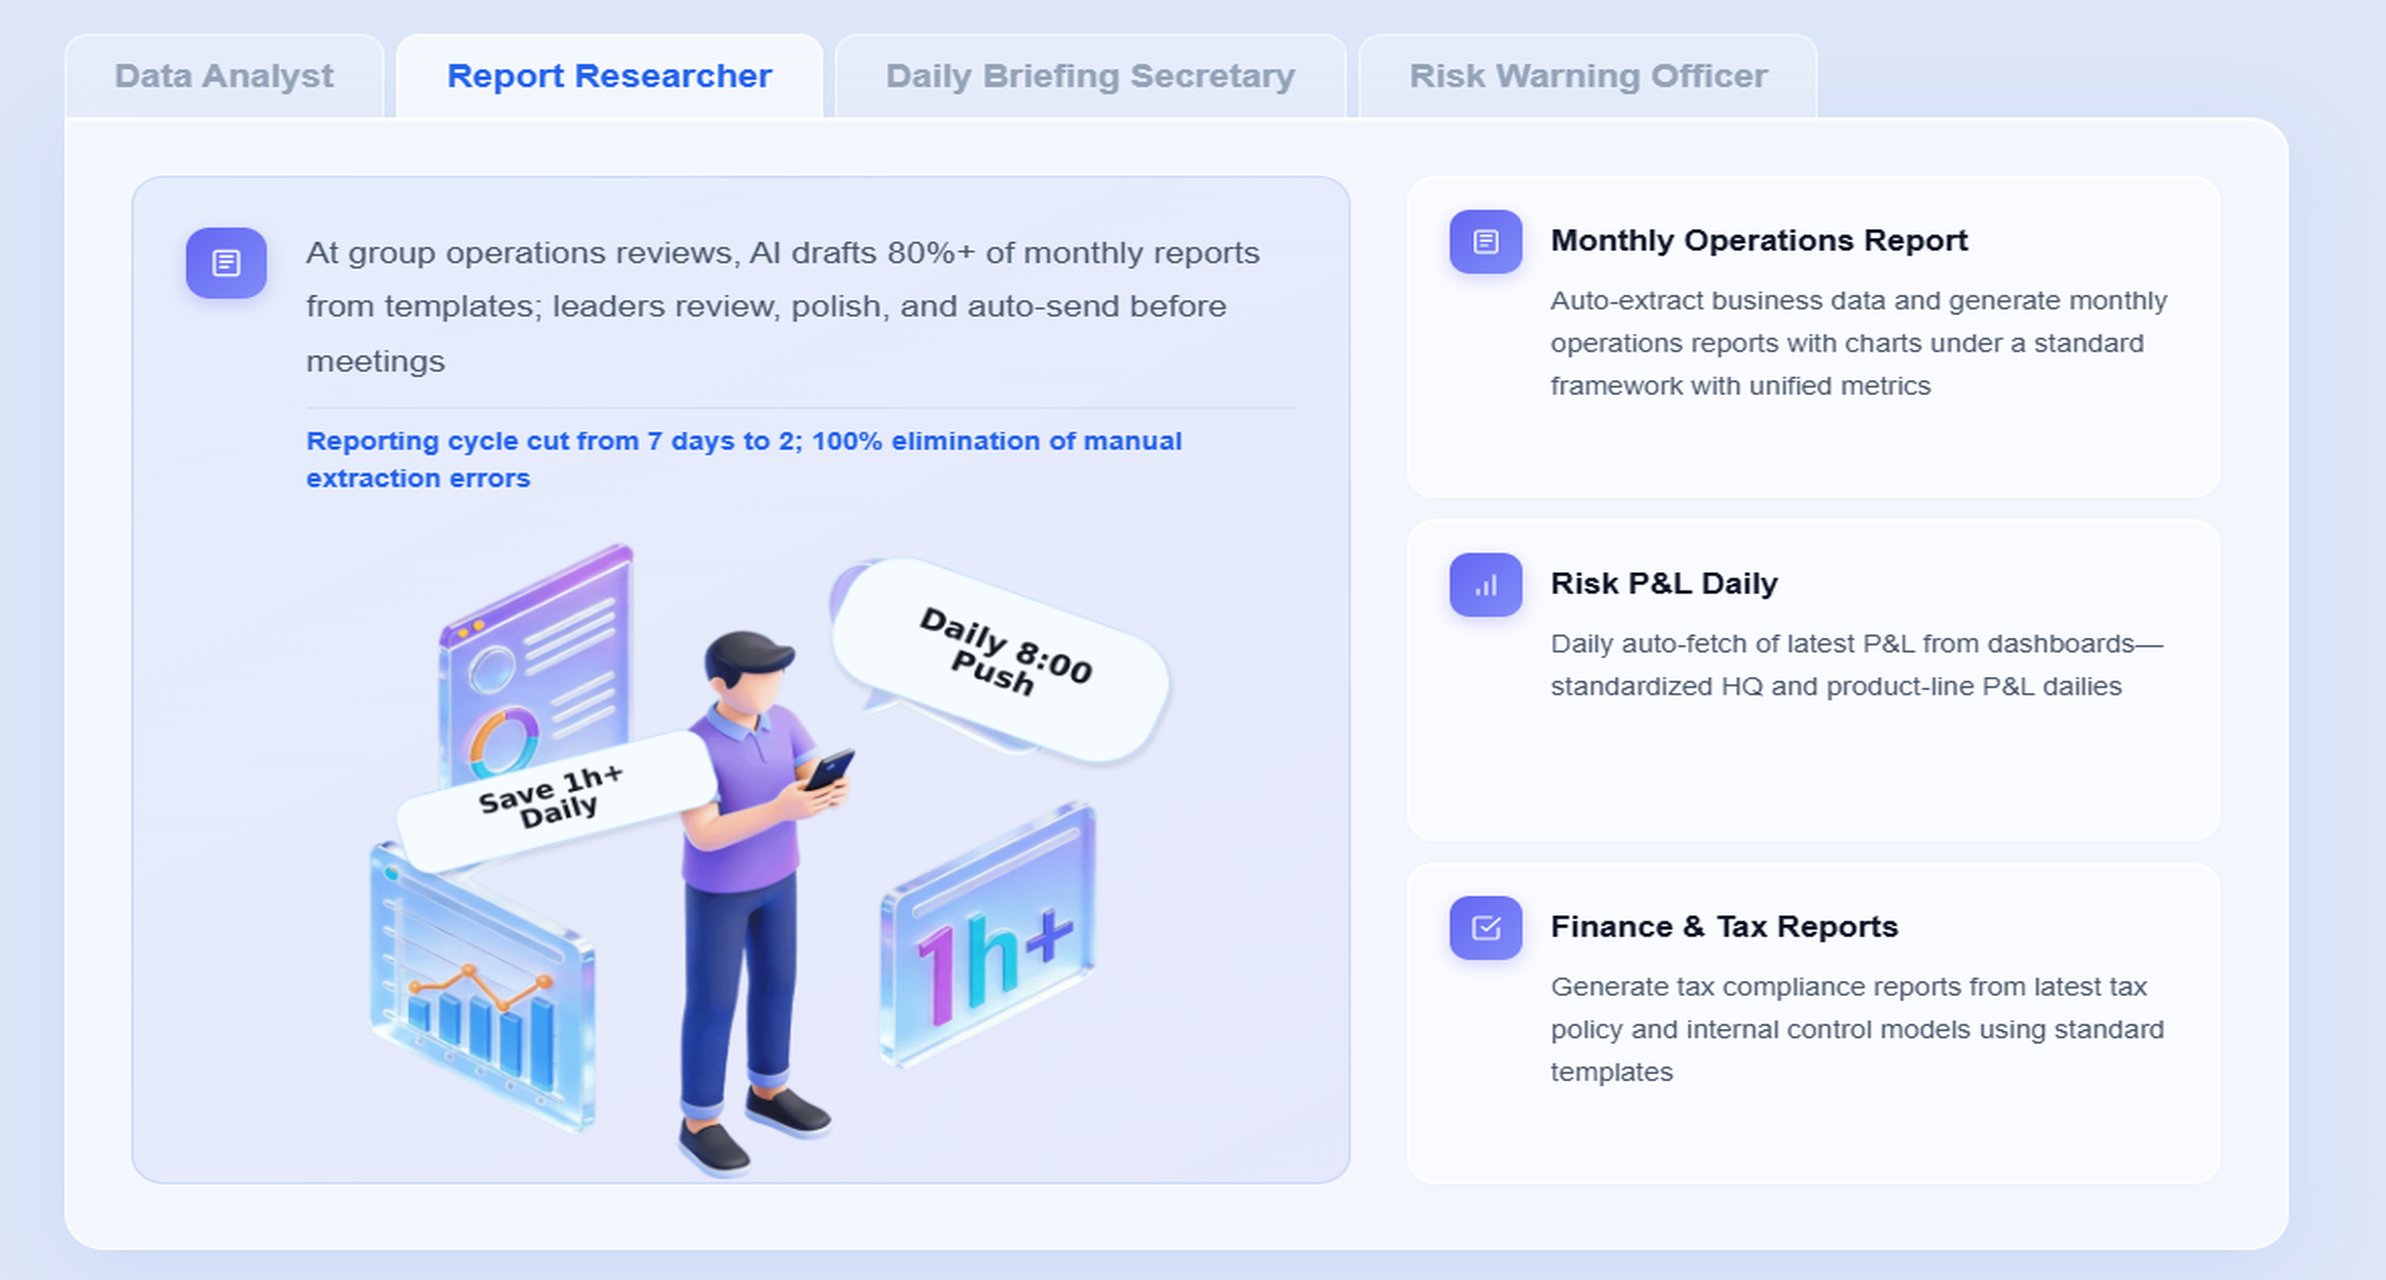
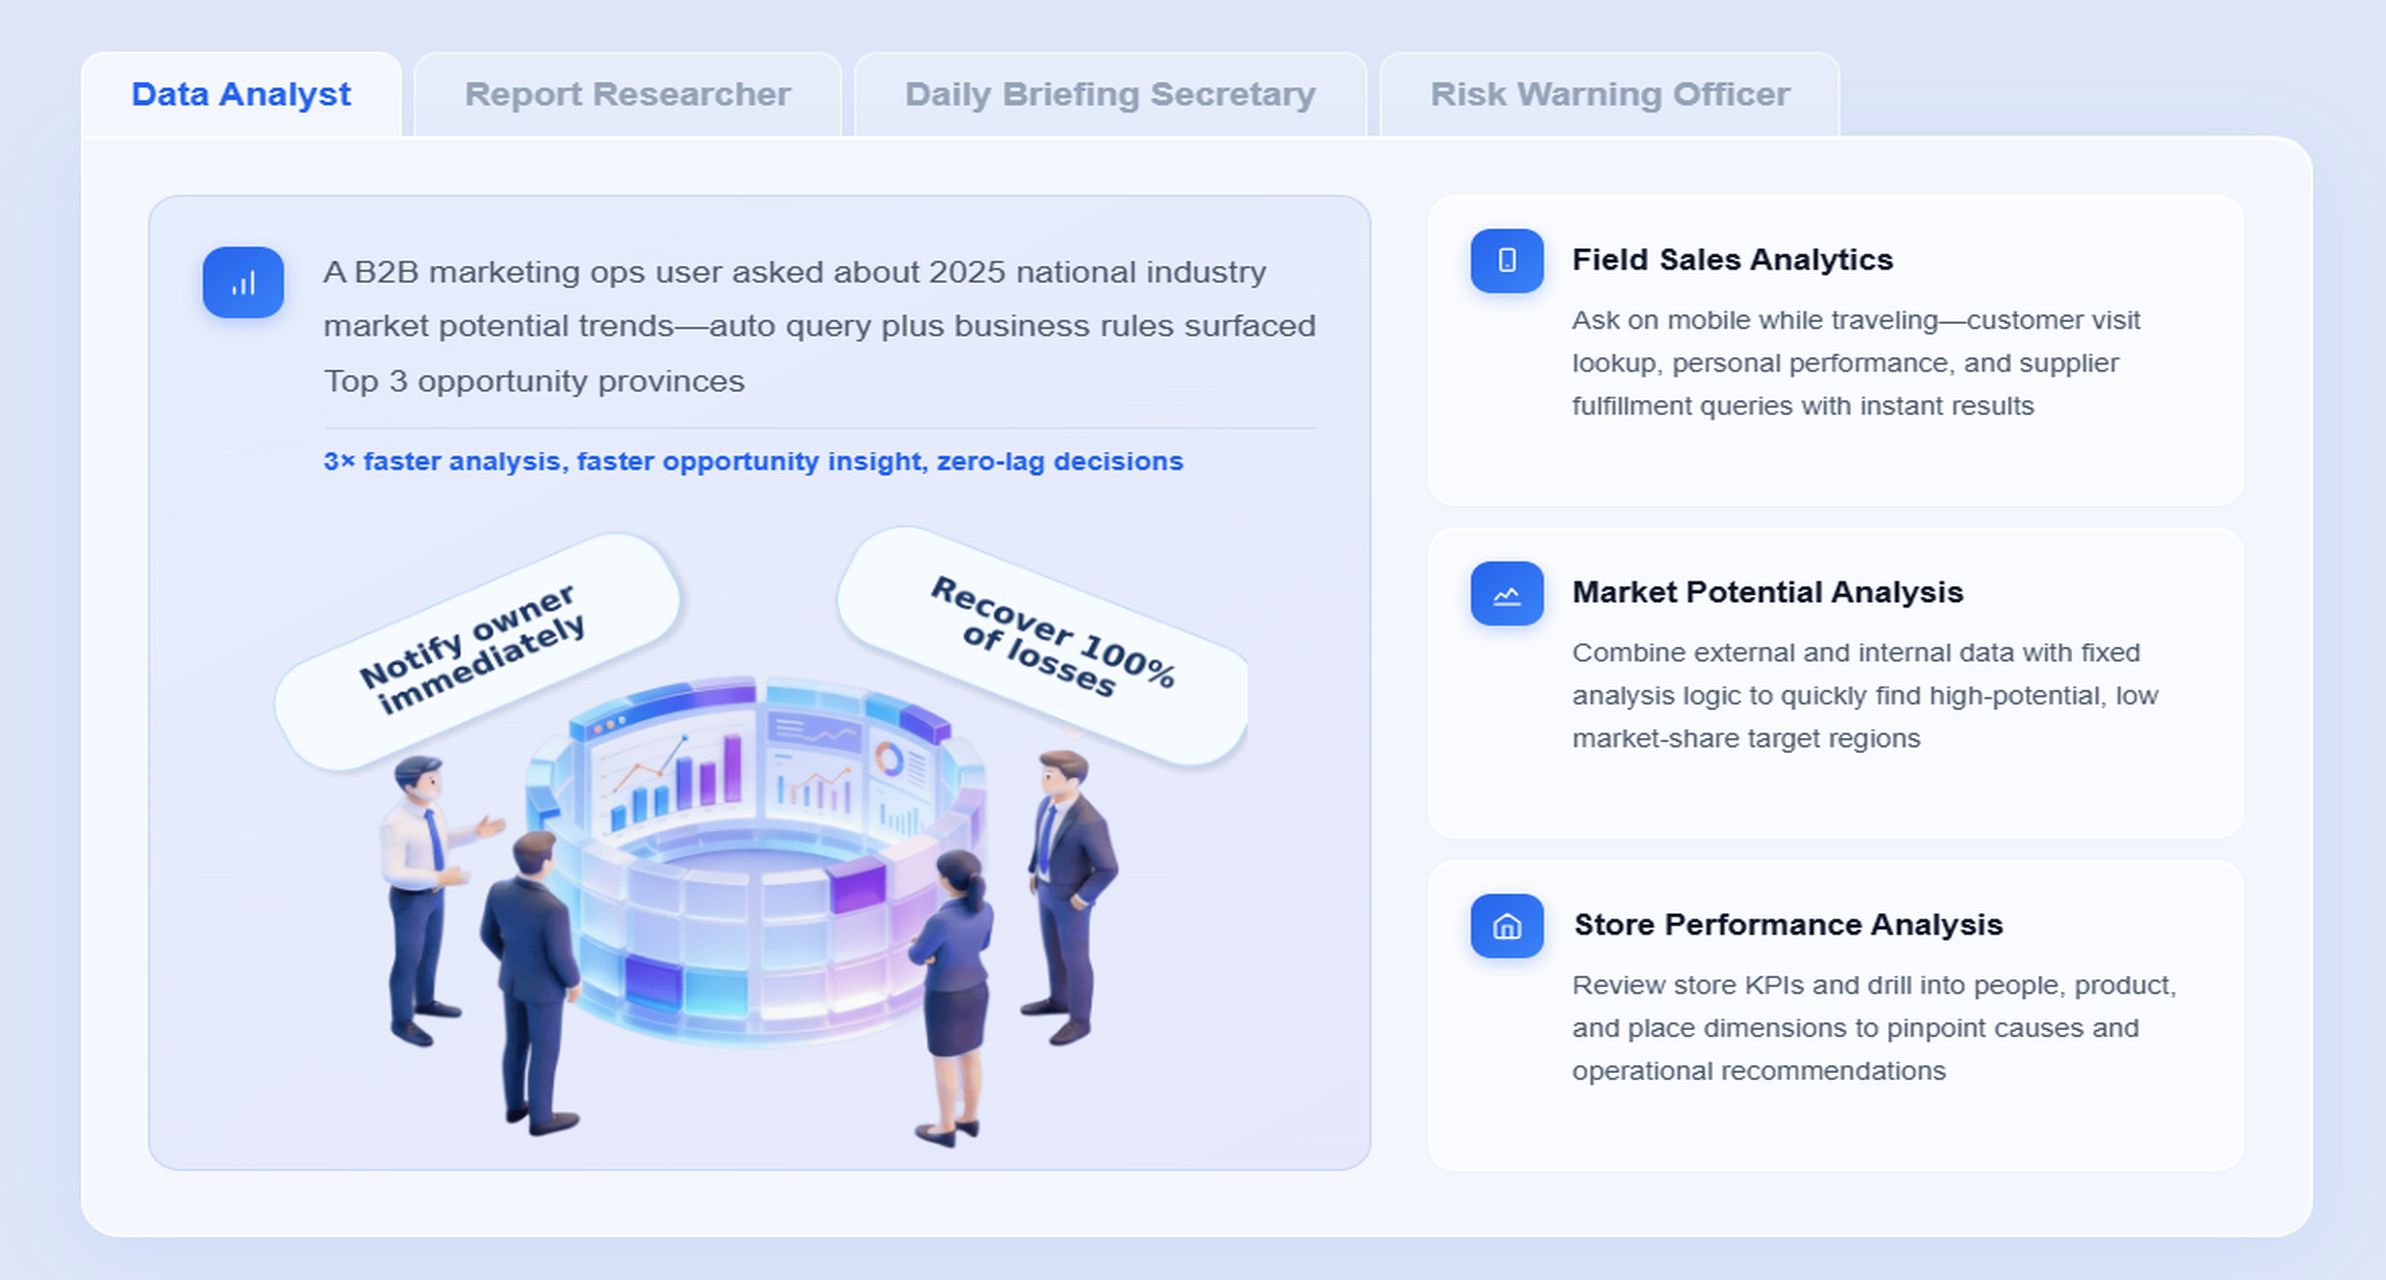
For executive social reporting, the most relevant Dora digital employees are typically the Daily Briefing Secretary, Report Researcher, and Risk Alert Officer.
The practical scenario is simple: the marketing team already has a FineReport-based social media management dashboard with KPI scorecards, channel comparisons, campaign views, and exception lists. Dora turns that reporting foundation into a scenario-ready AI assistant for leaders and business teams.
A concrete chat example
An executive or marketing leader can ask:
“Summarize this month’s social media management dashboard, highlight the channels with the biggest engagement and traffic changes, flag any response-time risks, and list the campaigns that need follow-up.”
Dora can return a structured response with:
- executive summary
- KPI changes vs. last period
- notable channel movements
- exception alerts
- campaign follow-up list
- links back to the FineReport source views
A 6-step AI workflow for executive social reporting
-
Retrieve trusted FineReport report or cockpit data
Dora accesses the approved FineReport executive dashboard, channel scorecards, campaign reports, and exception tables. -
Understand KPI definitions and business rules
Dora reads the trusted semantic layer, including engagement formulas, attribution logic, naming conventions, thresholds, and reporting periods. -
Generate a structured report summary through chat
Using the approved report assets, Dora creates a structured report summary with chart explanations, trend comparisons, and management narrative. -
Detect exceptions and abnormal changes
Dora identifies spikes, drops, response-time breaches, underperforming campaigns, or unusual audience pattern shifts based on configured rules. -
Push summaries and alerts to the right owners
As a Daily Briefing Secretary or Risk Alert Officer, Dora can push scheduled weekly or monthly briefings, exception notices, and follow-up reminders to responsible stakeholders. -
Produce follow-up records for review
Dora supports workflow continuity by logging action items, unresolved issues, or periodic summary records for team review and executive meeting preparation.
The relevant Dora digital employee for this scenario
Daily Briefing Secretary
Best for recurring executive social updates. It can deliver scheduled weekly or monthly summaries of the social media management dashboard, including key movements, top risks, and pending action items.
Report Researcher
Best for turning dashboard views into structured narrative outputs. It helps leaders understand what happened in a report without manually reading every chart and table.
Risk Alert Officer
Best for monitoring response SLAs, sentiment risks, campaign underperformance, or sudden cross-channel anomalies that require immediate owner follow-up.
How FineReport provides the trusted reporting foundation
Dora’s usefulness depends on the quality of the reporting layer below it.
FineReport provides:
- formatted executive reports
- operational cockpits
- reusable KPI templates
- governed metrics and semantic rules
- permission-based access control
- workflow-ready reporting processes
- cross-source reporting integration
This matters because enterprise leaders do not want AI to invent numbers or reinterpret business logic differently every week. FineReport standardizes the reporting asset. Dora then makes that asset easier to query, summarize, push, and act on.
How Dora improves execution
Dora adds value in the actual consumption and follow-up workflow:
- chat-based access to trusted report content
- structured report summaries for leaders
- chart explanation for non-analyst audiences
- scheduled briefings for recurring cadence
- exception pushes when thresholds are breached
- owner notification and follow-up for unresolved issues
- skills-based execution for more controllable and auditable AI workflows
Compared with raw prompt-only agents, this approach has better enterprise landing capability because it is grounded in governed reports, permissions, KPI governance, and reusable Skills. It also helps reduce token waste and improves workflow stability because the AI is working with a clearer reporting structure instead of reprocessing loosely defined data every time.
Build the dashboard workflow, template, and tool stack
An executive dashboard is not only a visual artifact. It is a reporting workflow with templates, ownership, governance, and distribution rules.
Start with a repeatable dashboard template
Build a standard structure that can be reused across time periods, brands, or business units.
A practical executive template includes:
- Executive summary
- KPI scorecard
- Cross-channel comparison
- Campaign highlights
- Customer care and risk section
- Action items and follow-up
This makes monthly reporting faster and improves consistency when different teams contribute data.
Select tools based on integration and governance needs
When evaluating dashboard tools and the surrounding stack, consider:
- connector coverage across social, web, CRM, and ad systems
- report customization
- governance and access control
- export and presentation quality
- workflow automation
- drill-down capability
- semantic consistency
- enterprise permission boundaries
This is where FineReport is especially strong as the reporting foundation. It supports enterprise-grade formatted reporting, cockpit design, complex report structures, and operational workflows. Dora then adds the AI assistant layer for report query, summary, alerts, and action follow-up.
Establish ownership and reporting routines
Assign clear responsibilities for:
- data source maintenance
- KPI validation
- dashboard updates
- executive narrative review
- exception handling
- distribution schedules
- approval workflow
A dashboard becomes sustainable when ownership is explicit. AI can accelerate the process, but it does not remove the need for governance.
Review, refine, and scale the dashboard over time
An executive social media management dashboard should evolve as strategy changes.
Review it regularly to determine:
- which pages executives actually open
- which KPIs are discussed most often
- which alerts prompt action
- which narratives are useful or ignored
- where teams still rely on manual analysis outside the dashboard
Over time, refine:
- KPI definitions
- visualization choices
- briefing formats
- benchmark logic
- drill-down paths
- AI summary prompts
- escalation rules
This is also the right time to expand Dora Skills gradually. Start with recurring executive summaries and exception alerts, then move into campaign follow-up, stakeholder-specific briefings, and more specialized report interpretation workflows.
Actionable best practices
1. Standardize KPI definitions, business terms, and exception rules first
Do not try to fix inconsistency with visualization alone. Define:
- engagement formulas
- traffic attribution rules
- response-time SLA logic
- conversion definitions
- campaign naming standards
- anomaly thresholds
This makes both the dashboard and AI briefing layer more trustworthy.
2. Build a semantic layer inside the reporting workflow
This is one of the most important AI-specific practices. Dora performs best when report templates, KPI logic, and business language are already structured in FineReport. That gives the AI assistant a governed foundation for chart-based answers, summaries, and follow-up.
3. Start with high-value recurring reports, not every possible social report
Another key AI-specific practice is narrowing the initial scenario. Good starting points include:
- monthly executive social summary
- weekly campaign briefing
- customer care exception report
- major brand launch performance recap
These are repeatable, visible, and easier to standardize.
4. Preserve permission governance across reporting and AI outputs
Executives, regional teams, and agency partners may not all have access to the same metrics or business-unit details. AI outputs should respect FineReport access boundaries. This is essential for enterprise fit and one reason governed Agentic BI lands better than generic prompt-only experiments.
5. Keep human review in the loop for AI-generated narratives
Use human review for early-stage report summaries, recommendation outputs, and sensitive exception messaging. Expand Dora Skills gradually as confidence grows in data quality, templates, and governance.
FineReport + Dora solution pitch
Building this manually is complex. FineReport helps teams standardize trusted reports, operational cockpits, templates, and reporting workflows. Dora turns those assets into an AI assistant that can answer report questions in chat, generate structured summaries, push scheduled briefings, monitor exceptions, and follow up with responsible owners.
For executive social reporting, this means your social media management dashboard is no longer just a passive screen. It becomes a governed reporting system with an enterprise Data Agent layer that helps leaders consume information faster and helps teams execute follow-up more consistently.
FineReport + Dora is not only a reporting upgrade; it is a practical fourth-generation Agentic BI path. FineReport provides governed reports and operational cockpits. Dora provides the AI assistant layer for scenario execution, with more controlled Skills, lower token waste, faster execution paths, and more stable workflows than prompt-only agents.

Get Ready-to-Use Dashboard Templates in Fine Gallery
The strongest Dora pitch is scenario + product + service: FineReport provides the trusted reporting foundation, Dora provides the AI digital employee, and implementation service connects data, governance, semantic setup, Skills, report templates, permissions, and rollout.
If your enterprise wants executives to move from manually reading fragmented social reports to receiving timely, structured, explainable briefings, FineReport + Dora is the practical path.
FAQs
It should focus on a small set of business KPIs such as reach, engagement, traffic, leads, customer care performance, and revenue influence. It should also show trends, target versus actual results, and clear exceptions that need leadership attention.