Executive reporting fails when dashboards show too much project activity and too little decision-ready insight. Leaders do not need a task board in disguise. They need a clear view of portfolio health, milestone confidence, budget position, delivery risk, and expected business impact.
That is why the best project management dashboard examples for executives look very different from team-level dashboards. They condense complexity into a decision layer. With FineReport + Dora, teams can ask for a report summary in chat, generate structured narratives from trusted report assets, receive scheduled briefings, and push exceptions to the right owner.
Click To Try The Dashboard
All reports in this article are built with FineReport
Why executive reporting needs different project management dashboard examples
Executive dashboards are not built to manage daily work. They are built to support leadership decisions.
A project manager may need task completion percentages, sprint burndown, and ticket aging. An executive needs a much shorter list of answers:
Which projects are healthy, and which are drifting?
Where do milestones lack confidence?
Are budget and capacity assumptions still valid?
What risks require escalation now?
Are projects producing measurable business outcomes?
That difference matters. When executive dashboards inherit too much operational detail, reviews become slow, reactive, and political. Leaders waste time interpreting status updates instead of discussing trade-offs, funding decisions, and interventions.
Useful executive reporting should work in three settings:
Board meetings, where leadership needs portfolio-level trends and strategic alignment
Steering committees, where key risks, dependencies, and decisions must be resolved quickly
Monthly business reviews, where executives assess whether project delivery is on track financially and operationally
The right dashboard does not try to show everything. It highlights what changed, what matters, and what action is needed next.
The metrics leaders actually need to see before reviewing the examples
Before looking at dashboard layouts, it helps to define the reporting elements that matter most. Strong executive dashboards are built around a controlled set of KPIs and exception logic, not around whatever data happens to be available.
Portfolio health and delivery confidence
This is the executive starting point: a concise view of whether the project portfolio is moving in the right direction.
Portfolio health indicator: A roll-up of project status using governed status rules such as on track, watch, or critical. Business value: Gives leaders an immediate sense of portfolio stability without reading every project note. AI use:Dora can summarize health movement, explain which projects shifted status, and generate a structured monthly leadership briefing.
Delivery confidence trend: A trend line showing whether milestone confidence is improving, stable, or deteriorating over time. Business value: Prevents leaders from being surprised by late-stage slippage. AI use:Dora can compare trend periods, flag declining confidence, and explain likely schedule exposure in chat.
Escalation count: The number of projects requiring executive attention due to major blockers, approvals, or risk thresholds. Business value: Keeps leadership focused on interventions rather than passive monitoring. AI use:Dora can list escalations by owner, urgency, and required decision, then push follow-up reminders.
Strategic alignment score or category: A tag or weighted score showing how each initiative maps to strategic objectives. Business value: Helps leaders prioritize scarce funding and resources. AI use:Dora can include strategic alignment commentary in management summaries and answer which high-priority initiatives are underperforming.
Budget, resources, and forecast accuracy
Executives care less about line-by-line expense detail and more about whether the portfolio is financially controlled and realistically staffed.
Budget vs. actual spend: Compares approved budget with actual spend to date. Business value: Shows whether projects remain financially disciplined. AI use:Dora can explain overspend drivers, summarize budget deviations, and include them in weekly financial briefings.
Forecast at completion: The expected final cost based on current delivery conditions. Business value: Gives executives time to make funding or scope decisions before overruns become fixed. AI use:Dora can detect material changes in projected completion cost and notify owners and finance reviewers.
Burn rate: Measures how fast budget is being consumed over a defined period. Business value: Reveals whether spend patterns are aligned with progress. AI use:Dora can point out mismatches such as high spend with low milestone completion.
Resource capacity utilization: Shows whether critical teams or roles are overloaded, balanced, or underused. Business value: Supports staffing decisions and portfolio reprioritization. AI use:Dora can summarize constrained functions, identify recurring bottlenecks, and push alerts when utilization crosses thresholds.
Forecast accuracy: Compares prior forecast commitments with actual delivery outcomes. Business value: Helps leaders judge whether status updates are trustworthy. AI use:Dora can identify projects or departments with repeated optimism bias and include this in governance reviews.
Risks, dependencies, and decision points
Executives should not receive a long issue log. They should receive the small set of risks and blockers that need leadership action.
Top risks requiring intervention: A short list of material risks ranked by impact, urgency, and action needed. Business value: Keeps meetings focused on decisions rather than status recitation. AI use:Dora can generate risk summaries, explain exposure, and recommend who needs to act next.
Cross-functional dependencies: Critical dependencies between teams, vendors, systems, or approvals. Business value: Makes hidden delivery threats visible before they become milestone misses. AI use:Dora can monitor dependency status and push alerts when predecessor activities slip.
Pending approvals and decisions: Items waiting on budget approval, policy sign-off, design approval, or steering action. Business value: Clarifies where leadership delay is affecting delivery. AI use:Dora can surface overdue approvals and send reminders to the responsible executive or committee owner.
Timeline threat level: An exception-based signal showing where current conditions threaten committed dates. Business value: Helps leaders distinguish noise from true schedule exposure. AI use:Dora can connect threat signals to source reports and generate chart-based answers explaining the cause.
7 project management dashboard examples for executive reporting
The best project management dashboard examples for leadership are built around review scenarios. Each example below is useful because it supports a specific executive conversation.
Portfolio overview dashboard
A portfolio overview dashboard gives leaders a one-page summary of all active initiatives by priority, owner, business unit, and health status.
This is often the most important executive dashboard because it answers a basic but critical question: where should leadership pay attention now?
A strong layout usually includes:
project count by status
projects grouped by strategic priority
top exceptions requiring escalation
trend of health movement over time
owner and sponsor visibility
projects at risk of missing committed milestones
What executives want from this dashboard is not a directory of projects. They want pattern recognition. Are too many top-priority initiatives moving into watch status? Is one function consistently owning delayed work? Is the portfolio balanced, or concentrated in risky areas?
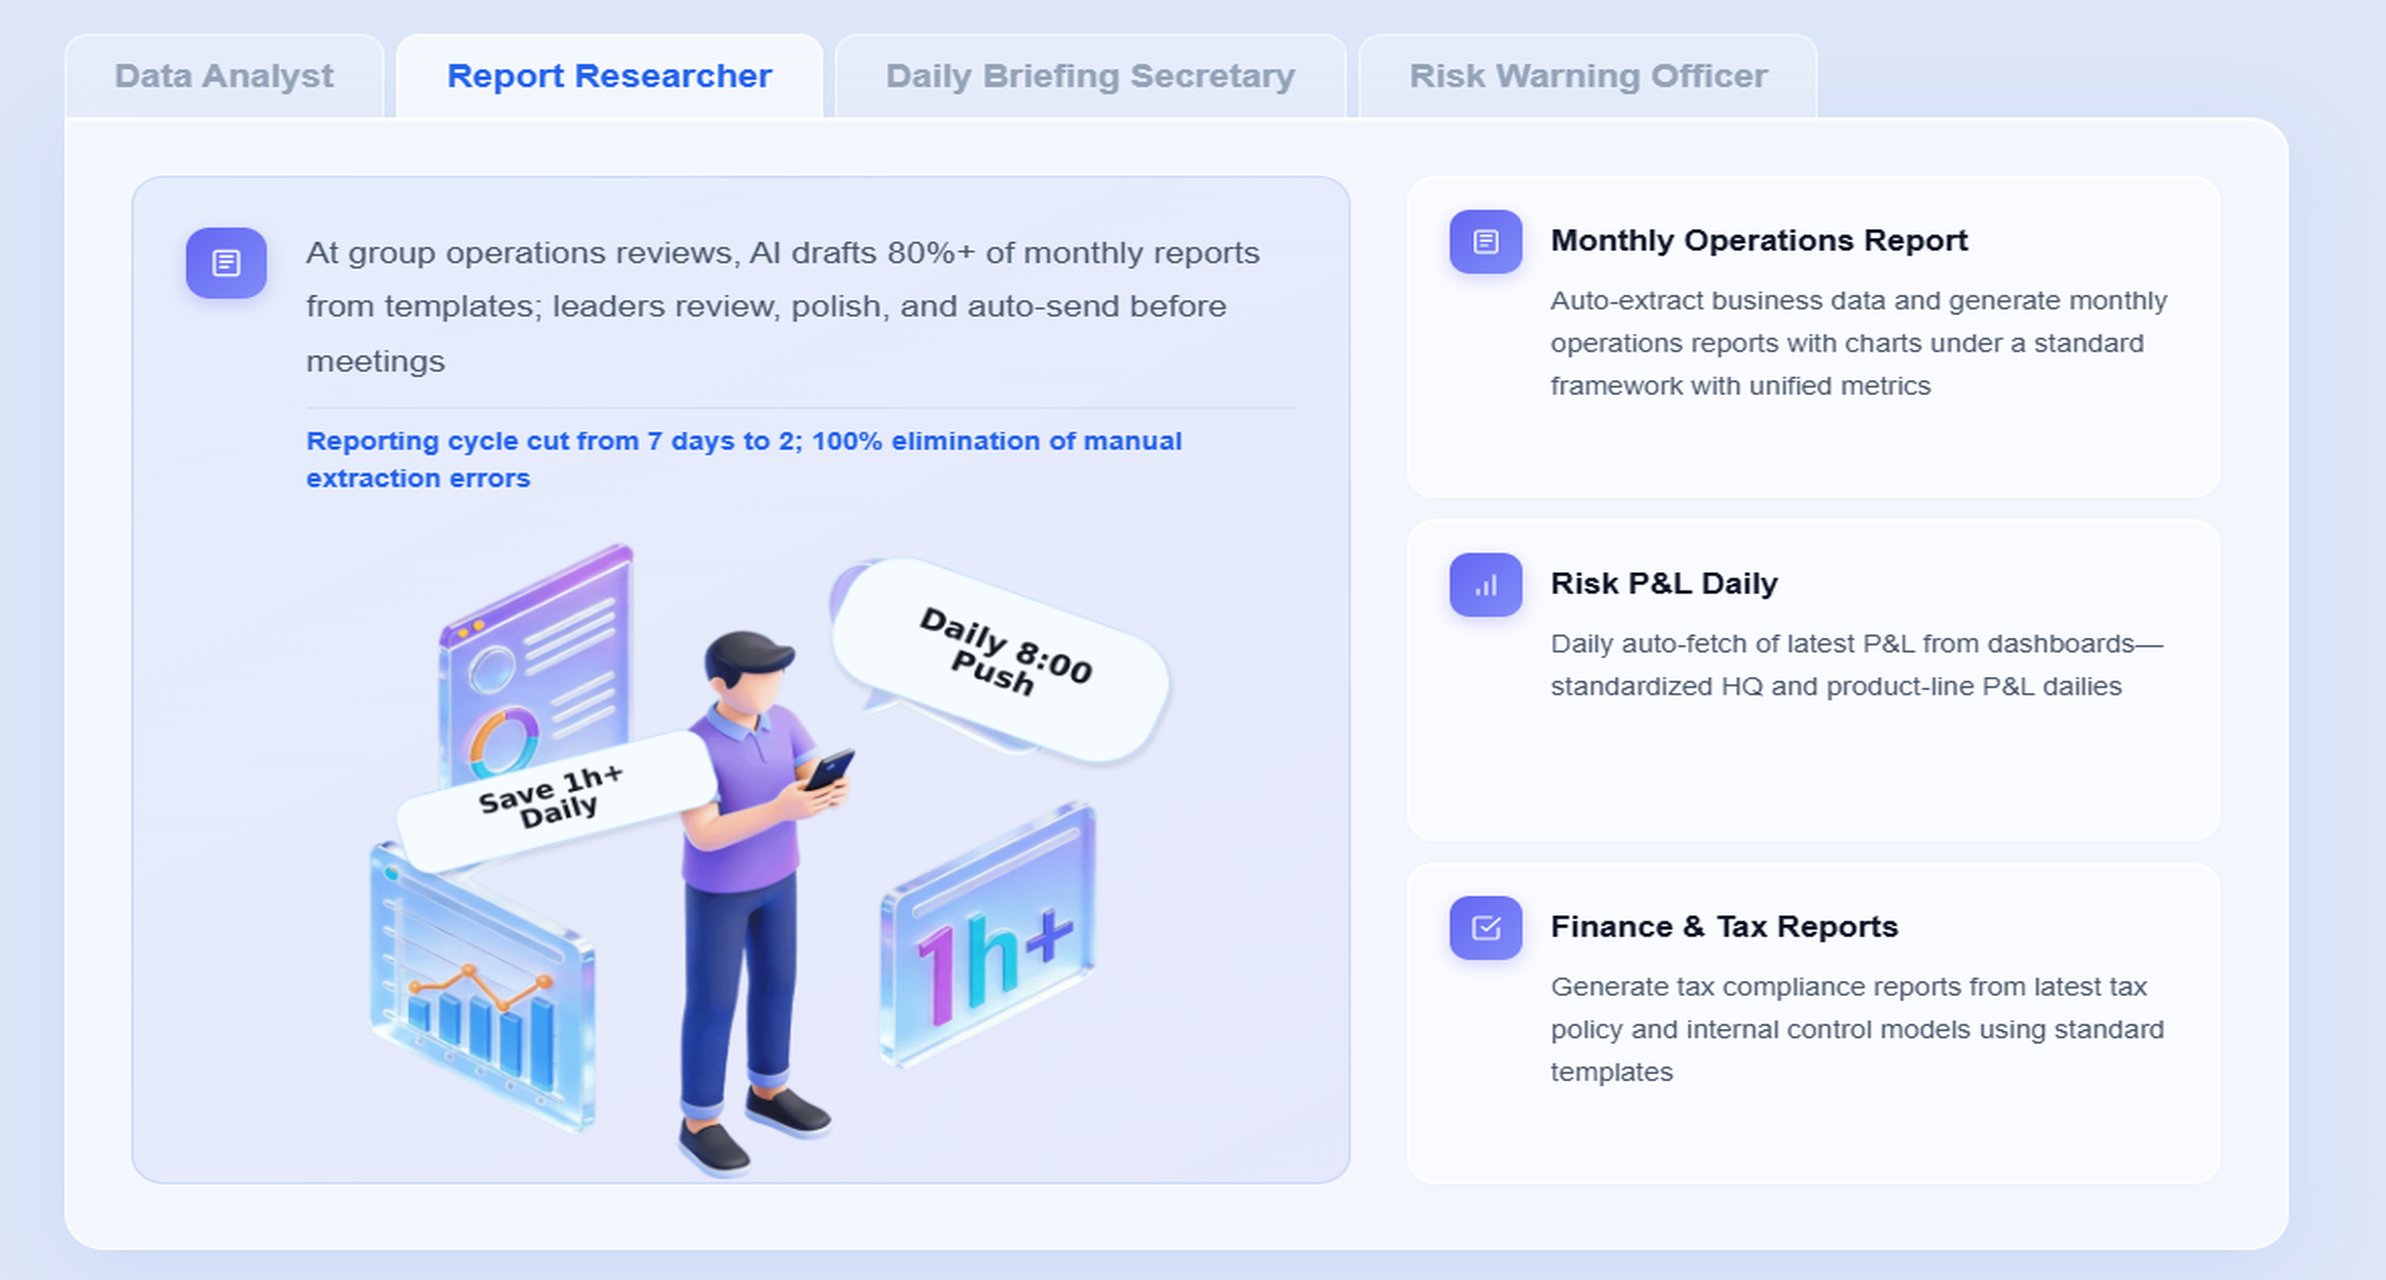
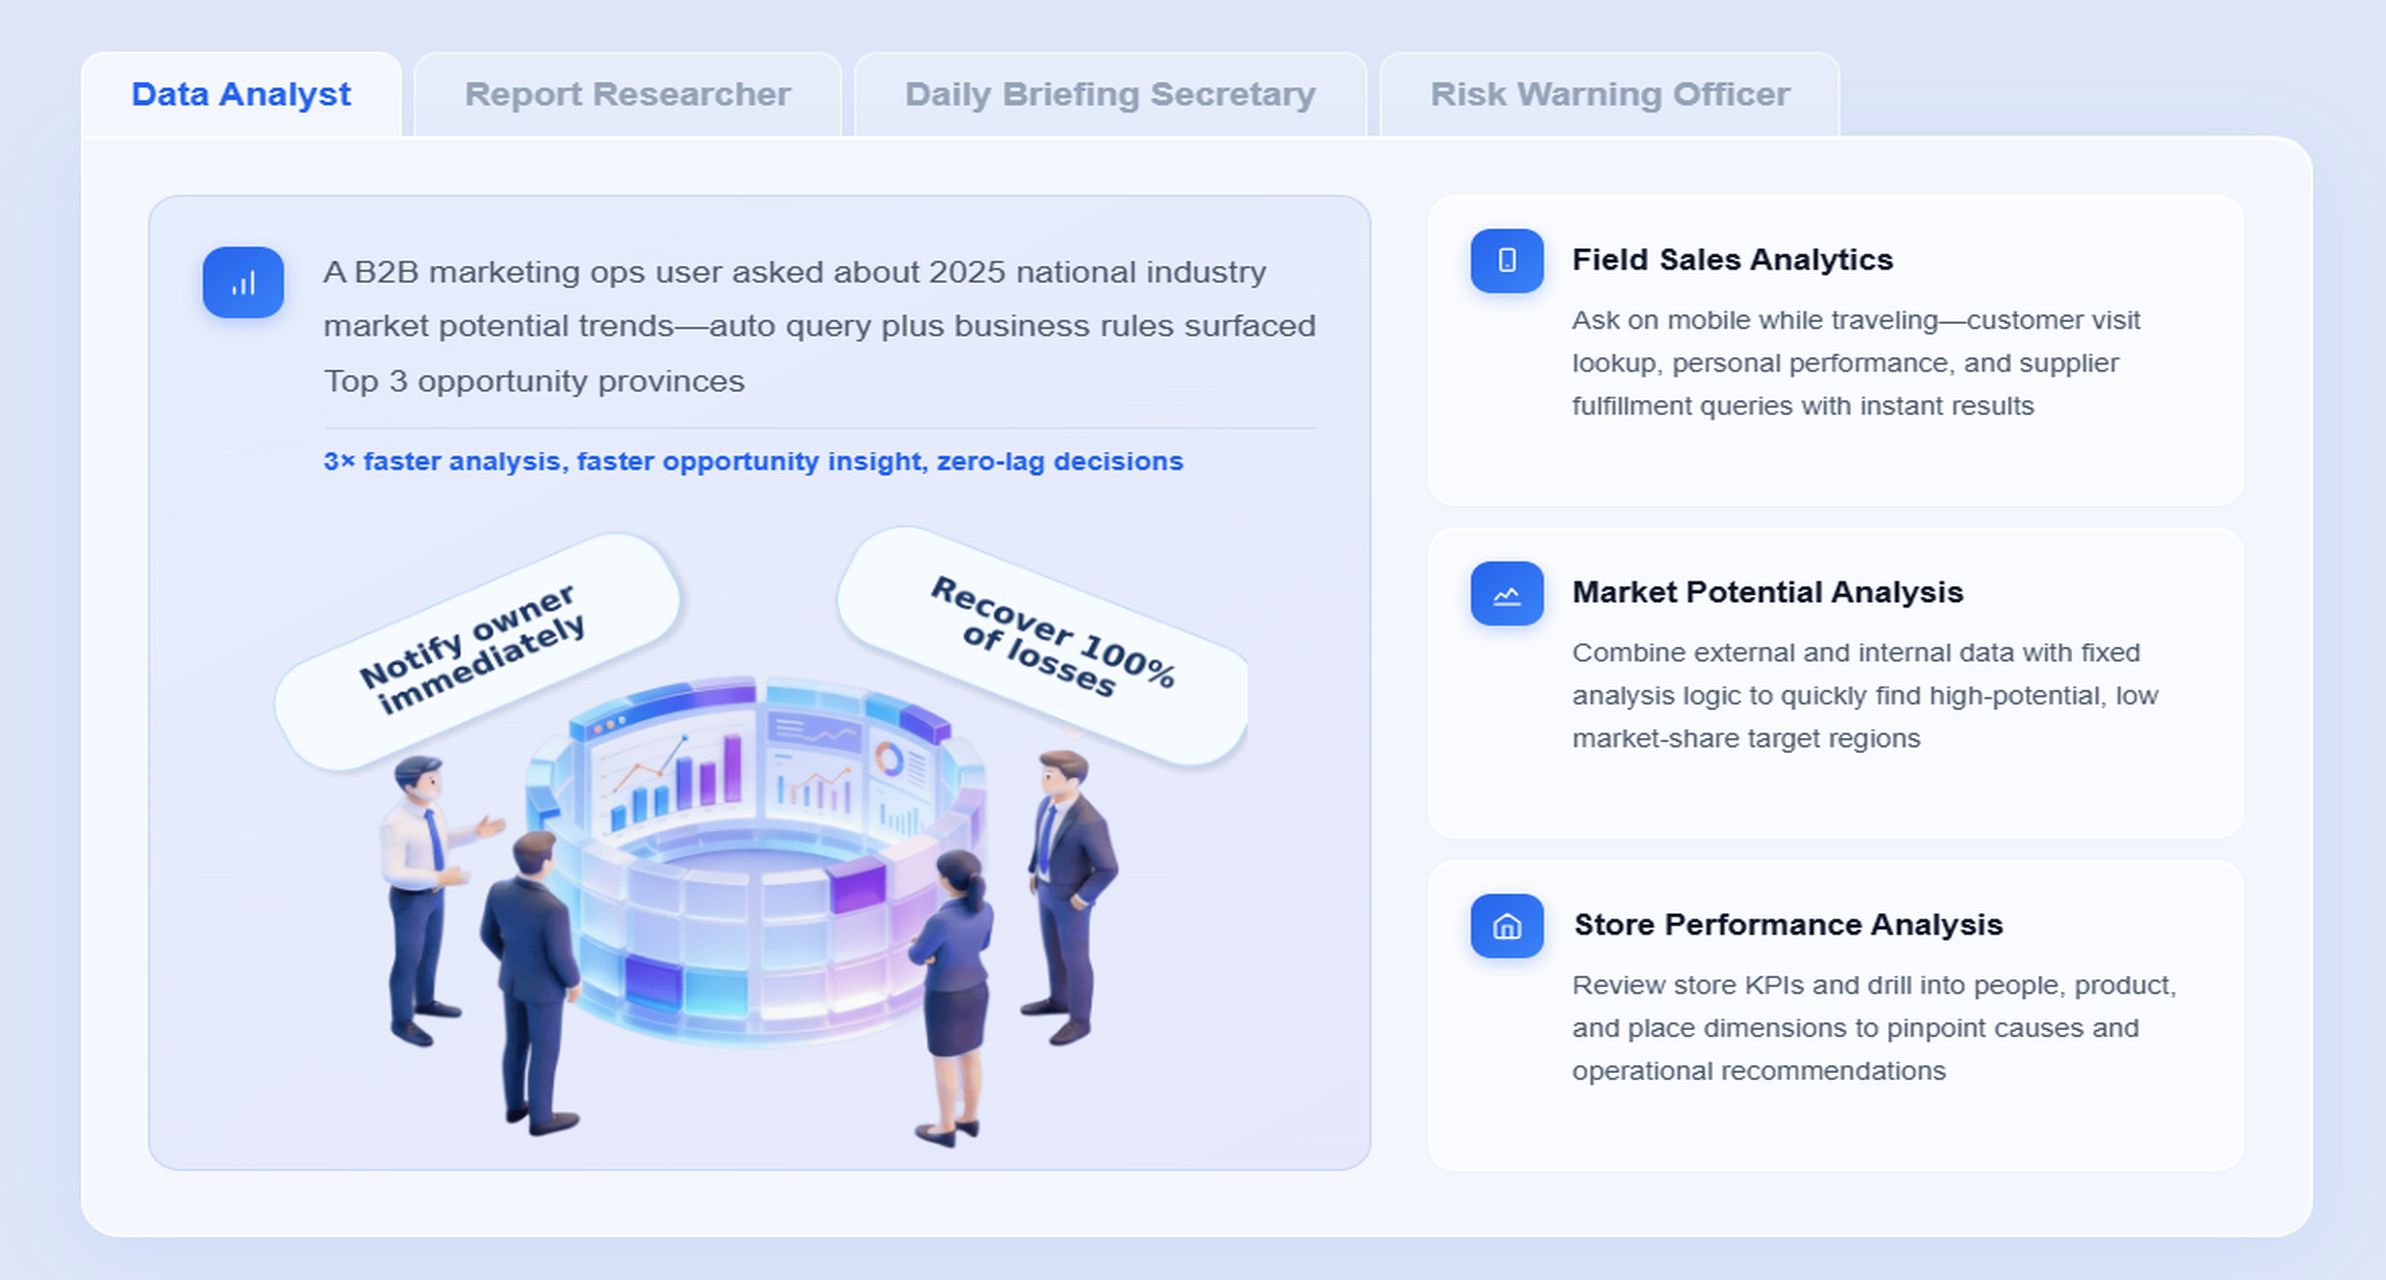
With FineReport, teams can standardize this as a governed portfolio cockpit with reusable status rules, visual thresholds, and drill-through paths to detailed project reports. Dora can then act as a Daily Briefing Secretary or Data Analystdigital employee, turning the dashboard into a chat-accessible executive briefing.
Milestone and timeline dashboard
The milestone and timeline dashboard focuses on delivery confidence rather than task detail.
Executives do not need Gantt chart clutter. They need to know:
which major milestones are due soon
where slippage has already occurred
whether recovery plans exist
which dates are still credible
what decisions are needed to protect timeline commitments
An effective view often combines milestone traffic lights, timeline variance, confidence indicators, and exception notes. A small number of trend visuals is more useful than a full project schedule.
This dashboard is especially important in steering committees because timeline confidence often drives downstream budget, launch, compliance, and customer commitments.
With FineReport, organizations can build milestone reporting templates across project types so executives see a consistent status model. Dora can summarize upcoming deadline exposure, explain slippage patterns, and send periodic milestone briefings before review meetings.
Budget and financial performance dashboard
This dashboard compares approved budget, actual spend, forecast at completion, and value delivered.
For executives, financial visibility must be fast to interpret. They need to spot projects that are:
overspending
underspending because progress is stalled
likely to exceed approved funding
delivering low value relative to cost
requiring reforecast or scope decisions
The most useful executive format usually shows financials alongside delivery context. A project that is above budget but near completion may require a different decision than a project that is above budget and behind schedule.
FineReport is well suited for this scenario because it can pull together formatted management reports, cost tables, variance views, and exception highlights into one operational cockpit. Dora can function as a Report Researcher, generating structured financial narratives such as why budget variance changed this month, which projects need funding review, and what cost pressures deserve leadership attention.
Resource capacity dashboard
A resource capacity dashboard helps leaders understand whether demand is realistic given available staffing.
This view is especially useful when delivery issues are driven less by project execution and more by enterprise bottlenecks such as architecture, procurement, data engineering, QA, legal review, or external vendors.
Core elements often include:
allocation by team or role
overcommitted functions
open demand versus available capacity
upcoming staffing cliffs
resource trend over future periods
portfolio impact of constrained teams
For executives, this dashboard supports prioritization. If one team is constraining ten initiatives, the real conversation is not task management. It is sequencing, trade-offs, and staffing action.
FineReport can standardize capacity views by business unit, program, or portfolio. Dora can monitor recurring constraints, answer natural-language questions about overloaded roles, and push summaries to operations leaders before monthly planning reviews.
Risk and issue escalation dashboard
This dashboard should be short, sharp, and actionable.
Instead of listing every issue logged by every project, the executive escalation view should show:
top risks by impact and urgency
mitigation status
cross-project dependency exposure
unresolved blockers
decisions awaiting executive action
owners and due dates for follow-up
This is where many dashboards go wrong. They confuse visibility with usefulness. Executives do not need a complete issue register; they need the subset of risks that could materially affect delivery, budget, compliance, or business outcomes.
FineReport can structure a governed escalation report with standard risk categories, severity rules, and accountability fields. Dora is especially effective here as a Risk Alert Officer. It can monitor exception thresholds, generate alert summaries, notify responsible owners, and create follow-up records that keep escalation from disappearing after the meeting.
The PMO governance dashboard shows whether projects are being run consistently and with sufficient reporting discipline.
For leadership, this dashboard answers a different kind of question: can we trust the portfolio management process itself?
Useful sections often include:
reporting submission timeliness
stage-gate completion status
compliance with governance checkpoints
completeness of key project fields
variance in status quality across teams
review cadence adherence
This dashboard is not glamorous, but it is crucial. Weak governance often explains why leadership sees surprises late. If project reporting is inconsistent, status criteria are vague, and stage-gate discipline is uneven, executive dashboards become unreliable.
FineReport can support PMO governance through standardized templates, formatted board reports, and scheduled reporting workflows. Dora can provide scheduled governance briefings, identify missing updates, and summarize where reporting quality is weakening across the portfolio.
Executive outcomes dashboard
The executive outcomes dashboard connects delivery to business value.
This is where projects stop being internal activity and become strategic investments. Depending on the organization, outcome metrics may include:
revenue impact
cost savings
productivity gain
customer adoption
service-level improvement
compliance reduction of exposure
operational cycle-time improvement
This dashboard is essential because a project can be delivered on time and on budget while still underperforming in business terms. Leaders need to know whether the portfolio is producing measurable results.
FineReport enables organizations to combine delivery data with business KPI views in one management cockpit. Dora can generate management narratives that link project status to outcome movement, helping executives understand not just what was delivered, but whether it mattered.
Executive reporting breaks down when leaders still have to hunt through multiple dashboards, open several reports, compare periods manually, and ask analysts to explain exceptions. This is where Dora adds practical value as an enterprise Data Agent layer on top of FineReport.
Dora does not replace the reporting foundation. FineReport remains the trusted source for formatted project reports, portfolio cockpits, KPI definitions, templates, and governed data access. Dora turns that foundation into a scenario-specific AI assistant that helps leaders consume reports faster and act on them more consistently.
A concrete executive chat example
A leadership user could ask:
“Summarize this month’s portfolio report, highlight projects with declining milestone confidence, explain budget overruns above threshold, and list the decisions that need executive follow-up.”
This is much closer to how executives actually work. They want a direct answer, supported by trusted reporting assets, not a manual search exercise.
Apply semantic rules and KPI definitions Dora understands the organization’s definitions for health status, forecast confidence, budget variance thresholds, dependency severity, and executive escalation logic.
Generate a structured report summary Dora creates a management-ready narrative covering portfolio movement, key exceptions, timeline risks, and financial concerns in a concise executive format.
Detect exceptions and leadership action points Dora identifies projects with threshold breaches, slipping milestones, unresolved approvals, or high-risk dependencies requiring intervention.
Push summaries and alerts to the right users Dora sends scheduled weekly or monthly briefings to executives, and sends exception pushes to project sponsors, PMO leads, or function heads.
Record follow-up and support ongoing review Dora can help produce follow-up records, unresolved action summaries, and next-review briefing notes for steering meetings.
Why this works in enterprises
Many AI reporting concepts fail because they are disconnected from governed reporting assets. Dora works well in executive reporting because it sits on top of a trusted foundation.
natural-language query over trusted reporting assets
chat-based AI assistant for report consumption
retrieval of reports, metrics, cockpits, and exceptions from FineReport
generation of structured report summaries and chart explanations
scheduled summaries, briefings, and push notifications
digital employees for recurring reporting workflows
skills-based execution for more controllable and auditable AI workflows
This matters because enterprise teams do not need another prompt-only tool with unstable outputs. They need governed AI workflows that respect permissions, semantic rules, report templates, and data quality controls. That gives Dora stronger landing capability than feature-only agent comparisons and makes it a realistic fit for recurring executive reporting.
How to choose the right dashboard format for your organization
Not every organization needs the same build approach. The right choice depends on reporting maturity, data complexity, stakeholder expectations, and governance needs.
leadership mainly needs recurring status snapshots
teams are early in dashboard maturity
Templates are useful for establishing consistency fast. They help PMOs standardize executive views across projects and reduce formatting debates.
But templates also have limits. They often rely on manual updates, offer limited interactivity, and become fragile as the portfolio grows more complex. If leaders need cross-portfolio filtering, automated refresh, or integrated finance and resource data, a simple template may not be enough.
When to build in Power BI or another BI tool
A BI approach is justified when executive reporting requires:
automated refresh from multiple systems
interactive filtering by portfolio, region, owner, or business unit
drill-through from summary to detailed project views
standardized semantic logic across functions
recurring executive reporting at scale
A strong executive dashboard in Power BI or another BI tool should still follow the same principles: clarity, exception focus, and decision support. Better visuals alone do not make a dashboard executive-ready.
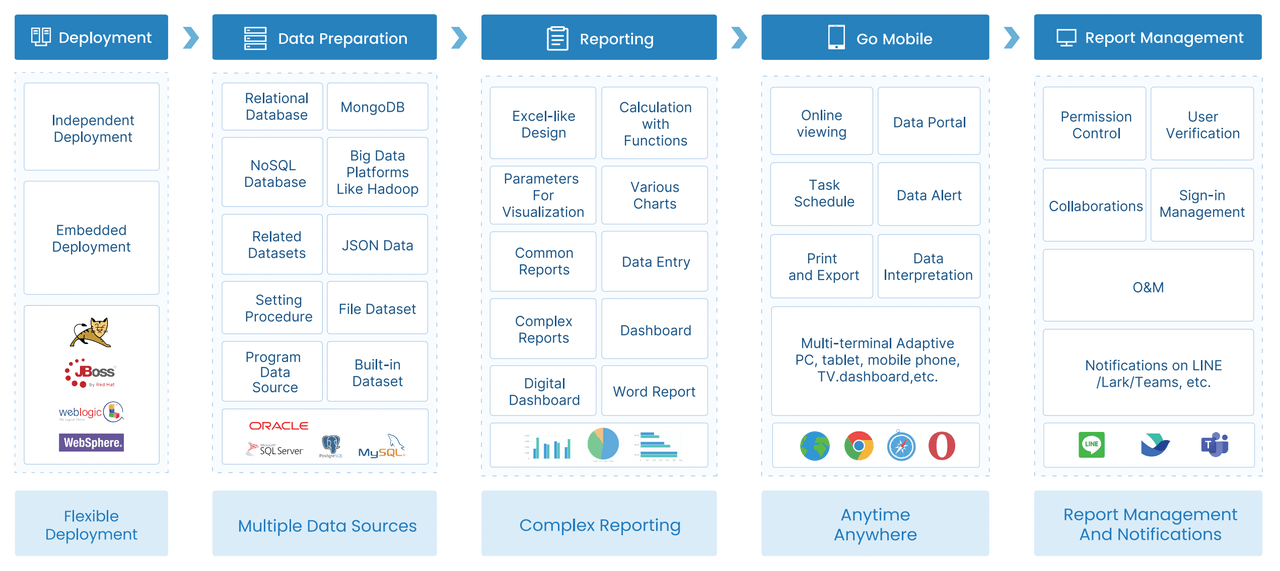
For many enterprises, the bigger challenge is not choosing a visualization tool. It is building trusted report templates, KPI definitions, governance rules, and reusable reporting workflows. That is why FineReport is valuable as a reporting foundation, especially when organizations need both formatted reports and operational cockpit views.
Common mistakes that create guesswork instead of clarity
Some dashboards create more confusion than visibility. Common mistakes include:
overcrowded charts with too many dimensions
inconsistent status rules across projects
vanity metrics with no decision value
too much task-level operational detail
missing context on changes versus prior periods
no distinction between minor issues and executive escalations
weak linkage between project delivery and business outcomes
A good rule is simple: every section of the dashboard should support a leadership decision. If it does not help fund, prioritize, escalate, approve, or intervene, it may not belong in an executive view.
Best practices for presenting dashboards to executives
A good dashboard still needs good reporting discipline. These practical steps improve adoption and decision quality.
1. Standardize KPI definitions and exception rules
Executives lose confidence quickly when one project defines “at risk” differently from another. Standardize status logic, risk levels, forecast confidence, and budget thresholds across the portfolio.
This is also essential for AI. Dora can only generate reliable summaries when business terms, KPI definitions, and exception logic are governed.
2. Build a semantic reporting layer, not just charts
Dashboards should reflect business meaning, not raw data fields. Define what counts as milestone confidence, what qualifies as a critical dependency, and what triggers executive escalation.
This semantic layer improves both FineReport design and Dora’s ability to return accurate chart-based answers and structured summaries.
3. Start with high-value recurring executive reports
Do not try to automate every project report at once. Start with recurring, high-value scenarios such as:
monthly portfolio reviews
steering committee briefs
budget variance summaries
risk escalation reports
executive outcome reviews
These use cases create clearer business value and make Dora easier to land as a practical digital employee.
4. Preserve permission governance in AI reporting workflows
Executive dashboards often include sensitive financial, staffing, or project-risk information. AI outputs must respect the same access boundaries as the underlying reports.
FineReport provides governed permissions. Dora should operate within those access controls so summaries, alerts, and answers stay enterprise-safe.
5. Pair every dashboard with a short management narrative
A dashboard alone does not complete the reporting job. For each executive review, include a short narrative covering:
what changed
why it matters
what action is required
This is where Dora can save time. Teams can use AI-generated structured report summaries with human review, then gradually expand Skills for recurring briefing, follow-up, and exception push workflows.
Building this manually is complex. FineReport helps teams standardize trusted reports, operational cockpits, templates, and reporting workflows. Dora turns those assets into an AI assistant that can answer report questions in chat, generate structured summaries, push scheduled briefings, monitor exceptions, and follow up with responsible owners.
For executive project reporting, this combination is practical because it matches how enterprises actually operate:
FineReport provides the trusted reporting foundation for portfolio dashboards, milestone reports, financial summaries, PMO governance views, and executive outcome cockpits.
Dora adds the enterprise Data Agent layer for report consumption, briefing generation, exception monitoring, and governed follow-up.
That means leaders can move from passive dashboard viewing to guided action. Instead of asking analysts to manually prepare every monthly summary, Dora can help produce scheduled management narratives, answer natural-language questions over trusted reporting assets, and push the right exceptions to the right owner.
FineReport + Dora is not only a reporting upgrade; it is a practical fourth-generation Agentic BI path. FineReport provides governed reports and operational cockpits. Dora provides the AI assistant layer for scenario execution, with more controlled Skills, lower token waste, faster execution paths, and more stable workflows than prompt-only agents.
Get Ready-to-Use Dashboard Templates in Fine Gallery
The strongest Dora pitch is scenario + product + service: FineReport provides the trusted reporting foundation, Dora provides the AI digital employee, and implementation service connects data, governance, semantic setup, Skills, report templates, permissions, and rollout.
If your team wants executive dashboards that do more than display charts, this is the practical path: standardize the reporting layer first, then add AI for chat-based answers, structured summaries, scheduled briefings, and exception follow-up.
An executive dashboard should focus on portfolio health, milestone confidence, budget position, delivery risk, resource capacity, and business impact. It should show what changed, what needs attention, and what decisions are required next.
Executive dashboards summarize trends, exceptions, and strategic priorities, while project manager dashboards usually track detailed tasks and daily execution. Leaders need a decision layer, not a task board in another format.
The most useful KPIs usually include portfolio status, budget versus actuals, forecast at completion, milestone confidence, escalation count, and resource utilization. These metrics help executives assess control, risk, and likely outcomes quickly.
Most executive dashboards should refresh at least weekly, with monthly rollups for formal business reviews. Critical risk, budget, or milestone exceptions should be updated in near real time so leaders can respond faster.
FineReport can centralize trusted dashboard views, while Dora can turn report data into plain-language summaries, alerts, and scheduled briefings. This helps executives understand changes faster and act on exceptions without digging through raw reports.
Product Trial
FineReport
Pixel-perfect reports · Interactive dashboards · Easy data entry · Digital twins