If you searched for power bi developer, you are probably trying to answer one of three questions: what this role actually does, whether your company needs one, or how to become one yourself. In simple terms, a Power BI developer is the person who turns raw business data into usable reporting assets such as dashboards, reports, semantic models, and governed metrics that help teams make decisions faster.
For hiring managers, this role matters because reporting projects often fail when no one owns the gap between business questions and technical implementation. For analysts and aspiring BI professionals, it matters because Power BI development sits at the intersection of data preparation, modeling, visualization, and stakeholder delivery.
Quick Answer: What Does a Power BI Developer Do?
| Area | What a Power BI Developer Typically Handles |
|---|---|
| Primary goal | Build and maintain data models, reports, and dashboards in Power BI |
| Main users supported | Executives, managers, analysts, and business teams |
| Core tools | Power BI Desktop, Power BI Service, Power Query, DAX, data sources such as SQL and Excel |
| Key responsibilities | Data prep, modeling, visualization, publishing, security, optimization, and support |
| Common deliverables | Interactive dashboards, operational reports, reusable datasets, KPI definitions, documentation |
| Business value | Faster reporting, clearer metrics, better self-service analytics, less manual spreadsheet work |
| Often works with | Data analysts, data engineers, BI managers, IT, and business stakeholders |
| Success depends on | Technical skill, business understanding, and strong communication |
A good Power BI developer is not just a dashboard builder. They are usually responsible for making sure the numbers are trusted, the logic is documented, the visuals are useful, and the final output can be maintained after launch.
What a Power BI Developer Is and Why the Role Matters

A Power BI developer is a BI professional who designs, builds, publishes, and maintains reporting solutions in Microsoft Power BI. The role usually includes connecting data from multiple systems, transforming and modeling it, creating DAX calculations, designing dashboards, and managing delivery inside Power BI workspaces.
In a modern data team, this role often sits between upstream data engineering and downstream business decision-making. That position is why it matters so much: many organizations have plenty of data, but very few people who can translate that data into something decision-makers can actually use.
A Power BI developer helps solve business problems such as:
- Slow, manual reporting cycles
- Conflicting KPI definitions across departments
- Poor visibility into sales, finance, operations, or customer performance
- Unreliable spreadsheets and disconnected data sources
- Low adoption of dashboards because reports are hard to use
This role is also different from several adjacent jobs:
- Data analyst: Often focuses more on ad hoc analysis, insights, and business interpretation
- BI engineer: Usually works more on architecture, pipelines, warehouse structure, and platform scalability
- Report consumer: Uses dashboards and reports but does not build or govern them
In many companies, one person may wear more than one of these hats. But when the title is specifically power bi developer, the expectation is typically that the person can own reporting delivery from data intake through dashboard publication.
Core Power BI Developer Roles and Skills
The day-to-day reality of Power BI development is broader than most people expect. The role combines technical execution with practical decision support. A developer is expected to not only build reports, but also make sure those reports reflect agreed business logic and remain usable over time.
Main responsibilities often include:
- Preparing and transforming raw data
- Building semantic models and relationships
- Writing DAX measures and calculated columns
- Designing report layouts and dashboards
- Setting up publishing workflows and refresh schedules
- Managing permissions and security
- Validating numbers with stakeholders
- Improving performance and usability after launch
The strongest Power BI developers also understand that a report is only successful if the intended audience uses it. That means communication, requirements gathering, and revision cycles are not side tasks. They are part of the job.
Technical capabilities used in day-to-day work
Data preparation and transformation
Most projects begin with messy data. A Power BI developer often connects to source systems such as SQL databases, spreadsheets, cloud apps, flat files, or APIs, then uses Power Query or related methods to clean and shape the data.
Typical work here includes:
- Removing duplicates and errors
- Standardizing field names and formats
- Joining or merging datasets
- Creating date tables and business-friendly dimensions
- Filtering unnecessary columns and rows
- Structuring data so the model performs well later
Good data preparation reduces confusion downstream. Poor preparation creates dashboard problems that no amount of visual polish can fix.
DAX measures and calculated columns
DAX is one of the most important technical capabilities in the role. Developers use it to define metrics such as revenue, profit margin, year-over-year growth, forecast variance, and conversion rates.
This is where much of the business logic lives. A developer may need to decide how a KPI should behave across filters, time periods, business units, or drill-down levels. That is why DAX skill is not only technical. It also requires understanding how the business defines success.
Semantic modeling and performance tuning
A Power BI report depends on the quality of its model. Power BI developers often build reusable semantic models so multiple reports can use the same trusted definitions.
This includes work such as:
- Creating table relationships
- Designing dimensions and facts
- Simplifying model structure for usability
- Reducing model size where possible
- Improving performance for large datasets
- Testing how visuals behave under filters and cross-highlighting
When reports are slow, the problem often starts in the model rather than the chart.
Security setup, publishing, and workspace management
A report is not truly complete until it is governed and published correctly. Developers may help set up row-level security, publish content to the right workspace, manage refresh schedules, and support lifecycle processes between development and production environments.
They also need to understand who should see what. A sales manager may need only one region’s numbers, while leadership may need company-wide visibility.
Business and collaboration skills that support delivery
Gathering reporting requirements
One of the biggest reasons BI projects go off track is vague requirements. A Power BI developer often spends time asking questions such as:
- What decision is this dashboard meant to support?
- Who will use it and how often?
- Which KPIs are truly necessary?
- What definitions are already approved?
- What level of detail is required?
Without this step, teams often build reports that look impressive but answer the wrong question.
Translating KPIs into usable visuals
A KPI may sound simple in a meeting, but translating it into a chart, card, trend, or decomposition view takes judgment. Developers decide how to show comparison periods, exceptions, targets, and drill paths in ways that are intuitive to business users.
That means choosing visuals for clarity, not novelty.
Managing feedback cycles and revisions
Most dashboards go through multiple rounds of stakeholder feedback. A developer may need to reconcile conflicting requests, explain why two teams see different numbers, or redesign a page because users cannot find the insight quickly enough.
This iteration is normal. Strong developers manage it calmly and keep the project grounded in business value.
Documenting logic and assumptions for handoff
Documentation is often overlooked, but it is essential. If a report owner leaves the company and no one understands how a metric was built, the dashboard becomes risky to maintain.
Good handoff materials often include:
- KPI definitions
- Data source notes
- Calculation logic
- Filter assumptions
- Refresh behavior
- Access rules
- Known limitations
Daily Tasks a Power BI Developer Actually Handles
A typical day for a Power BI developer is rarely just “building dashboards.” Most days involve a mix of new development, bug fixing, validation, user support, and maintenance.
A developer’s work may shift hour by hour between:
- Reviewing a new stakeholder request
- Investigating a refresh failure
- Updating a DAX measure after a definition change
- Redesigning a cluttered report page
- Publishing a revised dashboard
- Testing access permissions
- Responding to user feedback after release
In some companies, developers spend more time on maintenance than on net-new dashboard creation. That is especially true in mature BI environments where dozens or hundreds of reports already exist.
Common workflows from raw data to finished dashboard
A common Power BI workflow follows a practical sequence from intake to adoption.
Connecting to source systems and validating data quality
Before any design work begins, the developer needs to understand where the data comes from and whether it can be trusted. That means checking refresh frequency, field consistency, missing values, duplicates, and basic reconciliation against known totals.
Building reusable datasets and measures
Rather than create every metric independently in every report, developers often build a reusable dataset or semantic layer that centralizes logic. This makes reporting more consistent and reduces duplicate work.
Designing report pages for clarity and usability
Once the data structure is stable, the developer creates report pages tailored to the audience. Leadership dashboards usually prioritize high-level KPIs and trends. Operational users often need more filters, details, and drill-down paths.
Page design usually involves:
- Prioritizing the most important numbers
- Grouping related visuals together
- Controlling color use for readability
- Making filters easy to understand
- Reducing unnecessary visual noise
Publishing updates and monitoring adoption
After testing, the report is published and shared. But delivery does not stop there. Developers may track usage, gather feedback, and monitor whether users are actually opening and relying on the report.
A dashboard that nobody uses is not a successful deliverable, even if the build was technically correct.
Ongoing maintenance and support work
A large part of the power bi developer role is keeping reports accurate and usable after launch.
Troubleshooting broken visuals or refresh failures
Data sources change, credentials expire, schemas shift, and visuals sometimes fail unexpectedly. Developers investigate the root cause, fix the model or connection, and restore reporting continuity.
Adjusting reports when business definitions change
This is one of the most common realities in BI work. A metric like “active customer,” “qualified lead,” or “gross margin” may change definition over time. When that happens, the developer updates the model, report logic, documentation, and often the stakeholder expectations too.
Optimizing slow reports and large models
As usage grows, performance becomes a bigger concern. Developers may need to simplify visuals, improve DAX, reduce unnecessary columns, aggregate data, or redesign parts of the model so reports remain responsive.
Keeping permissions and governance controls current
Teams change. New users join. Departments reorganize. Access rules must stay aligned with governance and privacy requirements. Developers or BI admins often maintain these controls over time.
Typical Deliverables and What Stakeholders Receive
When companies hire a Power BI developer, they are usually expecting more than a few charts. They want a set of usable BI assets that support recurring decisions and reduce reporting friction.
Typical outputs include:
- Executive dashboards
- Departmental reports
- Operational scorecards
- Reusable datasets or semantic models
- KPI definitions and data dictionaries
- User instructions or training materials
- Access setup and governance configuration
It also helps to distinguish a few common terms:
- Dashboard: A visual summary of important metrics, often designed for monitoring and quick review
- Report: A more detailed interactive analysis view, often with multiple pages and filters
- Dataset or semantic model: The structured layer that powers reports and standardizes calculations
- Data model: The relationships, tables, calculations, and logic behind the reporting experience
Stakeholders often see the dashboard. But the report quality depends heavily on the dataset and data model behind it.
Common deliverables in real projects
Interactive dashboards for leadership and business teams
These dashboards usually focus on high-priority metrics such as revenue, margin, pipeline, customer churn, service levels, or production performance. The developer designs them for quick interpretation and drill-down when needed.
Standardized reports for recurring operational reviews
Many teams need recurring weekly or monthly review packs. A Power BI developer can replace manual spreadsheet compilation with standardized reports that update automatically and keep definitions consistent.
Reusable semantic models and certified datasets
This is one of the highest-value deliverables, especially in larger organizations. Instead of every analyst reinventing metrics, a shared model helps teams work from a trusted foundation.
Data dictionaries, metric definitions, and user guidance
These may not be the most visible deliverables, but they matter. They reduce confusion, improve continuity, and help business teams use the report correctly.
Career Path, Job Market, and How to Get Started
The power bi developer career path is a good fit for people who enjoy both problem-solving and communication. It suits professionals who like making data practical, not just technical.
Common entry points include:
- Data analyst roles that expand into report ownership
- SQL or reporting roles moving toward modern BI platforms
- Excel-heavy business roles transitioning into dashboard development
- Junior BI roles supporting senior developers or analytics teams
Employers often describe openings in slightly different ways. Some roles focus heavily on dashboard creation. Others emphasize data modeling, SQL, DAX, governance, or Microsoft ecosystem knowledge. In smaller teams, the Power BI developer may also handle responsibilities closer to BI engineering or analytics enablement.
Practical ways to get started include:
- Learn core Power BI Desktop workflows
- Practice Power Query and DAX on real business scenarios
- Build a small portfolio of dashboards with documented KPI logic
- Learn basic SQL and data modeling concepts
- Study report usability, not just visual aesthetics
- Get comfortable explaining metrics to non-technical users
Where aspiring developers research roles and growth opportunities
Job boards, company listings, and location-based openings
General job boards and company career pages are still the most direct way to understand what employers want. Search by title variations such as Power BI Developer, BI Developer, Reporting Developer, or Analytics Developer.
Community forums and practitioner discussions
Community spaces help aspiring developers understand the real-world side of the role, especially common pain points, project expectations, and tool-specific best practices.
Official learning hubs and product documentation
Official documentation is useful for learning platform capabilities, DAX behavior, publishing workflows, and administration basics.
Structured roadmaps for skill development and portfolio building
A strong roadmap usually combines technical practice with business framing. It is not enough to know how to create a chart. You also need to know why that chart helps a team act.
Practical Recommendations for Hiring Managers and Aspiring BI Developers
If you are evaluating the power bi developer role for your team or career, focus on these practical points:
- Assess business understanding, not just tool familiarity. A developer should be able to clarify requirements and challenge vague KPI definitions.
- Prioritize modeling and metric logic. Attractive reports matter, but trusted calculations and reusable semantic models matter more.
- Test communication skills during hiring. The role often requires translating technical tradeoffs to business stakeholders.
- Build for maintainability from the start. Documentation, naming conventions, and governance save significant time later.
- Measure success by adoption and decision impact. A good dashboard is one people rely on, not just one that gets delivered on time.
When Teams Need More Than Power BI Dashboards
Power BI is widely used for dashboarding, reporting, and analytics in Microsoft-centric environments. For many teams, it is a strong fit. But some organizations eventually find that the challenge is no longer just building dashboards. The challenge becomes making analytics easier for more business users, standardizing self-service, and extending insight delivery into guided AI-assisted workflows.
That is where teams may also consider platforms beyond a single reporting tool.
Tools like Power BI are widely used in the BI market, but teams that need a more business-user-friendly, self-service BI platform may also consider FineBI.
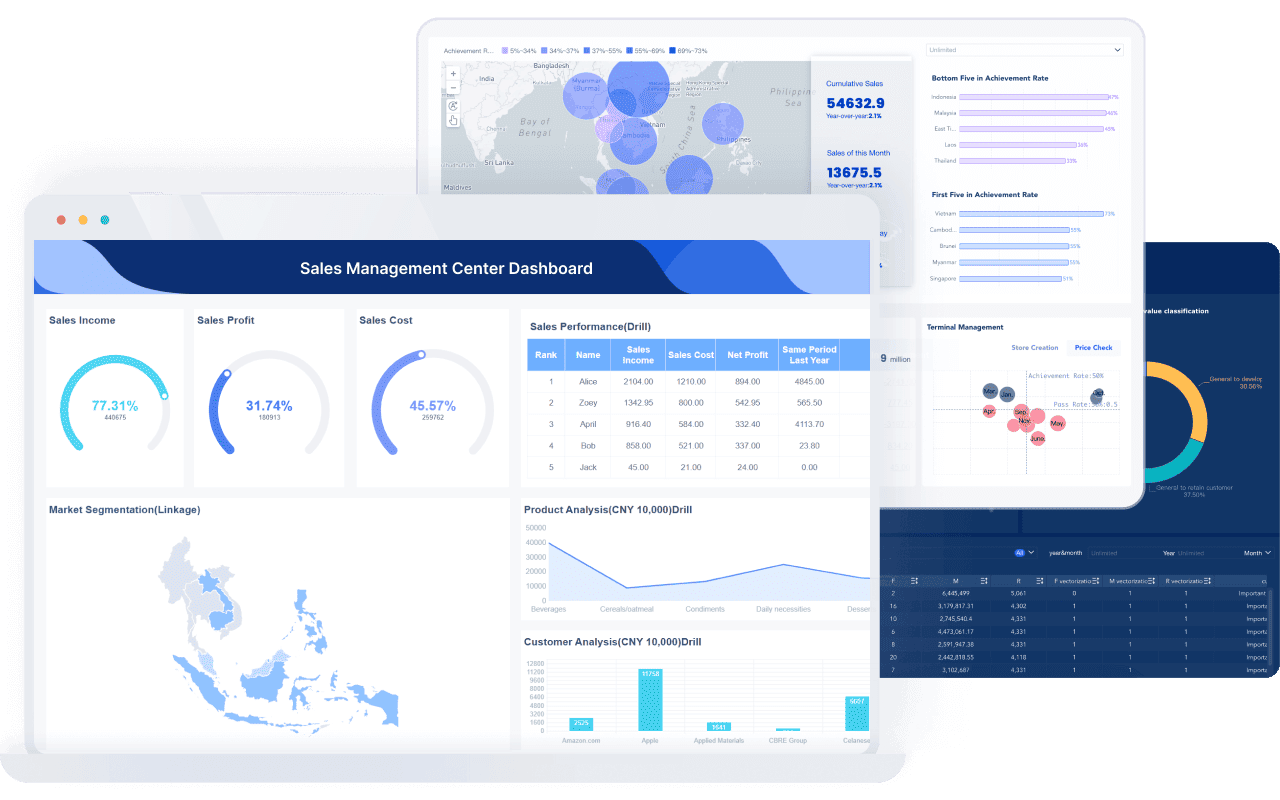
FineBI is designed for self-service BI and interactive dashboard creation, with a focus on helping business teams explore data through drag-and-drop analysis, drill-down workflows, and reusable dashboard experiences. For organizations that want to reduce dependence on highly technical report development for every request, that positioning can be relevant.
A practical fit for FineBI often includes teams that need:
- Self-service analysis for business users
- Interactive dashboards with easier exploration
- Faster dashboard iteration across departments
- Shared metric views supported by enterprise connectivity
- Broader dashboard adoption beyond specialist developers
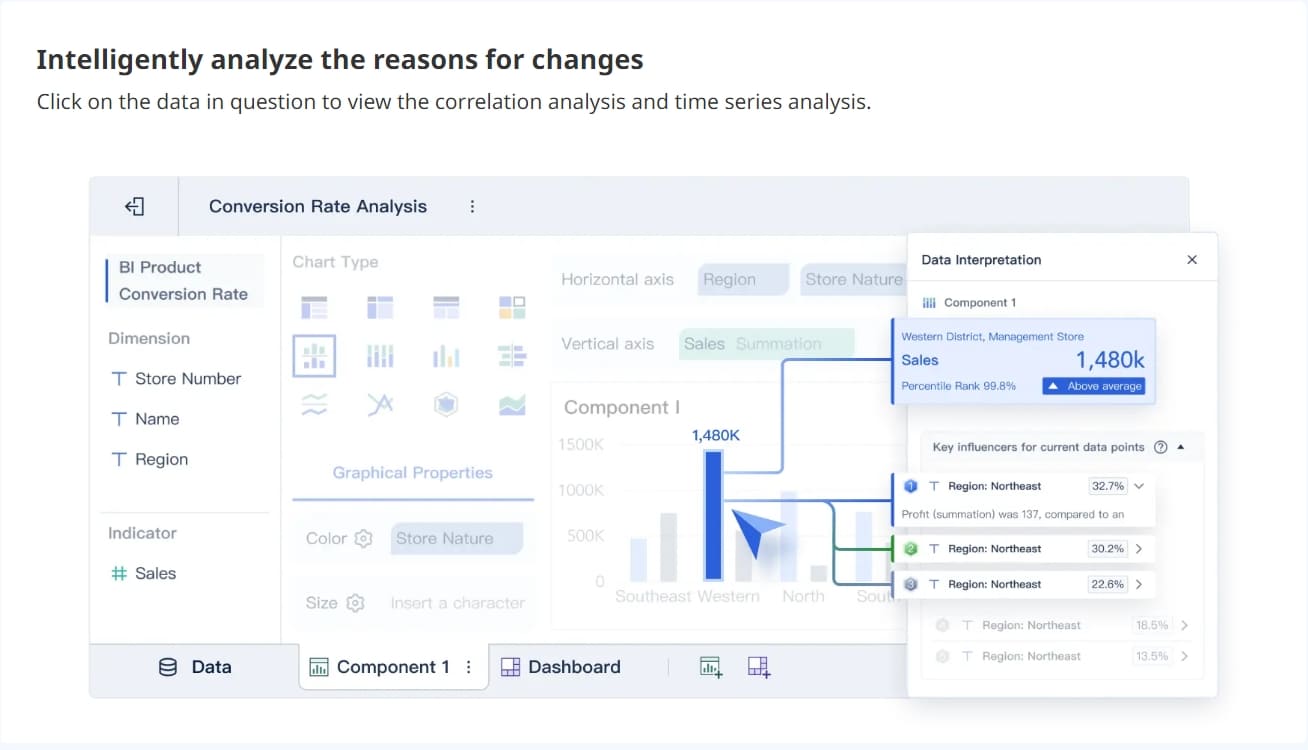
Dora extends this further. Dora is FanRuan’s enterprise Data Agent platform. It works as an AI assistant and AI digital employee layer on top of FineBI and existing enterprise data assets. Rather than replacing BI, Dora uses the trusted dashboard, metric, and semantic foundation to support more governed, scenario-based AI interactions.
With FineBI + Dora, enterprises can move from simply viewing dashboards to enabling AI-assisted analysis workflows such as:
- Natural-language data requests
- Governed metric interpretation
- Summaries and chart generation
- Alerting and follow-up support
- Scenario-specific AI roles such as a Data Analyst digital employee, Report Researcher, Daily Briefing Secretary, or Risk Alert Officer
 Ask Dora In Natural Language
This is best understood as an Agentic BI approach: trusted data foundations in FineBI, combined with Dora’s governed AI workflow layer for answering, summarizing, and following up in business scenarios.

Get Ready-to-Use Dashboard Templates in Fine Gallery
Final Thoughts
A power bi developer is not just someone who creates visuals. The role exists to turn raw data into trusted, governed, and usable reporting assets that help the business act. That includes data preparation, DAX logic, modeling, dashboard design, publishing, support, optimization, and stakeholder communication.
If you are hiring for this role, look for a mix of technical depth and business judgment. If you are trying to become one, focus on building practical projects that show not only what you can create, but how you think about metrics, usability, and delivery.
And if your organization is evaluating how to scale from dashboards toward broader self-service and AI-assisted analytics, it may be worth exploring how FineBI + Dora can complement that journey.
FAQs
A Power BI developer typically connects data sources, cleans and transforms data, builds models, writes DAX measures, designs dashboards, and publishes reports. They also validate numbers with stakeholders, manage refreshes and permissions, and improve report performance over time.