Finance leaders do not need more charts. They need faster visibility into the numbers that change decisions. The best accounting dashboard for financial reporting helps CFOs, CEOs, and executive teams spot risk early, protect margins, manage cash with confidence, and align the business around the same financial truth.
If your current reporting process still depends on static spreadsheets, disconnected systems, or board packs that arrive too late to act on, the cost is real: slower decisions, inconsistent KPI definitions, and leadership meetings spent debating numbers instead of discussing action. A strong executive financial dashboard solves that by turning accounting data into an operational decision system.
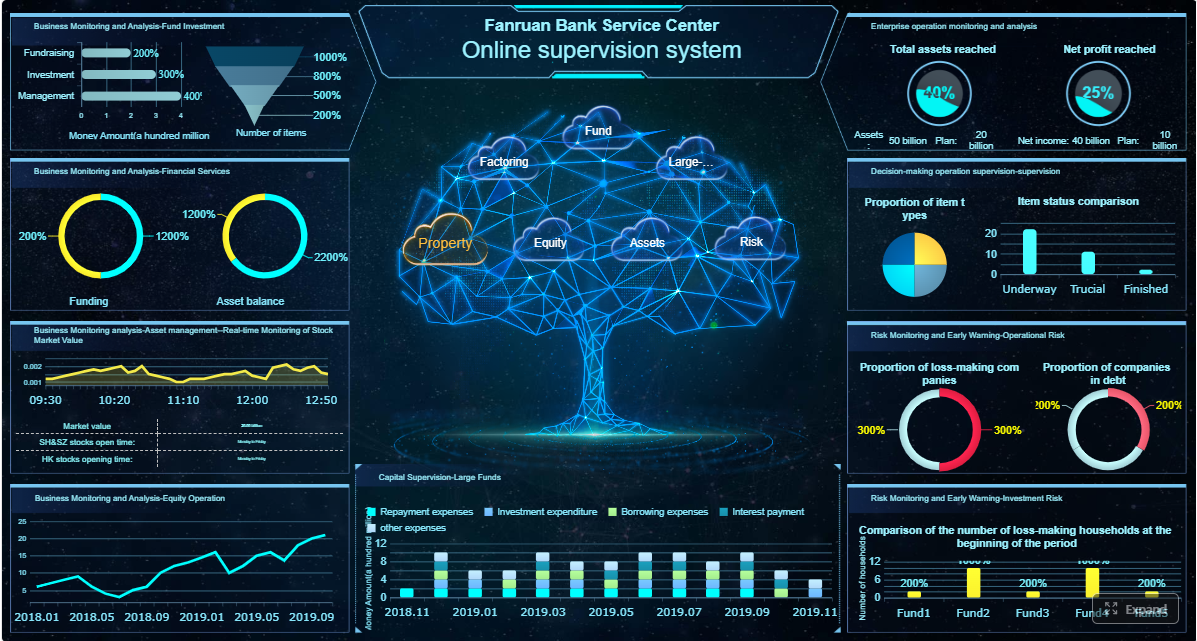
Click To Try The Dashboard
What makes the best accounting dashboard for financial reporting
The core purpose of an executive financial dashboard is simple: make financial performance visible enough to drive action quickly. It should help leadership understand what changed, why it changed, and what requires intervention.
For enterprise decision-makers, the value is not the volume of data displayed. It is the ability to answer questions such as:
Are margins holding up?
Is cash tightening faster than expected?
Where are we missing budget?
Which business unit is creating the largest variance?
How much confidence should we place in the current forecast?
Financial reporting dashboards vs operational dashboards vs board packs
A financial reporting dashboard is built for executive visibility into business health. It focuses on KPIs tied to profitability, liquidity, efficiency, and risk.
An operational dashboard tracks day-to-day execution. It may show shipment delays, production output, service levels, or campaign performance. These views are useful, but they are not substitutes for executive finance reporting.
A board-level reporting pack is broader and more narrative-driven. It often includes strategic commentary, compliance material, market updates, and summarized financial results. It is essential for governance, but not ideal for frequent management decisions.
The best accounting dashboard for financial reporting sits between those two worlds. It is concise like an executive tool, but dynamic enough to support deeper analysis.
Why CFOs judge dashboards by actionability, trust, and visibility
CFOs typically evaluate dashboards using three practical criteria:
Actionability: Does the dashboard surface issues that lead to a decision?
Trust: Are the numbers defined consistently and sourced from governed data?
Visibility: Can leadership understand performance in minutes, not after a lengthy explanation?
A dashboard with dozens of visualizations but no clear executive signal fails on all three. The best one highlights material changes, preserves metric consistency, and supports drill-down when leaders need detail.
Key Metrics (KPIs) that define dashboard quality
When evaluating whether a dashboard is truly executive-ready, use these KPI quality standards:
Decision relevance: Each KPI should support a real management decision such as budget reallocation, cash preservation, or cost control.
Financial objective alignment: Every metric should connect directly to profitability, liquidity, efficiency, or risk.
Comparative context: KPIs should show current value against budget, forecast, prior period, or target.
Variance visibility: Material deviations must be obvious without requiring manual analysis.
Timeliness: Data refresh cadence should match the pace of the decision being made.
Consistency: Definitions, formulas, and reporting periods must remain stable across teams.
Drill-down capability: Executives should be able to move from summary to root cause by entity, function, or time period.
The 7 CFO-approved KPI rules for executive visibility
Rule 1: Prioritize decision-driving metrics
Executive dashboards should focus on KPIs that directly influence capital allocation, cash planning, margin protection, and forecast confidence. If a metric does not change an executive decision, it likely does not belong on the main view.
In practice, this means emphasizing measures like operating cash flow, EBITDA trend, budget variance, and working capital efficiency over low-impact supporting metrics.
A seasoned CFO will always ask: What action would I take if this moves? If the answer is unclear, remove it or move it to a lower-level report.
Rule 2: Tie every KPI to a financial objective
A dashboard becomes far more useful when each KPI is explicitly tied to one of four executive priorities:
Profitability
Liquidity
Efficiency
Risk management
For example, gross margin supports profitability, cash conversion cycle supports liquidity, close cycle time supports efficiency, and covenant headroom supports risk management.
This structure helps leadership review performance in a disciplined way instead of reacting to isolated data points.
Rule 3: Balance lagging and leading indicators
Many finance dashboards overemphasize historical reporting. That creates visibility, but not enough foresight.
Lagging indicators tell you what already happened:
Revenue
EBITDA
Net profit
Actual cash flow
Leading indicators help predict what may happen next:
Forecast accuracy trend
Overdue receivables growth
Burn rate acceleration
Budget run-rate deviation
Exception volumes or anomaly indicators
The best accounting dashboard for financial reporting combines both. CFOs need proof of performance and an early warning system.
Rule 4: Keep definitions consistent across teams
One of the fastest ways to destroy confidence in executive reporting is to let departments define metrics differently. If finance, operations, and leadership use different logic for revenue recognition, margin calculations, or reporting periods, dashboard adoption drops immediately.
This is not just a reporting preference. It is a governance requirement for enterprise finance.
Rule 5: Highlight material variance, not noise
Executives should not have to hunt for what matters. The dashboard should surface exceptions, threshold breaches, and trend shifts that deserve attention now.
This rule is especially important in volatile markets. When every small fluctuation is treated equally, true risk gets buried.
Rule 6: Design for hierarchy and drill-down
C-suite reporting must start with summary KPIs. But summary alone is not enough. Leaders need the ability to move from a high-level number into the operational or structural drivers behind it.
A strong dashboard should allow drill-down by:
Legal entity
Region
Department
Product line
Time period
Cost center
Business unit
This is what turns a dashboard from a passive display into a diagnostic tool.
Rule 7: Refresh data at the right cadence
More frequent updates are not always better. The correct refresh cadence depends on the decision cycle.
For example:
Daily or intraday: cash balance, collections, high-risk receivables
Weekly: budget pacing, burn rate, working capital trends
Monthly: margins, close metrics, forecast review, departmental performance
Quarterly: board-level trend validation, covenant review, strategic planning support
Executives need timely information, but they also need signal stability. If the dashboard refreshes too often without decision context, it can encourage short-term reactions to normal fluctuation.
Which KPIs belong on an executive financial reporting dashboard
The exact KPI mix depends on your industry, structure, and reporting maturity. Still, most executive finance dashboards should include a focused set of metrics across profitability, liquidity, efficiency, and control.
Profitability and margin KPIs
These KPIs help leadership assess earnings quality, margin pressure, and business performance over time.
Revenue growth: Measures top-line expansion against prior periods or target.
Gross margin: Shows how efficiently revenue converts after direct costs.
Operating margin: Reflects operating performance after core overhead.
EBITDA: Provides a widely used view of operating earnings before non-cash and financing effects.
Net profit trend: Indicates bottom-line performance over time.
These metrics are essential when evaluating pricing discipline, cost inflation, mix shifts, and business unit contribution.
Liquidity and cash flow KPIs
Cash visibility is a top priority for CFOs, especially in uncertain environments. These metrics support treasury management and near-term decision making.
Cash balance: Current cash position available for operations and obligations.
Operating cash flow: Cash generated from core business activity.
Free cash flow: Cash remaining after capital expenditures.
Burn rate: Speed at which available cash is being consumed.
For executive visibility, these KPIs should be paired with trend lines, thresholds, and scenario comparisons.
Working capital and efficiency KPIs
These measures show how effectively finance and operations convert resources into performance.
Accounts receivable days: Average collection speed from customers.
Accounts payable days: Timing of supplier payments and working capital usage.
Inventory days: How long inventory is held before sale or use.
Close cycle time: Number of days required to complete the financial close.
Expense ratios: Cost categories measured against revenue or budget.
These KPIs are especially valuable for identifying trapped cash, process inefficiency, and control weakness.
Forecast, risk, and control KPIs
Executive dashboards should also include forward-looking control measures that improve resilience and planning quality.
Budget versus actuals: Compares planned performance to actual results.
Forecast accuracy: Measures how closely prior forecasts matched actual outcomes.
Covenant headroom: Indicates distance from debt covenant breach thresholds.
Overdue receivables: Shows collection risk and potential cash disruption.
Anomaly indicators: Flags unusual transactions, outliers, or control exceptions.
This category often separates mature reporting environments from basic financial dashboards. It gives leadership not only visibility into performance, but visibility into confidence.
How to structure the dashboard for executive visibility
Good KPI selection matters, but layout determines whether executives can actually use the dashboard in a live decision-making setting.
Start with a one-screen summary
The first screen should answer the most important executive questions within minutes. That means placing top KPIs, trend lines, and major variances above the fold in a clear hierarchy.
A practical one-screen summary usually includes:
Revenue, EBITDA, cash, and working capital headline KPIs
Budget vs actual and prior-period comparisons
Trend indicators for the last 6 to 12 periods
Top material variances
Alerts or exceptions needing immediate review
Think of this as the management cockpit. If leaders cannot interpret the state of the business quickly, the dashboard is too complex.
Use comparisons that create context
A number alone is rarely useful. Executives need context to judge whether a result is strong, weak, improving, or deteriorating.
The most effective comparison views include:
Month over month
Quarter over quarter
Year over year
Budget versus actual
Forecast versus actual
Scenario comparisons
These views make performance interpretable and reduce the need for manual explanation during leadership meetings.
Make exceptions impossible to miss
Dashboards should guide attention. Material issues must stand out through visual hierarchy, threshold alerts, and concise commentary.
Best practices include:
Use color sparingly and only for meaning
Highlight breaches of threshold or target
Add short variance explanations for high-impact changes
Elevate trend reversals visually
Group related alerts so executives can assess scale quickly
The goal is not decoration. It is faster prioritization.
Support trust with transparent metric definitions
Trust is built when leaders know exactly what they are seeing. Even a well-designed dashboard will be challenged if users cannot trace the metric logic.
Include:
Clear KPI labels
Definition tooltips or hover explanations
Calculation rules
Source system references
Last updated timestamps
Reporting period indicators
This reduces friction in reviews and limits time wasted on metric disputes.
Common mistakes that weaken financial dashboard reporting
Many finance teams already have dashboards, but not all of them support executive decisions effectively. The most common weaknesses are structural, not technical.
Tracking too many metrics without a decision owner: If no one acts on the KPI, it does not belong on the executive dashboard.
Mixing executive KPIs with departmental detail on the same view: This creates clutter and weakens signal clarity.
Presenting numbers without benchmarks, targets, or prior-period context: Raw values alone do not support judgment.
Allowing inconsistent definitions across finance, operations, and leadership teams: This undermines trust immediately.
Overdesigning visuals at the expense of readability and speed: Financial dashboards should be easy to scan, not visually impressive at the cost of function.
A useful test is simple: if a CFO must ask where to look first, the dashboard is not doing its job.
A practical framework to review and improve your dashboard
If your organization wants to build or refine the best accounting dashboard for financial reporting, start with a focused review framework. This is where experienced finance consultants create the biggest gains: not by adding more widgets, but by sharpening decision support.
Step 1: Audit current KPIs against leadership decisions and reporting objectives
List every KPI currently shown in executive reporting and map it to a real management decision. If a metric does not support a financial action, challenge its inclusion.
Ask:
Which decision does this KPI inform?
Who owns the action if it moves?
Does it align with profitability, liquidity, efficiency, or risk?
This audit quickly exposes low-value reporting clutter.
Step 2: Remove low-value metrics that do not trigger action or discussion
Many dashboards accumulate metrics over time because no one removes them. Prune aggressively. Executive reporting improves when weak signals are eliminated.
Keep the main dashboard focused on material indicators and move supporting detail into drill-down views.
Step 3: Rebuild the layout around executive questions, not data availability
Do not design the dashboard based on what is easiest to pull from systems. Design it around the questions executives ask repeatedly:
Are we on plan?
Where are margins under pressure?
What is happening to cash?
Which unit is driving the variance?
How reliable is the forecast?
This approach creates a dashboard that reflects decision flow rather than database structure.
Step 4: Test the dashboard with CFO, CEO, and functional leaders
A dashboard is only successful if its users can interpret and trust it. Run review sessions with senior stakeholders and observe how they use it.
Look for:
Confusing labels
Missing comparisons
Unclear variances
Inconsistent definitions
Required drill-down paths
Feedback at this stage prevents low adoption after launch.
Step 5: Establish a governance process for ownership, cadence, and refinement
Dashboards are not one-time projects. They require governance to stay accurate and relevant.
Define:
KPI owners
Source system owners
Refresh cadence by metric
Threshold review process
Change approval process
Periodic relevance reviews
This is what keeps executive reporting disciplined as the business evolves.
Build the methodology, then automate it with FineReport
The framework above is what finance leaders need. But building it manually is complex. Maintaining KPI definitions across systems, refreshing data on the right cadence, enabling drill-down, and standardizing executive layouts can quickly become resource-intensive.
This is where the right platform matters.
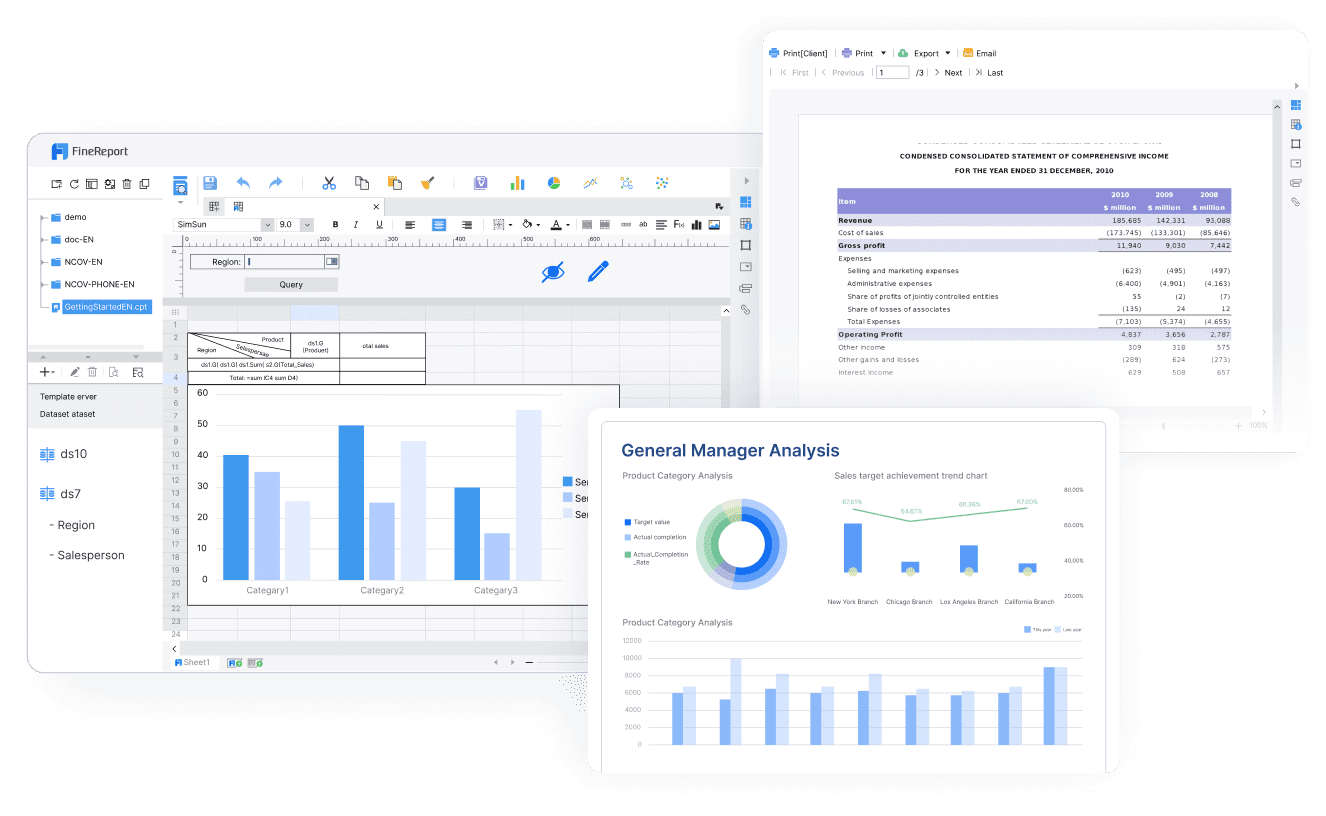
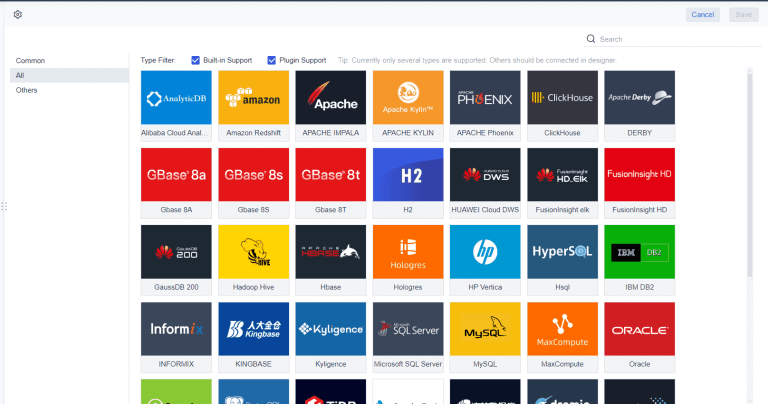
Building this manually is complex; use FineReport to utilize ready-made templates and automate this entire workflow.FineReport helps organizations create the best accounting dashboard for financial reporting by combining governed data integration, interactive dashboard design, drill-down analysis, and executive-friendly visualization in one environment.
Use ready-made dashboard templates for executive financial reporting
Standardize KPI definitions across departments and entities
Automate data refresh and scheduled reporting workflows
Build one-screen summaries with layered drill-down paths
Add alerts, commentary, and variance analysis for faster action
Reduce spreadsheet dependency and manual reporting effort
For CFOs and finance transformation leaders, that means less time assembling reports and more time driving decisions. The real advantage is not just prettier reporting. It is a more reliable, scalable, and action-oriented financial visibility system.
If your goal is executive clarity, faster leadership alignment, and stronger trust in reporting, the path is clear: define the right KPI rules, structure the dashboard around decisions, and use FineReport to operationalize the process at scale.
FAQs
It should include a focused set of executive KPIs tied to profitability, liquidity, efficiency, and risk, along with budget, forecast, and prior-period comparisons. The dashboard should also make variances easy to spot and support drill-down into root causes.
A financial reporting dashboard is built for executive decisions about margins, cash, budget performance, and overall business health. An operational dashboard is more focused on day-to-day activity such as output, service, or campaign execution.
CFOs value metrics that directly support action, not a large volume of charts. A smaller set of decision-driving KPIs helps leadership identify issues faster and spend less time debating what matters.
The most useful KPIs are usually those connected to cash flow, EBITDA, margin trends, budget variance, forecast accuracy, and working capital efficiency. The right mix depends on whether leadership is prioritizing growth, cost control, liquidity, or risk reduction.
The refresh cadence should match the speed of the decision being made. For fast-moving cash or variance monitoring, more frequent updates are useful, while some board-level or period-end metrics can be refreshed less often.
Product Trial
FineReport
Pixel-perfect reports · Interactive dashboards · Easy data entry · Digital twins