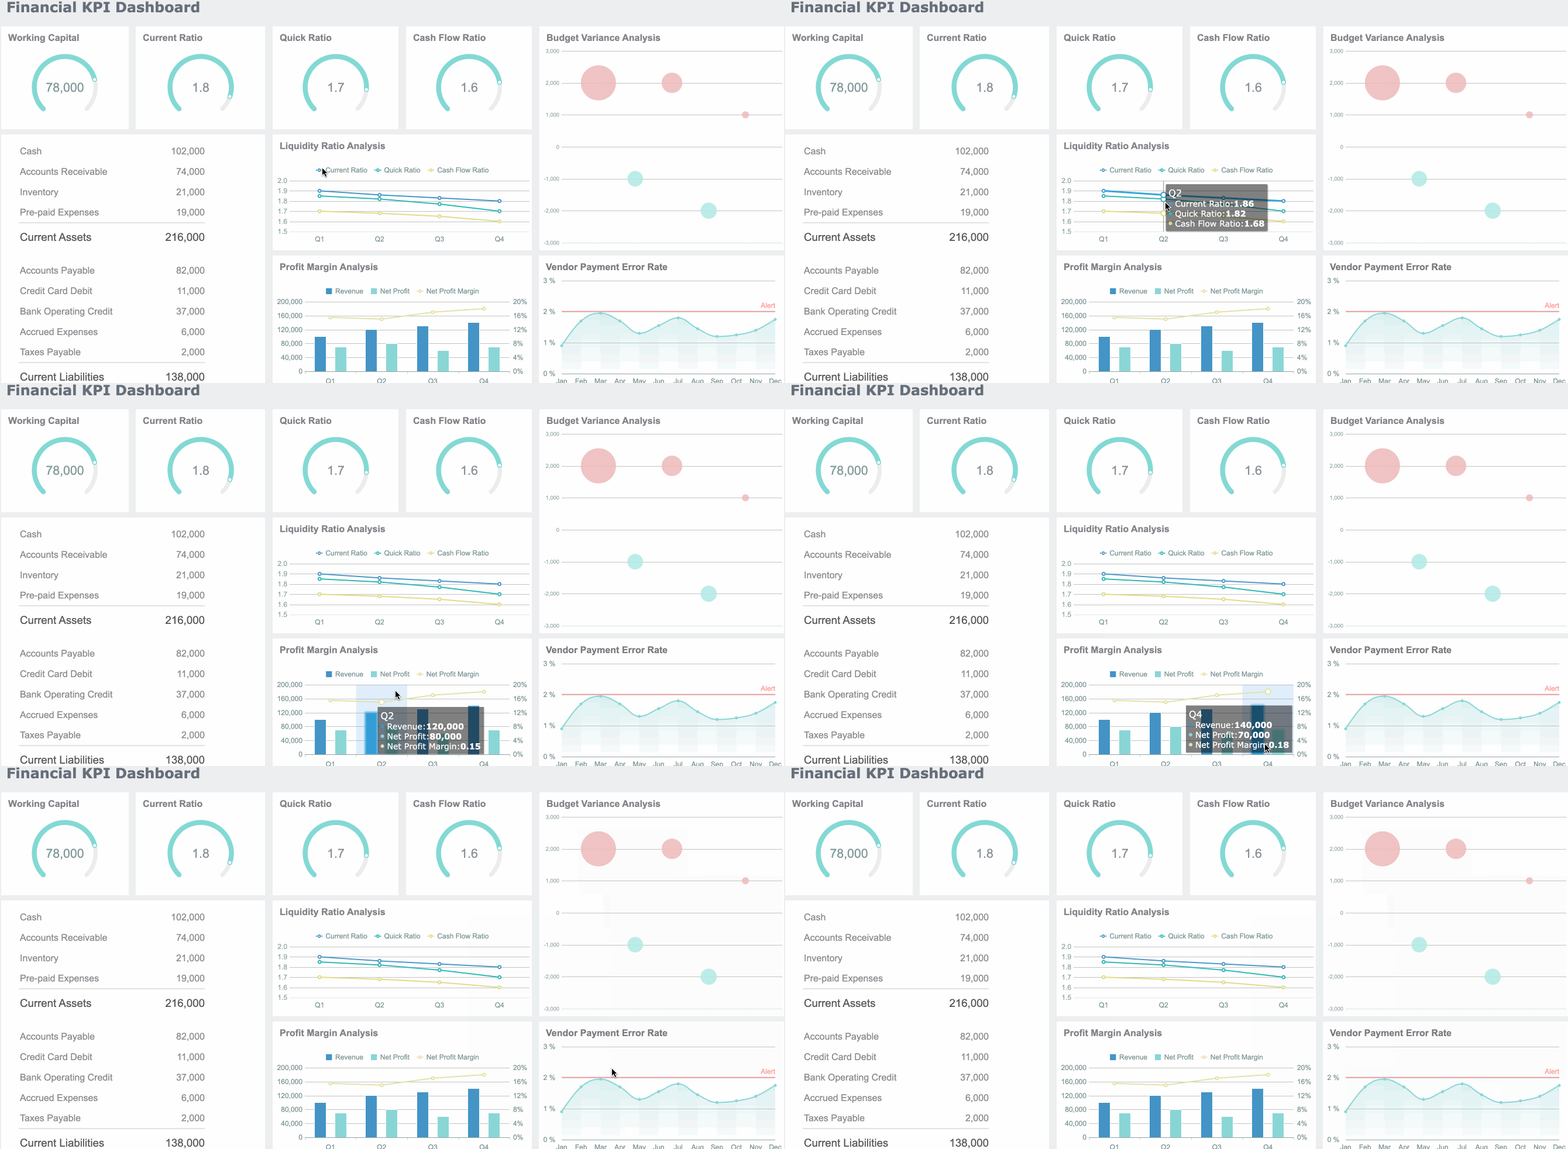
Financial report analysis is the discipline executives use to turn raw financial statements into fast, defensible business decisions. For CFOs, CEOs, finance directors, and business unit leaders, the value is simple: spot profit erosion early, understand whether cash can support growth, identify balance sheet risk before it limits options, and allocate capital where it creates the highest return. The challenge is not access to data. It is knowing which signals matter, which changes are temporary, and which require action now.
Click To Try The Dashboard
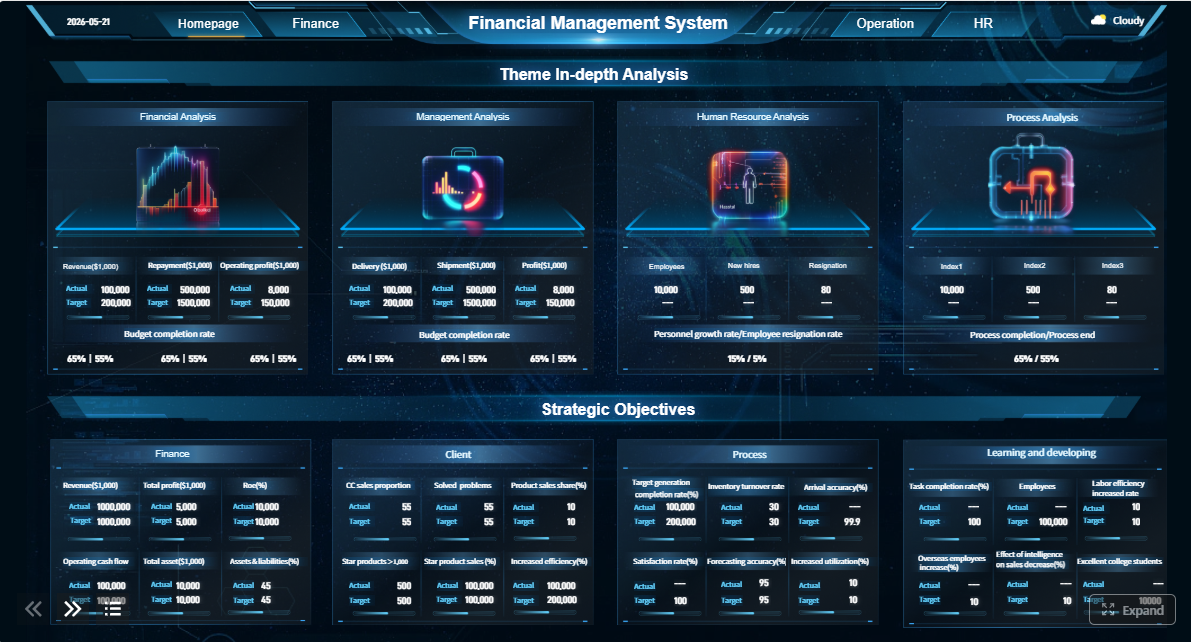
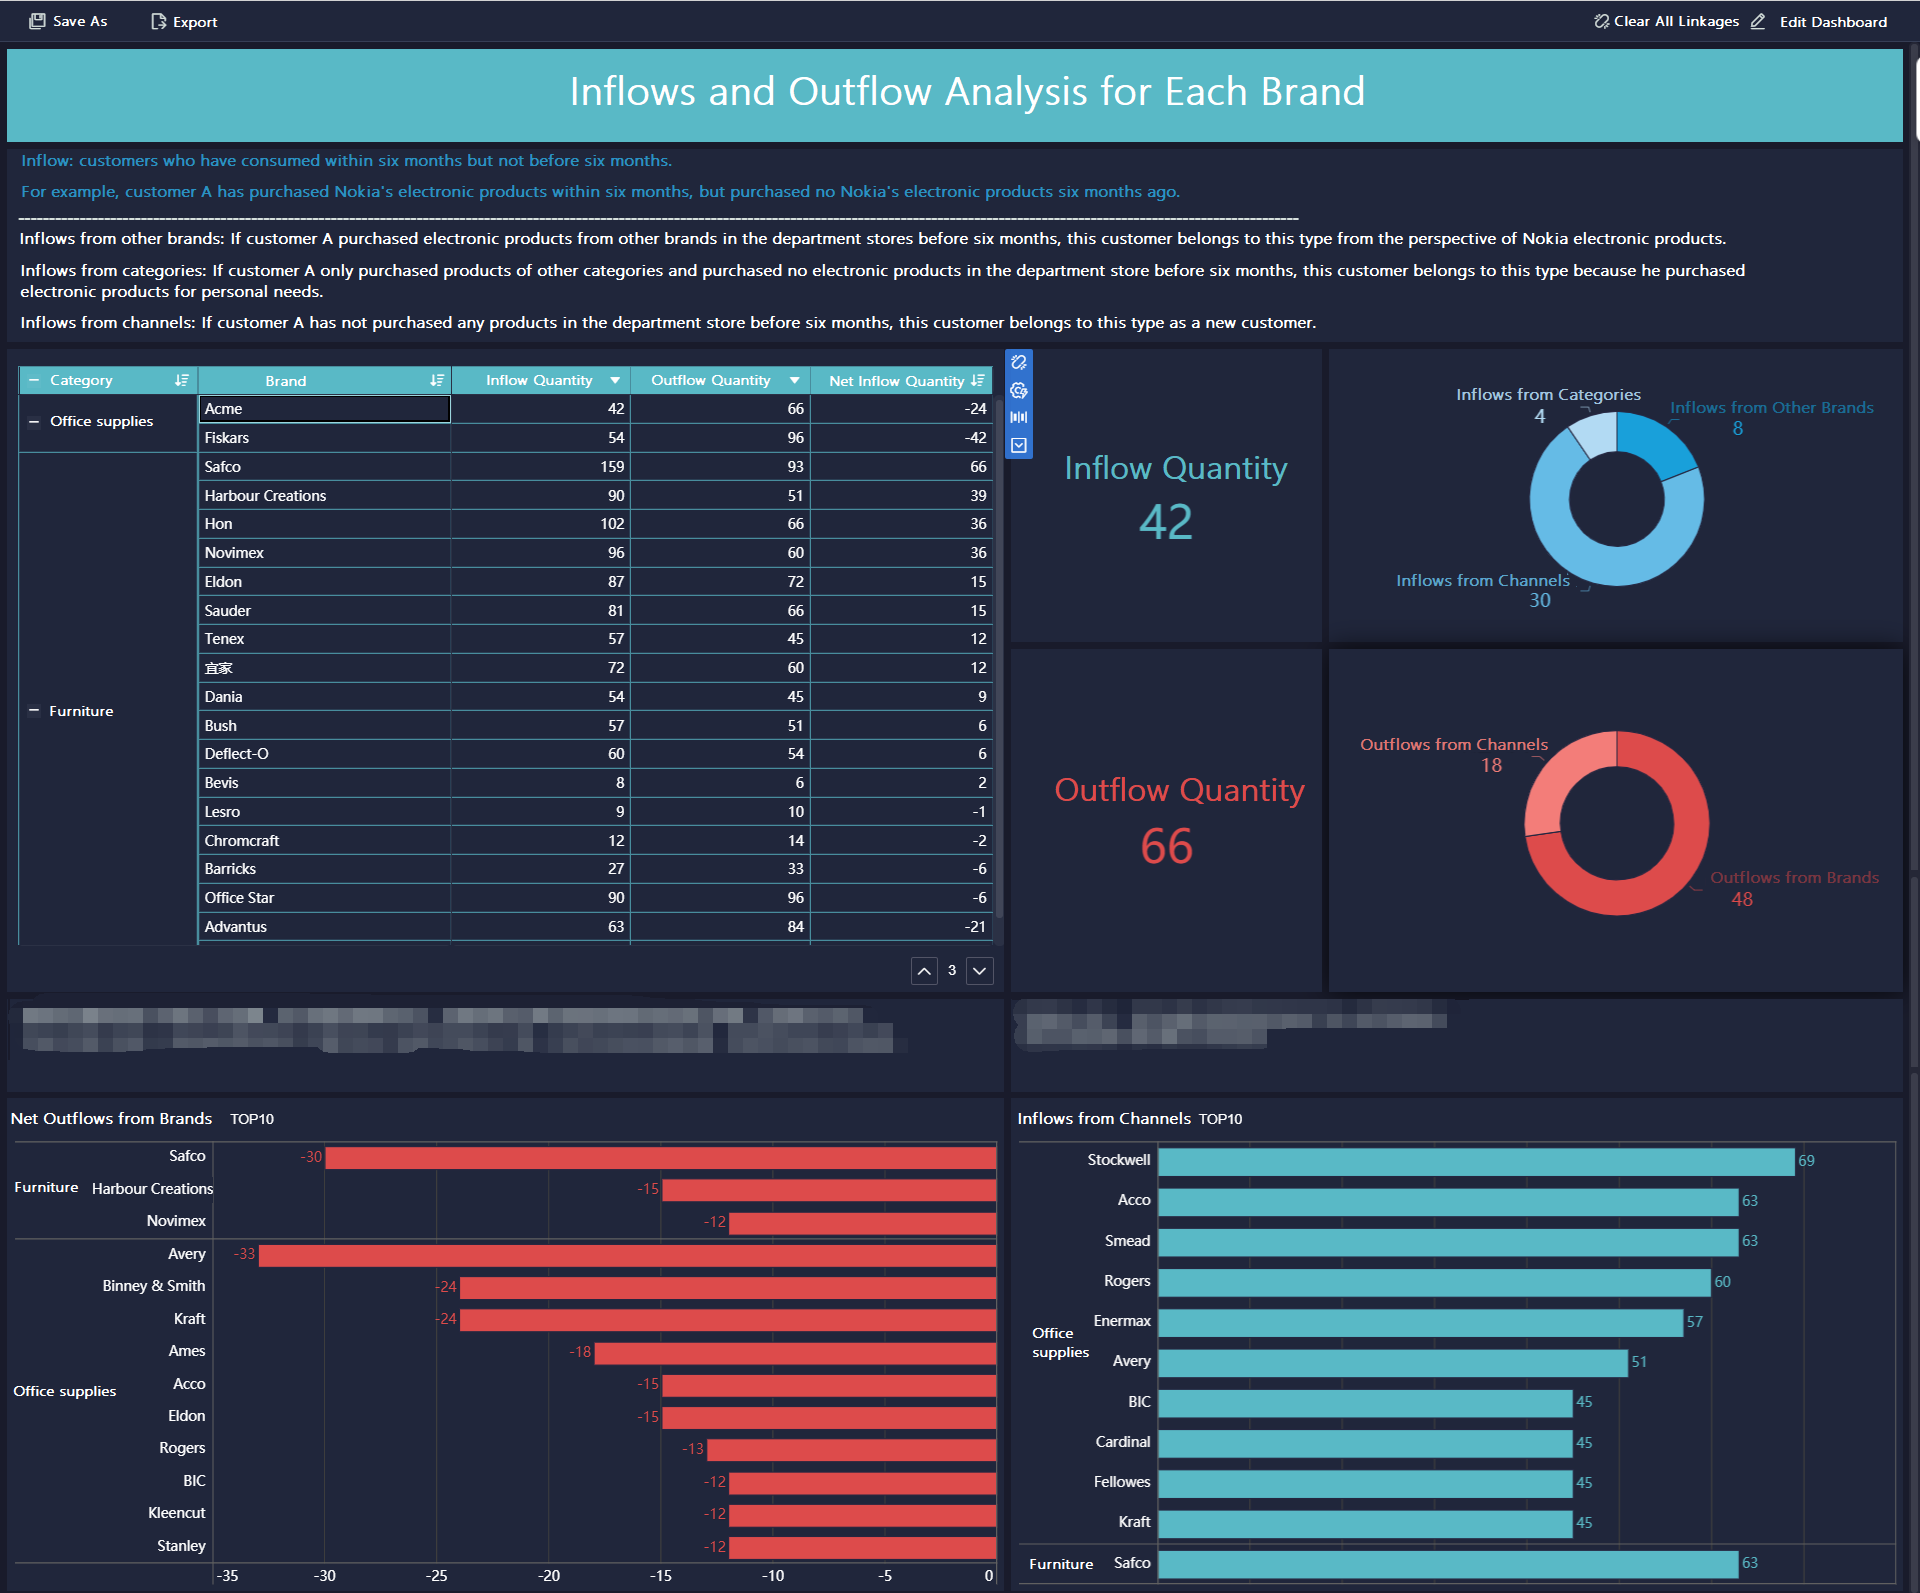
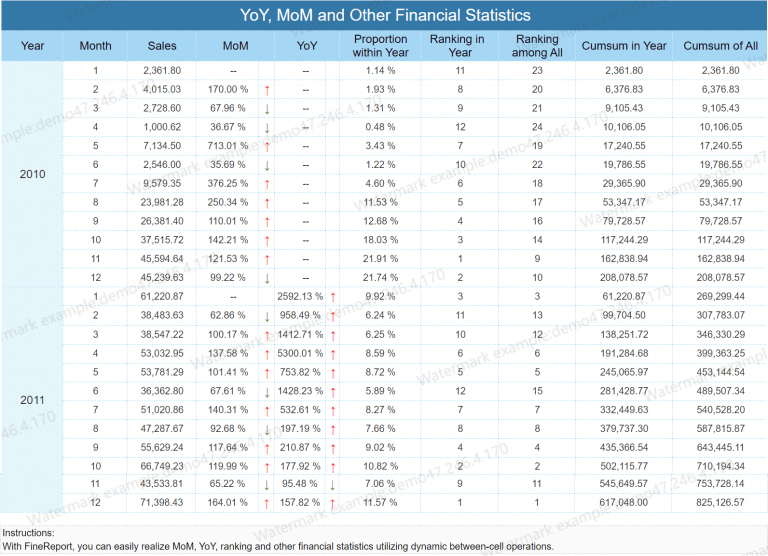
All reports in this article are built with FineReport
What financial report analysis means for executive decision-making
Financial report analysis helps leadership evaluate whether the business is performing as planned, whether risks are increasing, and whether resources should be reallocated. In practice, executives do not review financial statements just to confirm results. They use them to decide where to cut, where to invest, whether to hire, whether to pause expansion, and how aggressively to manage liquidity.
At a strategic level, financial report analysis supports portfolio decisions, market expansion, M&A readiness, and long-range capital planning. At the operational level, it reveals whether margins are being squeezed by pricing, labor, procurement, or overhead. At the capital allocation level, it helps leadership compare uses of cash across debt reduction, inventory investment, technology upgrades, and growth initiatives.
Executives rely on reports to identify three things quickly:
Performance trends: Are revenue, margin, and cash generation improving or weakening?
Risks: Is leverage rising, liquidity tightening, or working capital becoming inefficient?
Opportunities: Are specific products, regions, or channels outperforming enough to justify further investment?
Not every executive question needs the same level of analysis. Some decisions require a fast directional read, such as whether this quarter is tracking above or below plan. Others need deeper diagnostic review, such as why profitability rose while cash flow weakened or why growth is not translating into returns. Strong financial reporting separates these use cases clearly so leaders can move fast without oversimplifying.
Build a basic understanding of a company's financial statements
Before any KPI framework works, executives need a working view of the three core statements. The goal is not technical accounting mastery. The goal is understanding how income, financial position, and cash movement connect.
Income statement essentials
The income statement shows how the company performed over a period. It captures revenue, expenses, margins, and net income. For executives, it is the fastest view of whether the business model is producing acceptable returns.
Key items to focus on include:
Revenue: The scale of sales activity and top-line growth direction
Cost of goods sold or direct costs: The cost tied directly to delivering products or services
Gross profit and gross margin: How much value remains after direct costs
Operating expenses: Spending on sales, administration, R&D, and support functions
Operating income: Earnings generated by core operations before financing and taxes
Net income: Final profitability after all expenses
Changes in profitability often signal operational realities long before they become obvious elsewhere. A declining gross margin may indicate discounting pressure, input cost inflation, poor product mix, or weak procurement performance. A stable gross margin with falling operating margin may point to overhead creep or inefficient scaling.
The balance sheet shows what the company owns, what it owes, and what remains for shareholders at a point in time. It is the core statement for understanding assets, liabilities, and equity.
Executives should pay close attention to:
Current assets: Cash, receivables, inventory, and short-term assets
Non-current assets: Property, equipment, long-term investments, and intangibles
Current liabilities: Payables, accrued expenses, short-term debt
Long-term liabilities: Loans, leases, bonds, and other long-duration obligations
Equity: Retained earnings and shareholder capital
This statement directly informs leadership on liquidity, leverage, and working capital. If receivables are growing faster than revenue, collections may be weakening. If inventory builds while sales slow, capital may be trapped. If debt rises while returns remain flat, the company may be taking on financial risk without improving performance.
Cash flow statement essentials
The cash flow statement explains how cash moved through the business during the period. It is often the most important statement in executive reviews because strong accounting profit does not guarantee strong cash generation.
It is divided into three sections:
Operating cash flow: Cash generated by normal business activity
Investing cash flow: Cash used for assets, acquisitions, or investments
Financing cash flow: Cash from debt, equity, repayments, or dividends
Why does this matter so much to leadership? Because cash determines resilience. A business can report profit and still face pressure if customers are paying slowly, inventory is rising, or debt service is increasing. In executive decision-making, the ability to fund operations and strategic moves usually matters more than accounting earnings alone.
A practical financial report analysis process should be structured, repeatable, and fast enough for leadership cycles. The following approach works well for monthly, quarterly, and board-level reviews.
Start with context and reporting quality
Before interpreting results, validate the context. This prevents executives from reacting to noise instead of substance.
Review these factors first:
Period comparisons: Month over month, quarter over quarter, year over year
The objective is to separate recurring operating performance from unusual events. If net income fell due to a nonrecurring charge, the message to leadership is different than if margins deteriorated across core operations. If revenue surged due to one large contract pull-forward, forecast confidence may actually be lower, not higher.
Analyze the core relationships across statements
Strong financial report analysis does not treat each statement in isolation. The real story emerges when profit, cash flow, and balance sheet movements are connected.
Ask questions like:
Did revenue growth produce proportional cash flow growth?
Did higher profit coincide with expanding receivables or inventory?
Is leverage increasing because of strategic investment or because operations are underfunded?
Are earnings backed by operating cash flow?
One of the most important tests is earnings quality. If reported earnings rise while operating cash flow weakens, leadership should investigate whether the gains are sustainable. This may indicate aggressive revenue timing, slower collections, inventory buildup, or changes in working capital that mask operational stress.
Financial results only become meaningful when compared against a target or reference point. Benchmarks show whether performance is truly strong, weak, or merely normal for the environment.
Use four benchmark layers:
Budget: Did results meet internal plan?
Prior periods: Is the trend improving or deteriorating?
Peer companies: Are margins and returns competitive?
Industry norms: Are movements driven by market conditions or company-specific issues?
This step prevents overreaction. If margins are down but the entire sector is facing raw material inflation, the issue may be market-wide. If peers maintained margin while your business declined, the problem is likely internal execution.
Use a KPI framework for financial statement analysis
A good KPI framework translates financial statements into executive language. Instead of overwhelming leadership with dozens of figures, it prioritizes metrics tied directly to profitability, risk, liquidity, efficiency, and growth.
Profitability and efficiency KPIs
These KPIs show whether the company is converting revenue and assets into returns.
Key Metrics (KPIs):
Gross Margin: Percentage of revenue left after direct costs. Indicates pricing strength, mix quality, and cost discipline.
Operating Margin: Percentage of revenue remaining after operating expenses. Shows core operating efficiency.
Return on Assets (ROA): Net income relative to total assets. Measures how effectively the company uses its asset base.
Return on Equity (ROE): Net income relative to shareholder equity. Indicates how efficiently equity capital generates profit.
Executives use these metrics to decide whether pricing needs adjustment, whether cost reduction is required, and whether assets are being used productively. For example, rising revenue with falling ROA may mean the business is scaling inefficiently.
These metrics help leadership understand short-term resilience and long-term financial risk.
Key Metrics (KPIs):
Current Ratio: Current assets divided by current liabilities. Measures near-term ability to meet obligations.
Quick Ratio: Liquid assets divided by current liabilities. A stricter view of short-term liquidity excluding inventory.
Debt-to-Equity Ratio: Total debt relative to equity. Indicates leverage and financing risk.
Interest Coverage Ratio: Operating earnings divided by interest expense. Shows ability to service debt.
These KPIs guide decisions on borrowing capacity, refinancing strategy, covenant management, and risk tolerance. A company may be profitable on paper but still face operating pressure if liquidity is too tight.
Cash flow and growth KPIs
Executives need to know not just whether the business is growing, but whether that growth is fundable and sustainable.
Key Metrics (KPIs):
Free Cash Flow: Operating cash flow minus capital expenditures. Measures cash available after maintaining or expanding the business.
Cash Conversion Cycle: Time required to convert investment in inventory and receivables into cash. Reflects working capital efficiency.
Revenue Growth: Change in top-line sales over time. Signals market demand and commercial momentum.
Earnings Growth: Change in profit over time. Shows whether growth is translating into stronger bottom-line performance.
These indicators support decisions on investment timing, hiring pace, inventory management, and expansion funding.
Turn analysis into executive actions
The right KPI framework is not universal. Metrics should be prioritized by business model, growth stage, and leadership agenda.
For example:
A high-growth SaaS company may prioritize revenue growth, gross margin, and cash burn control.
A manufacturer may focus more heavily on inventory turnover, gross margin, and free cash flow.
A mature enterprise with debt obligations may elevate interest coverage, debt-to-equity, and operating cash flow.
The final step is converting findings into action. KPI movement should lead to explicit choices, such as:
Reduce discretionary costs
Delay nonessential hiring
Increase prices in low-elasticity segments
Tighten collections and inventory controls
Reprioritize capex
Restructure underperforming business units
Apply practical techniques to improve analysis quality in 2026
In 2026, executive teams expect analysis that is faster, more visual, and more forward-looking. That requires going beyond static statement review.
Use trend, ratio, and variance analysis together
Do not rely on a single analysis method. The strongest financial report analysis combines:
Horizontal analysis: Track changes across periods
Vertical analysis: Assess item proportions within a statement
Ratio analysis: Evaluate profitability, liquidity, efficiency, and leverage
Variance analysis: Explain actual versus budget or forecast gaps
This combined approach gives executives both pattern recognition and causal explanation. A margin decline is useful to know. A variance breakdown that isolates pricing, mix, labor, and overhead drivers is what makes action possible.
Focus on scenario testing and forward-looking indicators
Historical reporting alone is not enough for executive decision-making. Leaders need to understand what could happen next under different assumptions.
Use scenario testing around:
Demand decline or upside cases
Margin compression from cost inflation
Interest rate changes and financing costs
Working capital pressure
Capital expenditure timing
Pair historical analysis with leading indicators such as pipeline conversion, backlog quality, churn, order volume, receivable aging, and procurement cost trends. This helps leadership act before reported results fully reflect the problem.
Avoid common interpretation mistakes
Even experienced teams misread financials when under time pressure. Three mistakes show up repeatedly:
Relying on one metric in isolation: Revenue growth without margin and cash context can be misleading.
Ignoring seasonality: Comparing the wrong periods can distort conclusions.
Failing to adjust for accounting changes or nonrecurring items: This creates false trend signals.
A disciplined executive review process always normalizes the data first, then interprets it.
Present conclusions in a format executives can act on
Good analysis fails if the presentation is too dense, too technical, or too slow. Executives need concise conclusions tied to business implications.
Use a reporting format built around three questions:
What changed?
Why did it change?
What decision is required?
Summarize the few metrics that matter most. Do not bury leadership in pages of detail. Highlight the implications clearly. If gross margin fell 180 basis points, explain whether the cause was discounting, unfavorable mix, supplier inflation, or production inefficiency. Then show the trade-offs: absorb the impact, raise prices, renegotiate supply, or cut cost elsewhere.
A simple executive reporting cadence often works best:
Weekly: Flash indicators for revenue, cash, collections, and major variances
Monthly: Full KPI review with functional accountability
Quarterly: Strategic review with scenario updates, capital allocation decisions, and risk reassessment
Best practices for implementing a high-impact financial report analysis workflow
If you want financial report analysis to influence executive decisions consistently, implementation matters as much as methodology. Here are four field-tested best practices.
1. Standardize definitions before building dashboards
Align finance, operations, and business unit leaders on metric definitions first. Gross margin, EBITDA, free cash flow, and working capital can all be calculated differently across teams. Without standardization, every meeting turns into a debate over numbers instead of a discussion about action.
2. Build one executive view and one diagnostic view
Executives need a concise summary dashboard. Finance analysts need drill-down capability. Keep both layers connected. This allows leadership to spot issues in minutes and analysts to validate root causes without rebuilding reports manually.
3. Automate exception alerts around KPI thresholds
Set thresholds for margin drops, cash shortfalls, leverage spikes, or working capital deterioration. Trigger alerts automatically when results move outside acceptable ranges. This shortens the time between issue detection and intervention.
4. Tie every KPI to an owner and decision rule
Each major KPI should have a business owner, a target range, and a response plan. If the cash conversion cycle worsens, who acts first? If operating margin drops below threshold, what levers are reviewed? Accountability turns analysis into execution.
5. Review trends in context, not as isolated snapshots
A weak month may be noise. A three-quarter pattern may indicate a structural issue. Design reports to show trend, benchmark, and variance together so executives can distinguish signal from fluctuation.
Building this manually is complex; use FineReport to utilize ready-made templates and automate this entire workflow. For enterprise teams, the biggest challenge is rarely knowing which KPIs matter. It is consolidating data from ERP, accounting, budgeting, and operational systems into one reliable reporting layer that executives trust.
Connect multiple data sources into one reporting environment
Build executive dashboards for income statement, balance sheet, and cash flow analysis
Create drill-down reports for business units, regions, and product lines
Automate scheduled distribution for monthly and quarterly reviews
Monitor KPI thresholds with real-time visual alerts
Reuse ready-made dashboard templates to shorten deployment time
Get Ready-to-Use Dashboard Templates in Fine Gallery
For organizations that need faster board packs, better monthly performance reviews, and more consistent KPI governance, FineReport turns financial report analysis into a repeatable management system rather than a spreadsheet exercise.
Financial leadership is ultimately about making better decisions with less delay and less ambiguity. When your reporting framework clearly connects profitability, liquidity, cash flow, and growth, executives gain the confidence to act early and allocate resources with precision.
Financial report analysis is the process of using income statements, balance sheets, and cash flow statements to assess performance, risk, and capital priorities. Executives use it to make faster decisions on growth, cost control, liquidity, and investment.
The three core statements are the income statement, balance sheet, and cash flow statement. Together they show profitability, financial position, and how much cash the business is actually generating.
Leaders usually start with revenue growth, gross margin, operating profit, operating cash flow, liquidity ratios, and budget versus actual variance. These KPIs help identify whether the business is improving, under pressure, or drifting off plan.
Profit is based on accounting results, while cash depends on when money is collected and paid. A company can show strong earnings but still struggle if receivables rise, inventory builds, or debt payments increase.
Dashboards make key trends, variances, and risks easier to spot without digging through static reports. Tools like FineReport can help executives monitor KPIs in real time and act faster when conditions change.
Product Trial
FineReport
Pixel-perfect reports · Interactive dashboards · Easy data entry · Digital twins