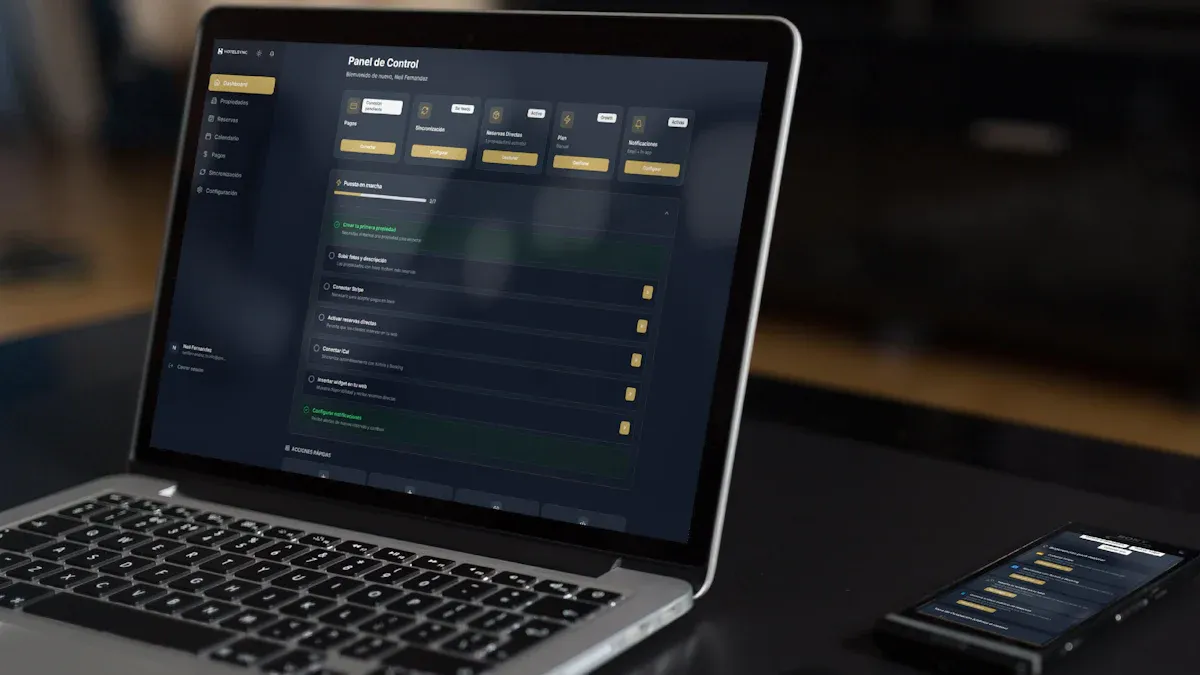
For operations directors, GE digital operations performance management is not just about building another dashboard. It is about creating a reliable operating system for performance: connecting plant data, defining the right KPIs, reviewing results at the right cadence, and turning exceptions into action.
In a plant, site, or multi-site environment, leaders need more than visibility. They need a reporting and operational cockpit foundation that supports daily decisions, weekly reviews, and monthly management reporting. They also need an AI assistant upgrade that makes those reports easier to consume and act on.
With FineReport + Dora, teams can ask for a report summary in chat, generate structured narratives from trusted report assets, receive scheduled briefings, and push exceptions to the right owner. That makes operations performance management more practical for real-world execution, especially when directors are managing multiple lines, departments, or sites.
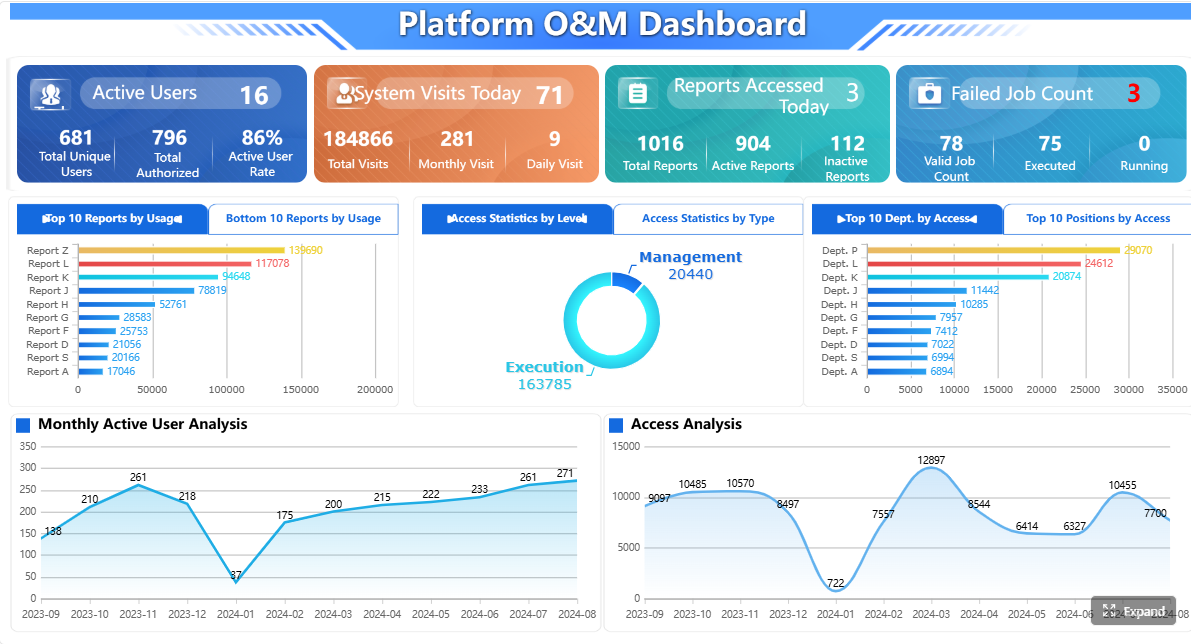 Click To Try The Dashboard
All reports in this article are built with FineReport
What GE Digital Operations Performance Management Means for Operations Directors
GE digital operations performance management refers to the discipline of using connected operational data, standardized KPIs, and structured review processes to improve plant and network performance. For operations directors, the goal is not data collection for its own sake. The goal is to improve throughput, reduce cost, control quality, manage risk, and increase responsiveness.
In a plant or multi-site environment, operations performance management typically brings together data from production systems, machine signals, maintenance records, quality systems, and ERP workflows. The value comes from turning that fragmented information into a clear performance picture that supports decisions.
For example, an operations director may need to answer questions such as:
- Which lines are consistently missing target output?
- Are unplanned downtime losses getting worse this month?
- Which sites have the highest scrap trend?
- Where are labor efficiency issues creating delivery risk?
- Which exceptions require escalation today?
This is why operations directors need a practical framework instead of a long KPI wish list. A hundred metrics do not improve performance if no one knows which ones matter, how they are calculated, or what action should follow when they move in the wrong direction.
A better approach is to build a governed KPI framework, surface it in role-based operational cockpits, and then use an enterprise Data Agent like Dora to make report consumption faster. FineReport provides the trusted reporting foundation. Dora turns that foundation into an AI assistant that can summarize reports, explain changes, push alerts, and support follow-up.
Step 1: Align KPIs With Business Priorities
Start with the decisions leaders need to make
The best KPI frameworks start with decisions, not data. Operations directors should begin by identifying the operational decisions they need to make across five core dimensions:
- Throughput: Are we producing enough to meet demand?
- Cost: Where are conversion costs rising?
- Quality: Which defects or process losses are hurting yield?
- Service: Are production and fulfillment performance supporting customer commitments?
- Risk: Where do downtime, safety, supply, or compliance risks require intervention?
This helps separate strategic metrics from daily management metrics.
- Strategic metrics support monthly or quarterly direction-setting, such as overall equipment effectiveness trend, total conversion cost, on-time delivery, first-pass yield, or energy cost per unit.
- Daily management metrics support immediate control, such as shift output, downtime by cause, scrap by line, schedule adherence, or open maintenance backlog.
When these are mixed together without structure, dashboard reviews become noisy and unfocused. Operations leaders need to know which metrics support long-term optimization and which ones demand same-day action.
Set KPI criteria before selecting measures
Before choosing KPIs, define the criteria every metric must meet. A useful KPI in operations should be:
- Measurable: Based on available and trusted data
- Actionable: Linked to a clear operational response
- Timely: Updated at the cadence required for decisions
- Owned: Assigned to a person, team, or function
This is also the right point to remove vanity metrics. If a measure looks impressive but does not influence behavior or improvement, it should not be a priority KPI.
Here is a practical KPI selection lens:
- Does this metric support a recurring operational decision?
- Can the responsible owner influence the result?
- Is the data credible enough to act on?
- Will this metric trigger a review, escalation, or corrective action?
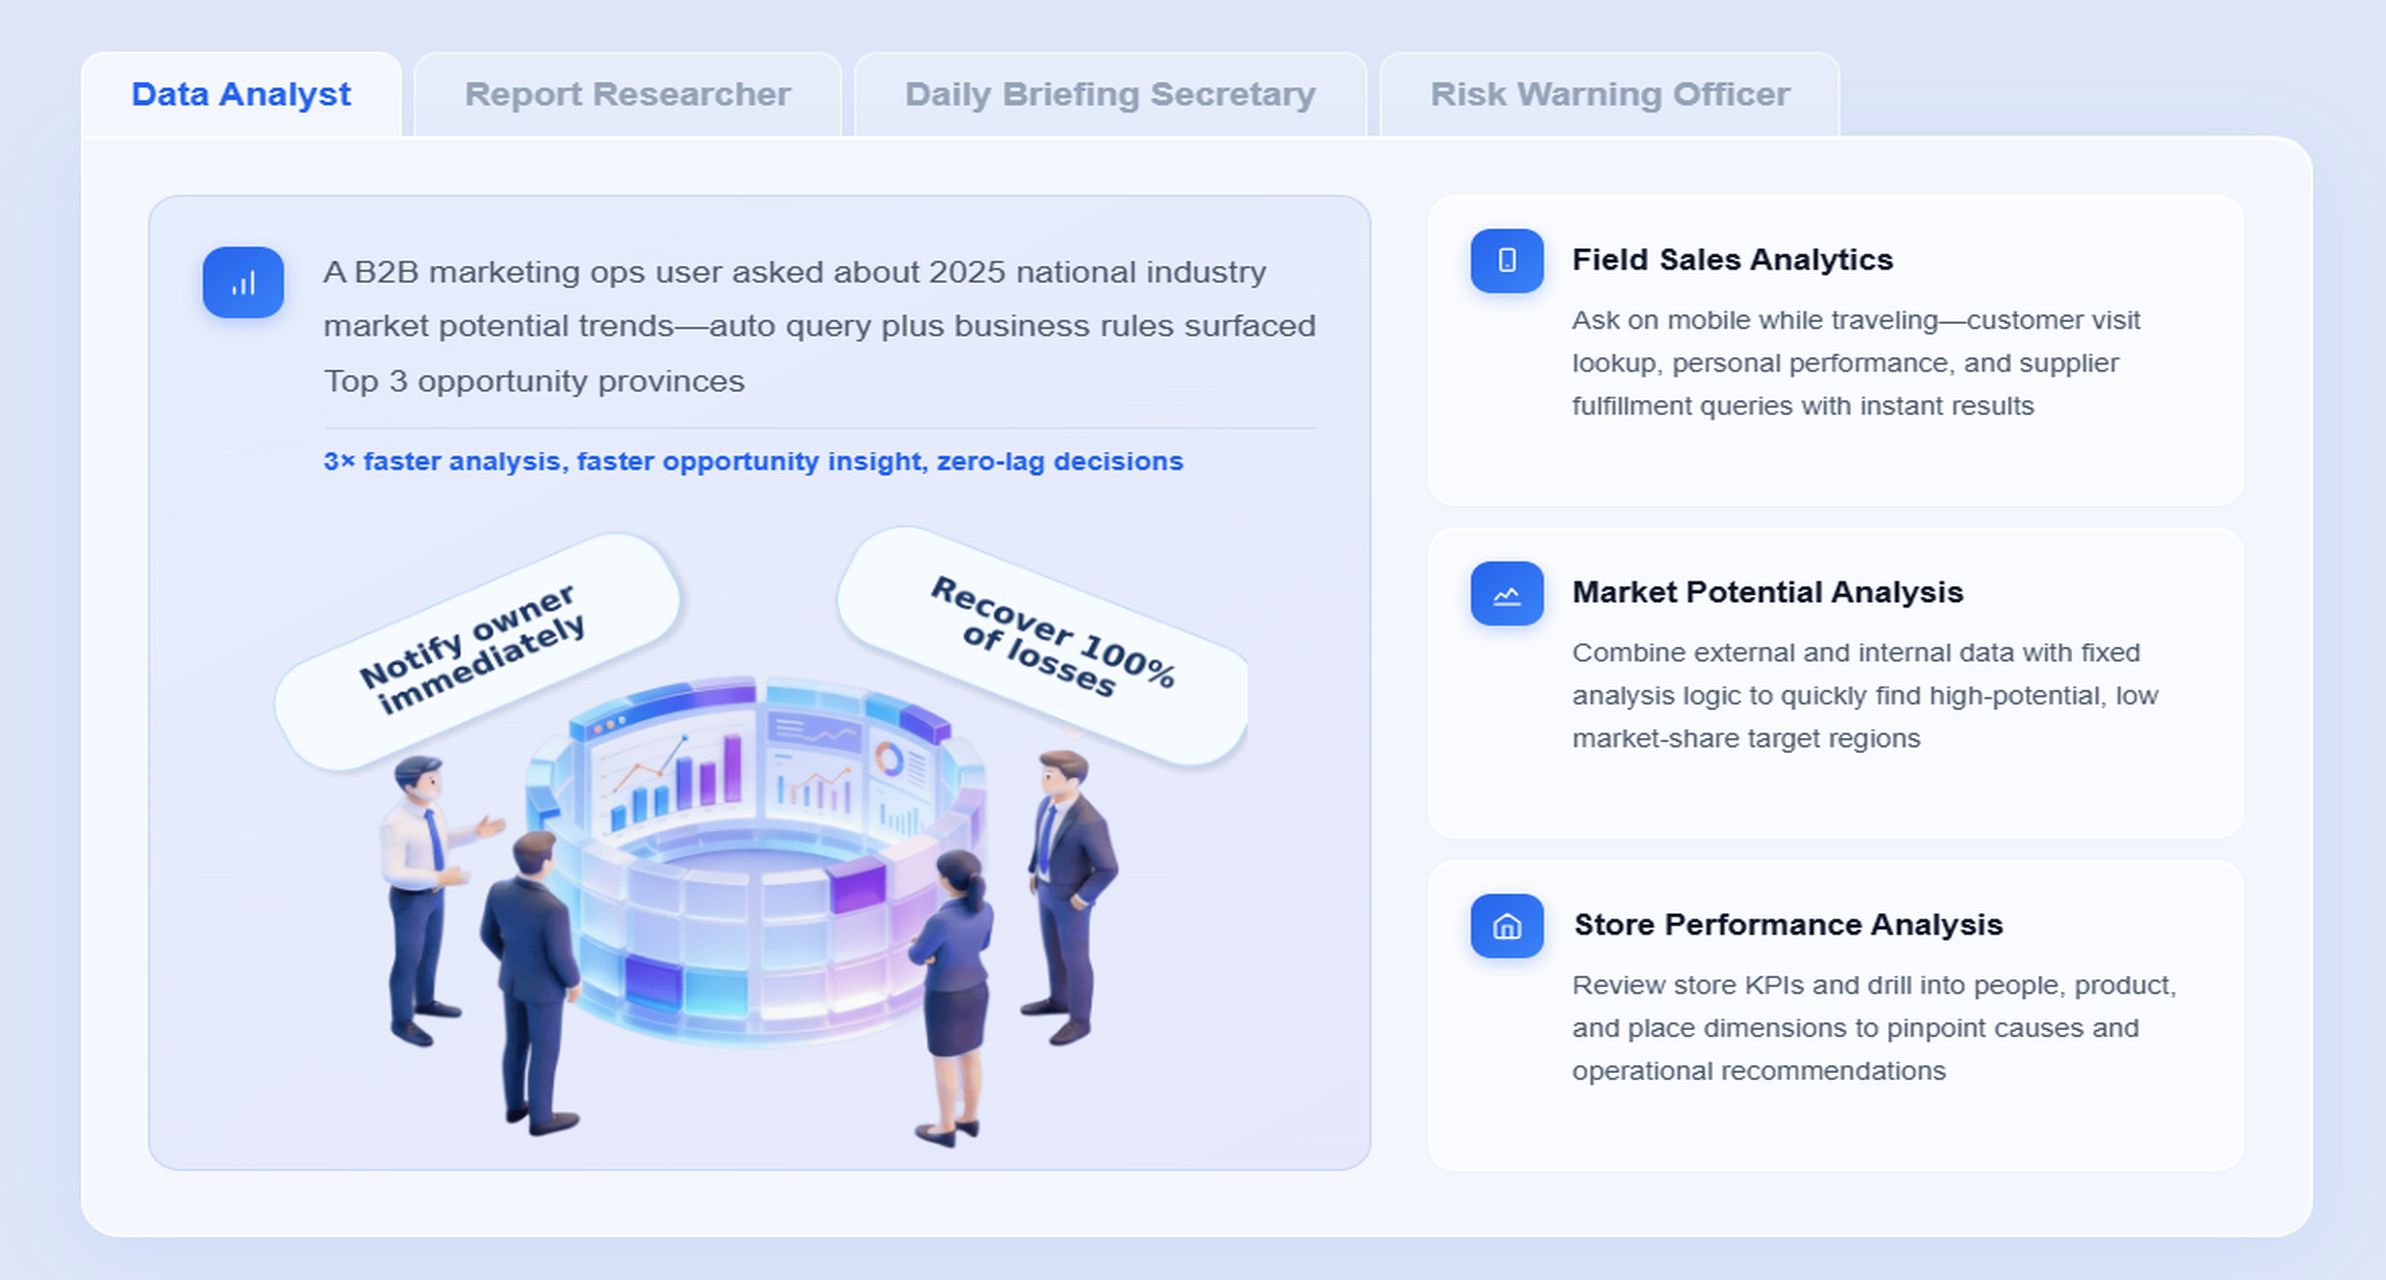
How FineReport + Dora helps: FineReport can standardize KPI views by role and reporting cadence. Dora can then act as a Data Analyst digital employee, allowing directors to ask natural-language questions such as, “Which KPIs missed target this week and which plants need escalation?” That reduces the time spent manually scanning multiple reports.
Step 2: Build a Balanced KPI Structure
Organize metrics across the operation
A strong KPI framework should cover the operation broadly enough to support decision-making, but not so broadly that focus is lost. For most plants and multi-site operations, metrics can be grouped into six areas:
- Production
- Asset reliability
- Quality
- Energy
- Labor
- Customer impact
Just as important, the structure should balance leading indicators and lagging indicators.
- Lagging indicators show outcomes, such as monthly output, scrap rate, maintenance cost, or on-time delivery.
- Leading indicators help control performance earlier, such as minor stoppage frequency, preventive maintenance compliance, first-hour startup loss, operator training completion, or process deviation count.
This balance gives operations directors better control. If leaders only review lagging indicators, they often discover issues after performance has already deteriorated.
Create clear metric definitions
Once KPI groups are selected, each metric needs a clear and governed definition. This should include:
- Formula
- Data source
- Update frequency
- Target
- Thresholds
- Exception rules
- Accountable owner
This step prevents one of the most common reporting failures in operations: different teams using different definitions for the same KPI.
Below is a practical KPI structure with business and AI value.
Production KPIs
-
Throughput Definition: Total units or tons produced in a defined period. Business value: Measures whether operations are meeting demand and capacity expectations. AI use: Dora can summarize throughput trends, explain site-by-site variance, and include missed-target areas in a scheduled management briefing.
-
Schedule adherence Definition: Degree to which actual production follows the planned production schedule. Business value: Indicates how reliably the plant executes planning decisions. AI use: Dora can flag production slippage, identify lines with repeat deviations, and push alerts to owners before review meetings.
-
Overall equipment effectiveness (OEE) Definition: Combined view of availability, performance, and quality. Business value: Helps leaders see where equipment-related losses reduce productive output. AI use: Dora can provide a chart-based answer showing whether OEE loss is driven more by downtime, speed loss, or quality loss.
Asset Reliability KPIs
-
Unplanned downtime Definition: Production time lost due to unexpected equipment failure or interruption. Business value: Directly affects throughput, labor efficiency, and service performance. AI use: Dora can monitor downtime exceptions and act as a Risk Alert Officer, pushing alerts when thresholds are breached.
-
Mean time between failures (MTBF) Definition: Average operating time between equipment failures. Business value: Reflects asset stability and reliability trend. AI use: Dora can summarize deterioration patterns and link affected assets back to the FineReport cockpit.
-
Preventive maintenance compliance Definition: Percentage of planned maintenance tasks completed on time. Business value: Supports reliability and reduces reactive maintenance. AI use: Dora can include overdue PM tasks in weekly operational summaries and route follow-up items to maintenance owners.
Quality KPIs
-
First-pass yield Definition: Percentage of units produced correctly without rework. Business value: Shows process capability and quality efficiency. AI use: Dora can explain when yield drops and correlate the issue with line, shift, or product family in a structured report summary.
-
Scrap rate Definition: Percentage of output lost as waste or unusable material. Business value: Impacts cost, capacity, and margin. AI use: Dora can compare scrap trends across lines and generate a management narrative for quality review meetings.
-
Defect rate Definition: Frequency of defects found in production or inspection. Business value: Helps track product quality risk and customer impact. AI use: Dora can detect abnormal changes and push exception notifications to responsible teams.
Energy KPIs
-
Energy consumption per unit Definition: Total energy used divided by output. Business value: Supports cost control and sustainability goals. AI use: Dora can summarize whether higher usage is linked to lower throughput, asset inefficiency, or operating change.
-
Peak demand events Definition: Periods where energy demand exceeds planned or efficient thresholds. Business value: Affects utility cost and operating efficiency. AI use: Dora can flag peak events and include them in periodic briefings for site leaders.
Labor KPIs
-
Labor productivity Definition: Output produced per labor hour. Business value: Reveals workforce efficiency and process stability. AI use: Dora can explain whether productivity declines align with downtime, absenteeism, changeovers, or demand mix.
-
Overtime ratio Definition: Portion of labor hours worked as overtime. Business value: Signals staffing imbalance, demand spikes, or process instability. AI use: Dora can summarize overtime drivers and include them in a director-level weekly report.
Customer Impact KPIs
-
On-time delivery Definition: Percentage of customer orders delivered on or before promised date. Business value: Connects plant execution to customer satisfaction and revenue protection. AI use: Dora can summarize service risk, identify delayed production contributors, and support escalation.
-
Order fill rate Definition: Percentage of demand fulfilled completely from available production and inventory. Business value: Measures operational responsiveness. AI use: Dora can answer natural-language questions about why fill rate dropped and point users to supporting report sections.
Step 3: Connect Data Sources and Improve Visibility
Bring operational data into one view
A KPI framework only works if the data behind it is connected and trustworthy. Operations directors typically need visibility across several systems:
- Machine or sensor data
- SCADA or MES process data
- Maintenance systems
- Quality systems
- ERP production and order data
- Energy and utility records
- Manual reporting inputs where needed
The objective is not to centralize everything at once. It is to connect the data required for the decisions the KPI framework supports.
This is where many programs slow down. Dashboards may look complete, but if data quality, timing, or consistency are weak, trust in the reporting declines quickly. Before scaling dashboards across lines or sites, teams should identify:
- Missing data points
- Delayed source updates
- Inconsistent coding or naming
- Duplicate metric logic
- Manual workarounds that introduce errors
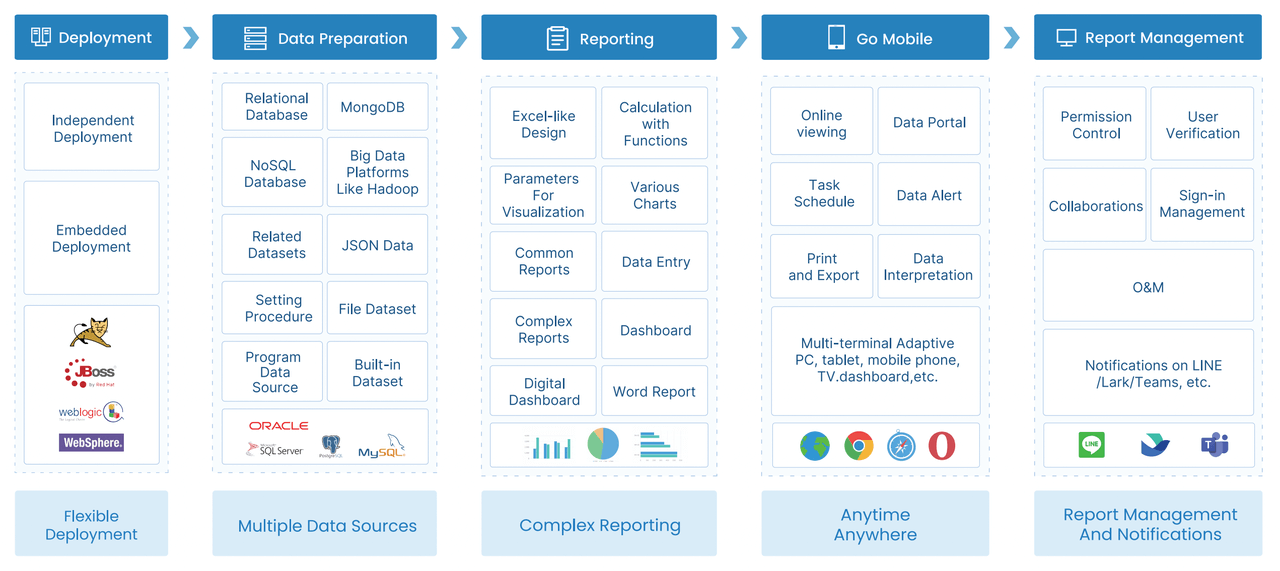
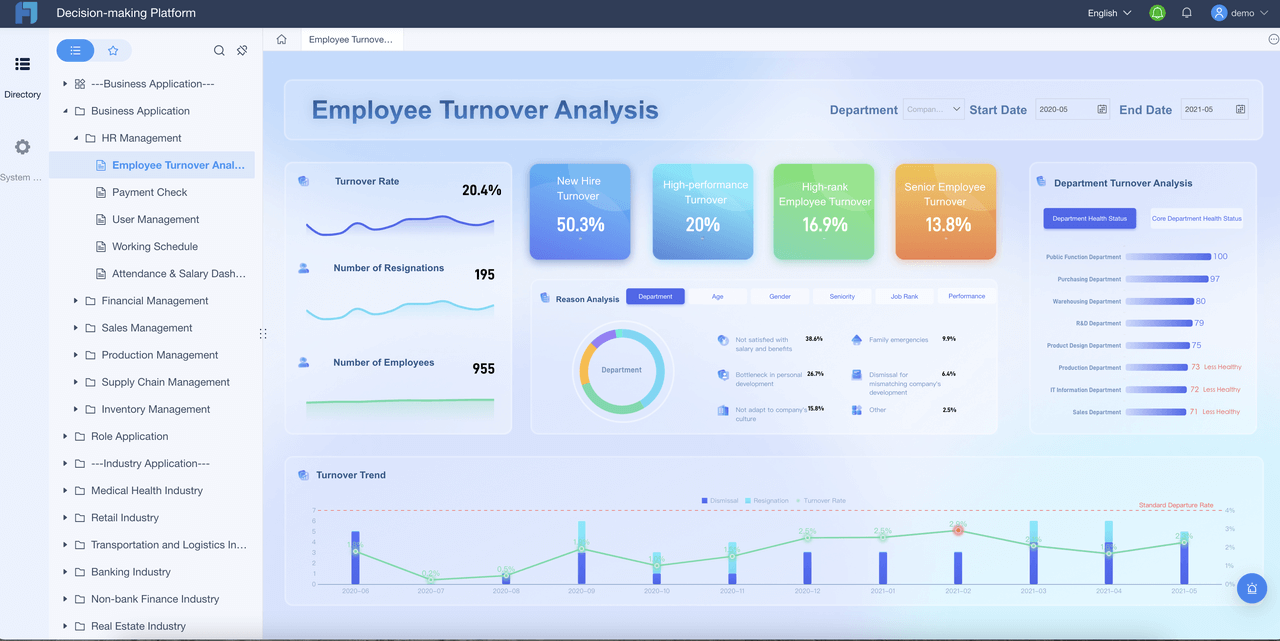
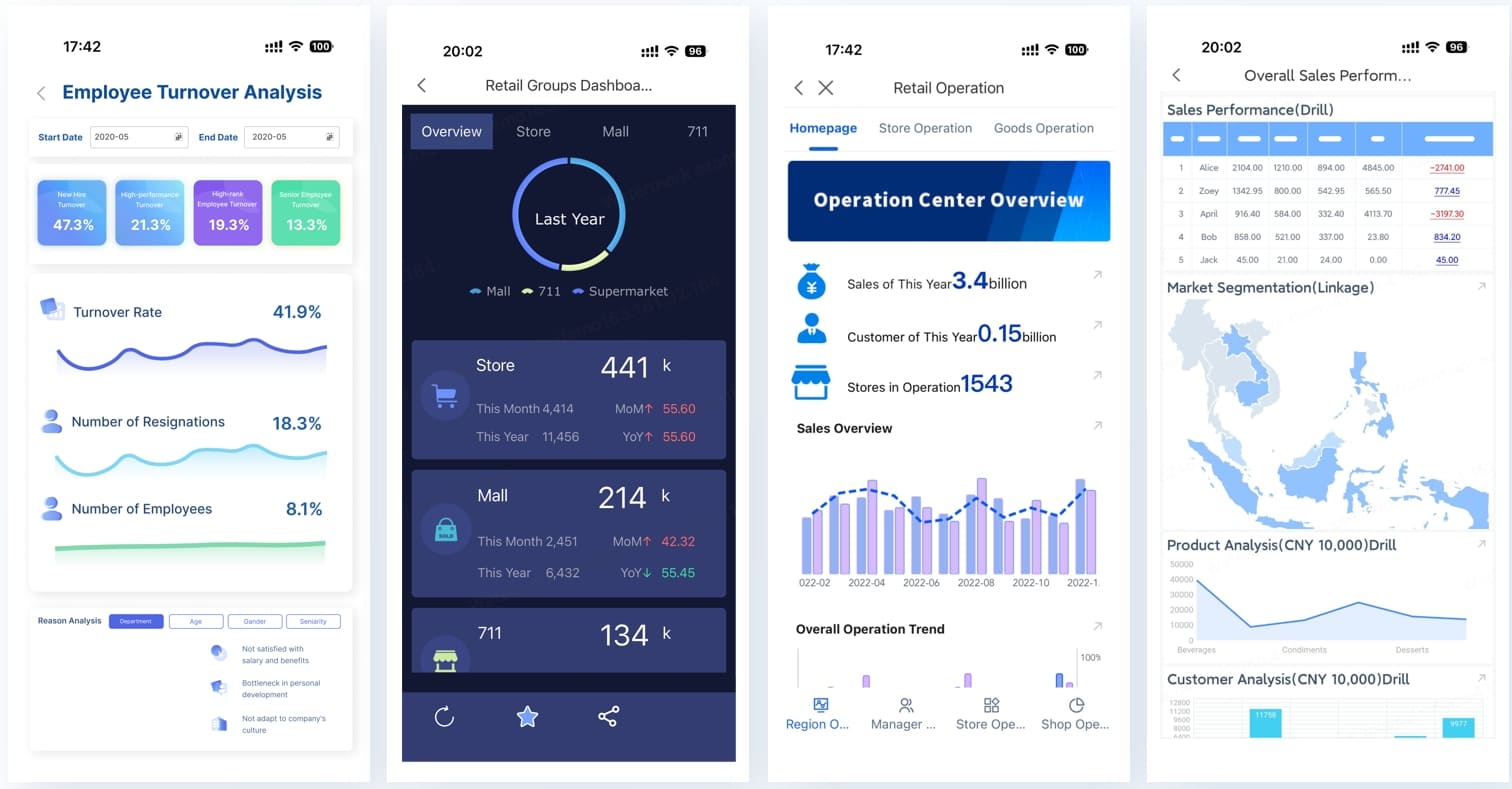
FineReport is well suited here because it can serve as the reporting and operational cockpit layer across diverse enterprise data sources. It supports formatted reports, complex reports, management reports, and operational dashboards that operations directors can actually use in reviews.
Design dashboards for action
Good operational dashboards should not be cluttered scorecards. They should guide action.
That means role-based design:
- Plant leaders need current status, line performance, losses, exceptions, and owner-level actions.
- Operations directors need site comparisons, KPI trends, bottlenecks, and escalation views.
- Frontline teams need shift-level visibility, clear targets, and immediate exception cues.
The most effective dashboard designs emphasize:
- Trends over time
- Exceptions against threshold
- Drill-down paths to root cause
- Role-based summary views
- Clear ownership indicators
A practical operational cockpit built in FineReport might include:
- Site-level KPI scorecard
- Trend charts for output, downtime, yield, and energy
- Exception list with severity status
- Drill-down from network to plant to line
- Action or follow-up status section
Once this cockpit exists, Dora can sit on top of it as an AI assistant layer, making the reporting assets easier to use without replacing the governed reporting foundation.
Step 4: Turn KPI Reviews Into Operational Action
Create a review cadence that drives accountability
KPIs only improve performance when they are embedded in review routines. Operations directors should define a cadence that matches the speed of the business:
- Daily reviews: Shift output, downtime, quality losses, schedule adherence, immediate risks
- Weekly reviews: Reliability trends, recurring exceptions, labor and service performance, open actions
- Monthly reviews: Strategic KPI movement, target resets, cross-site comparison, improvement initiative tracking
Every review should answer four questions:
- What changed?
- Why did it change?
- Who owns the response?
- When will follow-up be reviewed?
That means KPI reviews need named owners, escalation paths, and a simple mechanism for tracking actions. Without that, dashboards become passive reporting tools instead of decision tools.
Use KPIs to support continuous improvement
Operations performance management should also support continuous improvement, not just daily control. Teams should track whether corrective actions deliver measurable gains over time.
Examples include:
- Did maintenance actions reduce unplanned downtime?
- Did process changes improve first-pass yield?
- Did labor rebalancing reduce overtime without hurting service?
- Did energy optimization reduce consumption per unit?
Targets should also be refreshed as demand, capacity, product mix, and constraints change. Static targets can create false comfort or false alarm.
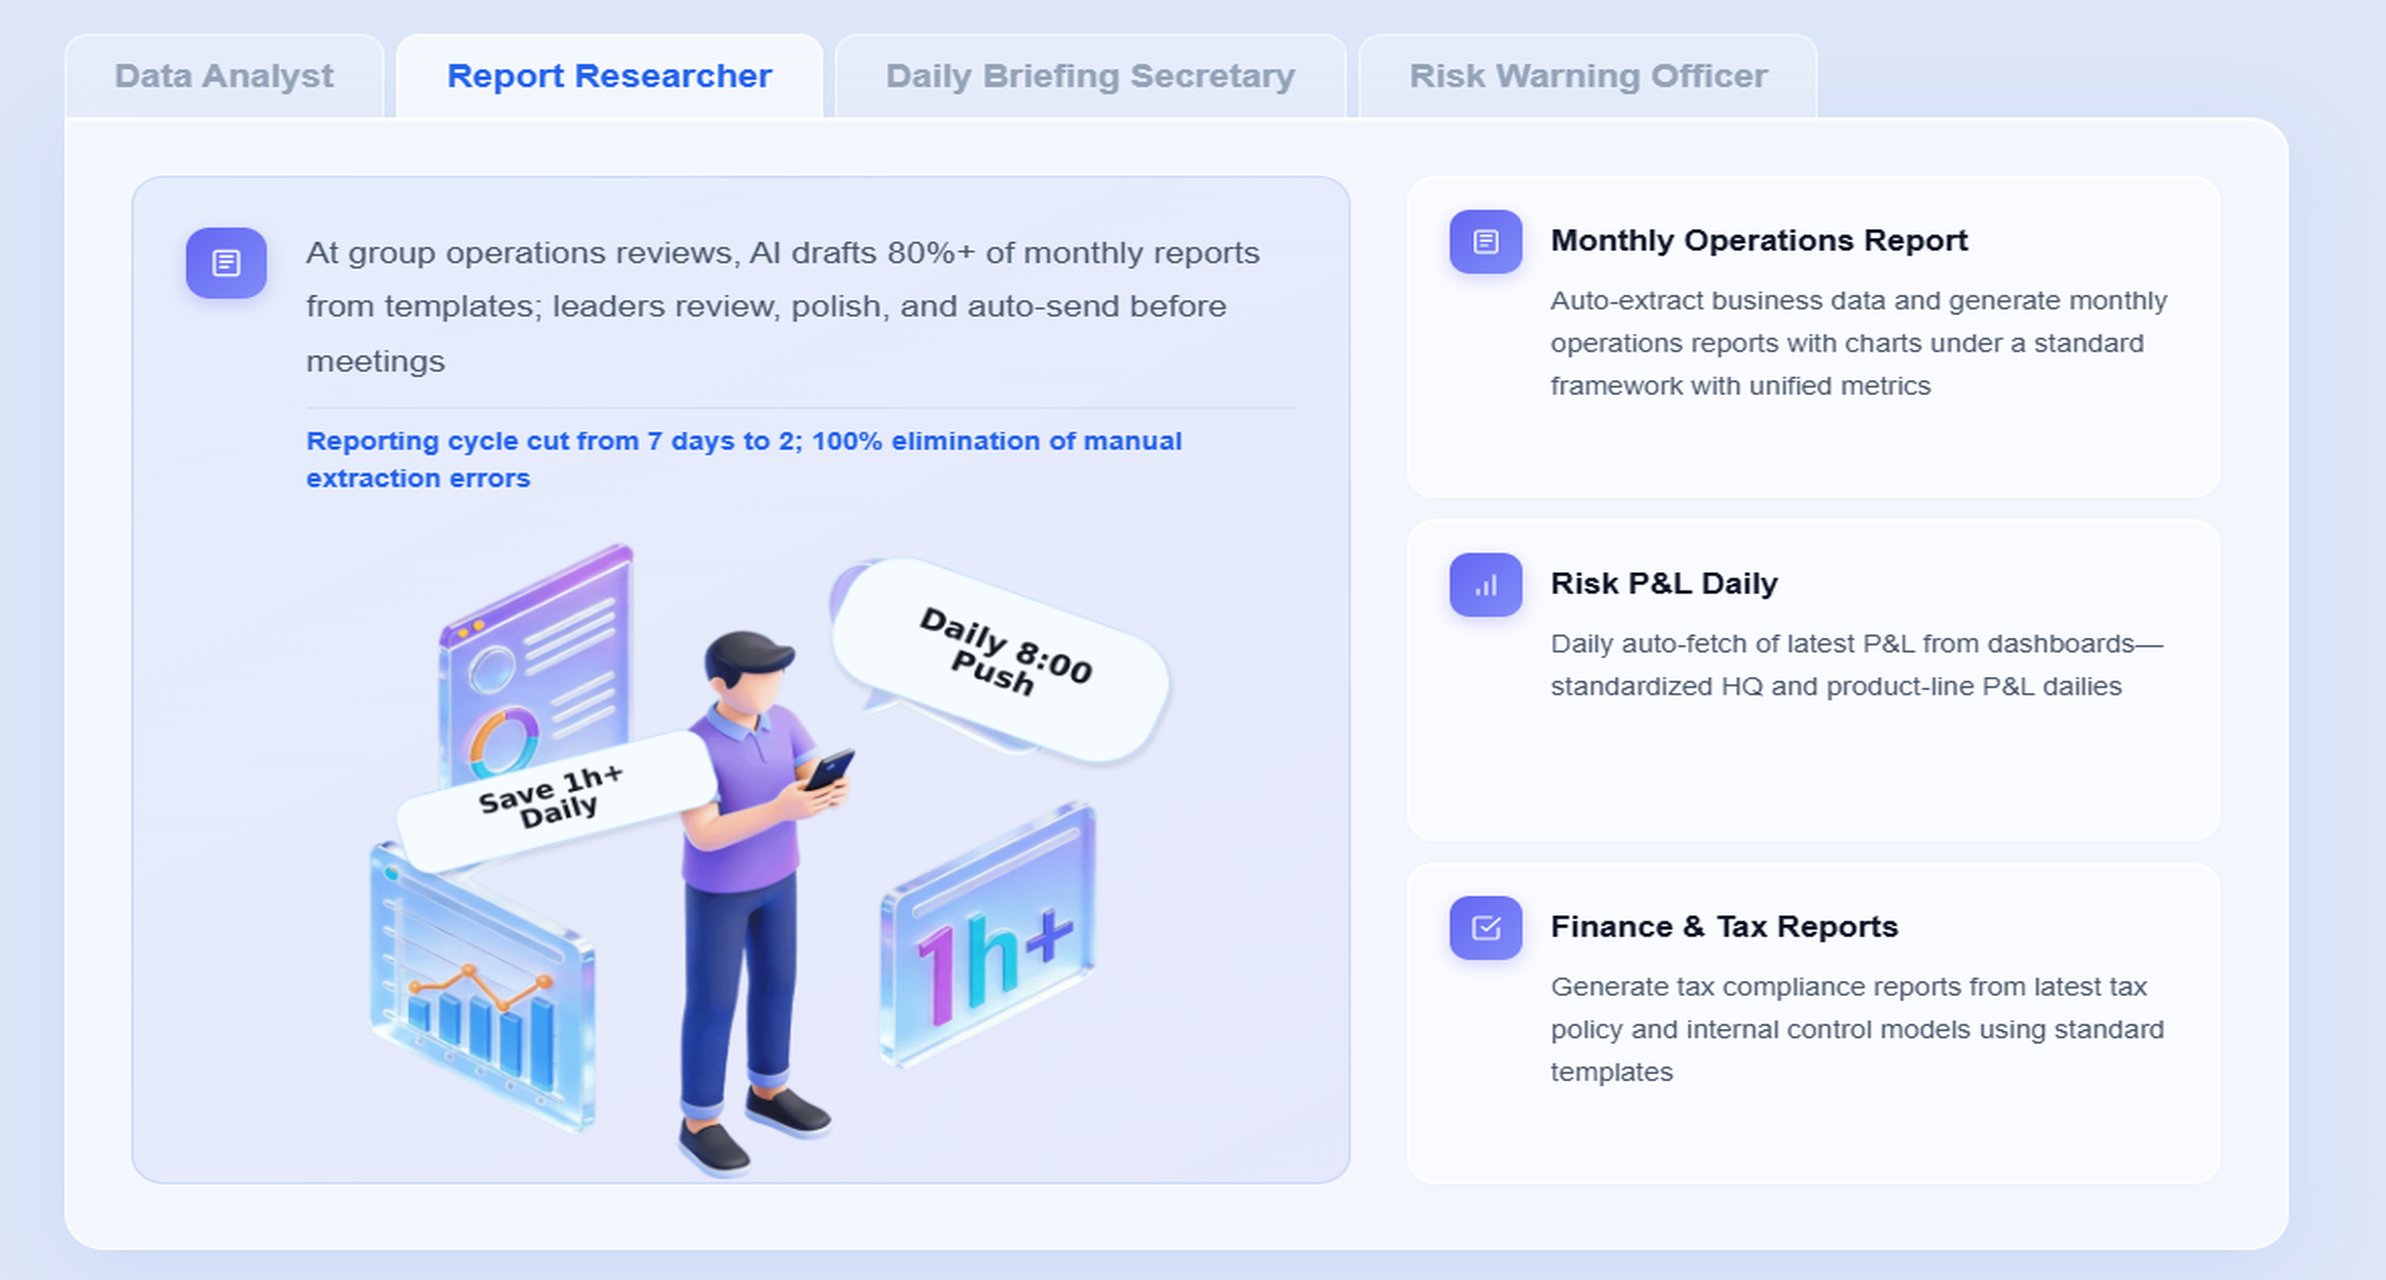
How FineReport + Dora helps: FineReport can structure the recurring reports, operational cockpits, and exception tables used in these reviews. Dora can then act as a Daily Briefing Secretary, generating scheduled summaries before daily or weekly meetings, highlighting what changed, and listing open issues that require follow-up.
Step 5: Scale the Framework Across Sites
Standardize without losing local relevance
Multi-site operations need consistency, but they also need context. The best approach is to define a common KPI backbone across sites while allowing local supporting metrics where necessary.
For example, all plants may use the same definitions for:
- OEE
- Scrap rate
- Unplanned downtime
- On-time delivery
- Energy per unit
At the same time, individual sites may need supporting metrics tied to local processes, product complexity, utility constraints, or customer requirements.
To compare performance fairly, operations directors should account for:
- Product mix
- Capacity differences
- Equipment age
- Process complexity
- Operating model differences
Standardization should improve comparability, not oversimplify reality.
Plan for adoption and long-term governance
Long-term success depends on governance. Someone needs to own:
- KPI definition changes
- Dashboard ownership
- Data stewardship
- Threshold updates
- Permission rules
- Review routines
Adoption is equally important. Even a well-designed KPI framework will underperform if teams do not use it consistently. That is why operations directors should support:
- Training by role
- Consistent review routines
- Visible leadership participation
- Clear escalation expectations
- Ongoing feedback to improve reporting usability
This is also where an enterprise Data Agent becomes practical rather than experimental. If users already trust the KPI framework and FineReport assets, Dora can increase adoption by reducing friction. Instead of asking users to search for the right report and interpret it manually, Dora can help them consume the right information in chat, through scheduled summaries, and through exception pushes.
How an AI Data Agent Automates Report Consumption
For operations directors, one of the biggest reporting problems is not report creation alone. It is report consumption. Even when dashboards exist, leaders still spend time opening multiple views, checking status changes, preparing meeting summaries, and following up with site owners.
This is where Dora, FanRuan’s enterprise Data Agent platform, adds measurable operational value. Dora sits on top of trusted FineReport reports, cockpits, and semantic definitions to create a scenario-based AI assistant experience for operations performance management.
The most relevant Dora digital employee in this scenario is the Daily Briefing Secretary, supported by Report Researcher and Risk Alert Officer capabilities.
A concrete chat-style example
An operations director might ask:
“Summarize this week’s operations performance report, highlight sites with abnormal downtime or scrap increase, explain which KPIs missed target, and list the owners who need follow-up.”
Instead of manually reading multiple dashboards and exporting notes, Dora can use governed report assets and KPI definitions to generate a structured report summary.
A practical 6-step Dora workflow
-
Retrieve trusted FineReport report or operational cockpit data
Dora accesses the relevant FineReport report, dashboard, or management cockpit for operations performance. -
Understand KPI definitions, filters, and business rules
Dora references the governed semantic layer, including metric definitions, target thresholds, site filters, and exception logic. -
Generate a structured report summary
Dora creates a management-ready summary with chart explanations, KPI changes, missed targets, and trend highlights. -
Detect exceptions and abnormal changes
Dora identifies issues such as downtime spikes, rising scrap, low schedule adherence, or threshold breaches that need attention. -
Push alerts or briefings to responsible users
Dora can distribute scheduled daily or weekly briefings and push exception notices to plant leaders, operations managers, or functional owners. -
Record follow-up and support review preparation
Dora can produce follow-up lists, recurring summaries, and meeting preparation notes so leaders can review actions consistently.
Why the FineReport foundation matters
Dora works best when there is already a trusted reporting foundation. FineReport provides that foundation by organizing:
- Operational cockpits
- KPI reports
- Exception lists
- Role-based dashboards
- Management report templates
- Permission-controlled access
- Standardized business terms and reporting logic
This is critical because enterprise AI workflows should not rely on raw, ungoverned prompts alone. FineReport gives Dora structured, governed reporting assets to work from. That improves answer quality, reduces ambiguity, and makes AI output more aligned with the business.
How Dora improves execution in real operations
Dora is not positioned as a replacement for FineReport. It is the AI assistant layer that helps teams move from manual report reading to governed AI-enabled execution.
In operations performance management, Dora can help by:
- Enabling natural-language query over trusted reporting assets
- Retrieving reports, cockpits, metrics, and exceptions from FineReport
- Generating structured report summaries, chart explanations, and management narratives
- Sending scheduled summaries and daily or weekly briefings
- Detecting KPI exceptions and pushing alerts to the right owner
- Supporting repeatable workflows through digital employees and governed Skills
- Improving control and auditability compared with raw prompt-only agent workflows
For enterprise teams, this matters because AI adoption succeeds when it lands in repeatable scenarios. A weekly operations performance briefing, a daily plant exception summary, and a monthly management report are all strong landing points. They are repetitive, decision-oriented, and already grounded in trusted report assets.
Common Mistakes to Avoid When Building a KPI Framework
Even mature operations teams run into the same framework problems repeatedly. Avoid these common mistakes:
-
Tracking too many KPIs at once
Too many metrics dilute focus and make reviews slow. Start with the measures that directly support decisions and accountability. -
Choosing metrics without clear owners or response plans
A KPI without an owner is only a number. Every major measure should have a responsible team and a defined response when thresholds are missed. -
Ignoring data quality issues until trust in reporting declines
If source data is delayed, inconsistent, or incomplete, users will stop relying on the dashboard. Fixing trust later is harder than addressing quality early. -
Treating dashboards as the outcome instead of better operational decisions
The real objective is improved action, not more visualizations. Dashboards should support operational control, escalation, and improvement. -
Rolling out AI before KPI governance is ready
AI works best when KPI definitions, report templates, permissions, and semantic rules are already clear. Without that foundation, summaries and alerts may create confusion instead of clarity.
Actionable Best Practices
1. Standardize KPI definitions before expanding dashboards
Create a KPI dictionary that includes formulas, owners, targets, thresholds, data sources, and refresh cadence. This reduces reporting disputes and gives both FineReport and Dora a stable foundation for reporting and AI-assisted interpretation.
2. Start with high-value recurring reports
Do not try to automate every operational view at once. Begin with recurring management scenarios such as:
- Daily plant performance summary
- Weekly operations exception review
- Monthly site comparison report
- Reliability and quality escalation summary
These are the most practical scenarios for Dora’s Daily Briefing Secretary, Report Researcher, or Risk Alert Officer capabilities.
3. Build a semantic layer into the reporting workflow
AI reporting works better when business terms are governed. Standardize KPI meaning, business rules, filters, exception logic, and role-specific definitions inside the reporting environment. FineReport provides the trusted reporting and semantic foundation that Dora can use for more controlled responses.
4. Preserve permission governance and human review
AI-generated report narratives should respect FineReport access boundaries. Users should only receive summaries and details they are authorized to see. It is also wise to use human review for important management narratives at the beginning, then gradually expand Dora Skills and automation scope.
5. Define alert thresholds and follow-up rules clearly
If Dora is going to push exception alerts, teams need clear rules for:
- What qualifies as an exception
- Who receives the alert
- How fast the response is expected
- When escalation occurs
- How follow-up is recorded
This keeps the AI workflow governed and operationally useful rather than noisy.
FineReport + Dora Solution Pitch
Building this manually is complex. FineReport helps teams standardize trusted reports, operational cockpits, templates, and reporting workflows. Dora turns those assets into an AI assistant that can answer report questions in chat, generate structured summaries, push scheduled briefings, monitor exceptions, and follow up with responsible owners.
For operations directors working on GE digital operations performance management, this combination is practical because it connects three things that often remain separate:
- The KPI framework
- The reporting and cockpit layer
- The AI execution layer for report consumption and follow-up
FineReport provides the reporting foundation for:
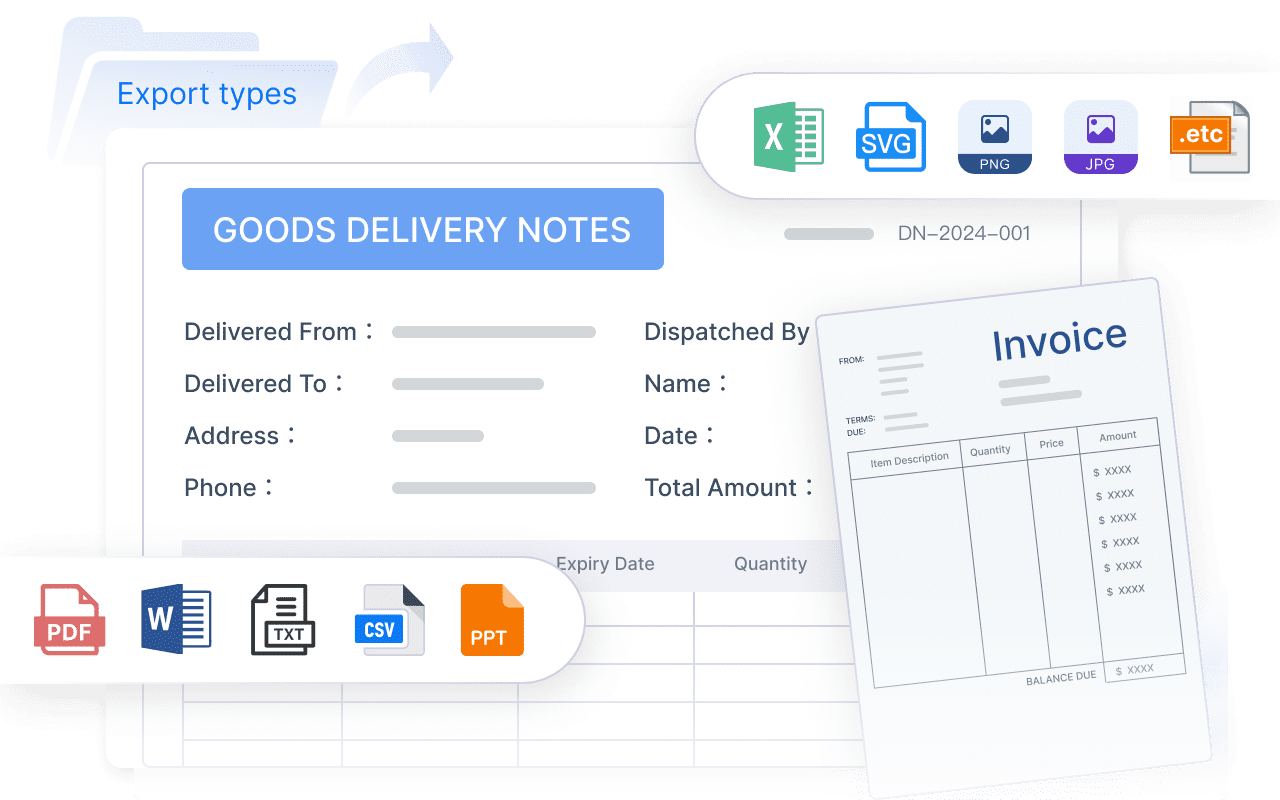
- Formatted production and management reports
- Operational cockpits for plant and multi-site visibility
- Data entry and reporting workflows
- Governance for templates, permissions, and KPI definitions
- Reporting automation for recurring operational use cases
Dora provides the AI layer for:
- Natural-language access to trusted report assets
- Chat-based report consumption
- Structured report summaries and chart explanations
- Scheduled daily and weekly briefings
- Exception alerts and push notifications
- Governed Skills-based execution for repeatable workflows
FineReport + Dora is not only a reporting upgrade; it is a practical fourth-generation Agentic BI path. FineReport provides governed reports and operational cockpits. Dora provides the AI assistant layer for scenario execution, with more controlled Skills, lower token waste, faster execution paths, and more stable workflows than prompt-only agents.
This matters for enterprise landing. Many organizations do not struggle to imagine AI. They struggle to operationalize it. The strongest use case is not a generic demo. It is a scenario such as:
- Daily site performance briefing
- Weekly downtime and scrap exception review
- Monthly cross-site management summary
- Owner-based follow-up for KPI breaches
That is where scenario + product + service becomes the strongest pitch. FineReport provides the trusted reporting foundation, Dora provides the AI digital employee, and implementation service connects data, governance, semantic setup, Skills, report templates, permissions, and rollout.

Get Ready-to-Use Dashboard Templates in Fine Gallery
For operations directors, the takeaway is simple: a KPI framework only creates value when it improves decisions, accountability, and execution. With FineReport + Dora, that framework becomes easier to standardize, easier to consume, and easier to act on across plants and sites.
FAQs
It is a structured approach to connecting operational data, standardizing KPIs, and running review processes that improve plant or multi-site performance. The goal is to support faster decisions on throughput, cost, quality, service, and risk.