Monthly executive risk reporting exists to help leaders make faster, better decisions about exposure, mitigation, and resource allocation. Yet many teams still send updates that are too long, too inconsistent, or too operational to be useful in the boardroom. If you need a practical way to make monthly reports clearer, more comparable, and more action-oriented, these risk management reporting format examples will help you standardize reporting and improve executive decision-making.
All reports in this article are built with FineReport.
Risk management reporting is the structured communication of an organization’s key risks, changes in exposure, mitigation progress, and required decisions to stakeholders such as executives, risk committees, and business leaders.
For monthly executive reporting, the objective is not to document every risk event in detail. It is to present the few issues that require leadership attention in a format that is easy to scan and easy to compare over time.
A strong monthly risk report typically answers five questions:
What are the most important risks right now?
How have those risks changed since last month?
What business impact could they create?
Are mitigation actions on track?
What decisions or escalations are needed from leadership?
Key Metrics (KPIs) for monthly executive risk management reporting
To make any of the risk management reporting format examples effective, define a small, consistent set of KPIs:
Current risk rating: The latest assessed severity of the risk based on likelihood and impact.
Prior risk rating: Last month’s rating for quick comparison.
Trend direction: Whether the risk is increasing, decreasing, or stable.
Likelihood score: The probability that the risk will occur.
Impact score: The potential financial, operational, regulatory, or reputational effect.
Mitigation status: Whether actions are on track, delayed, complete, or blocked.
Risk owner: The accountable leader responsible for managing the risk.
Target resolution date: The expected date for mitigation completion or next major milestone.
Business impact summary: A concise explanation of what the risk could affect.
Escalation need: Whether executive action, budget, or cross-functional support is required.
Why monthly executive risk management reporting often fails
Many reporting processes fail not because the risk team lacks data, but because the format does not support executive consumption. Leaders need clarity, prioritization, and action signals. They do not need a dense operational log.
Too much detail obscures the few decisions leaders actually need to make
One common mistake is pushing raw risk-register content into an executive report. This creates noise. Executives should see only the most material risks, the latest movement, and the actions that need sponsorship or approval.
When every risk is presented with equal weight, truly urgent items lose visibility.
Inconsistent structure makes it hard to compare this month’s risks with prior periods
If each monthly update uses a different layout, changes fields, or revises scoring logic without explanation, executives cannot easily spot trends. Consistency is what turns reporting into management.
A standardized format makes it possible to answer questions like:
Which risks have escalated for three consecutive months?
Which business unit is accumulating the most overdue mitigation actions?
Which issues are stable and no longer need executive airtime?
Metrics without business context leave executives unsure about urgency, ownership, and next steps
A heat score alone does not tell a leader whether the issue threatens revenue, compliance, customer delivery, or strategic objectives. Nor does it show whether the team is actively managing the problem.
Good executive reporting connects metrics to:
Business consequence
Named ownership
Mitigation progress
Required decision or support
How to choose among risk management reporting format examples
The right format depends on who will read the report, how often they make decisions, and what kind of action the report is meant to trigger.
Match the format to the executive audience, decision cadence, and reporting goals
A CFO may want a view centered on financial exposure and control gaps. A COO may prioritize operational continuity and supply chain disruption. A CEO often wants enterprise-level concentration, trend movement, and resource implications.
Think first about the reporting use case:
Board or C-suite review: Keep it strategic, concise, and highly visual.
Risk committee meeting: Include trend analysis and action ownership.
Business unit review: Add local detail, but preserve a standard summary layer.
Escalation meeting: Use a format built around decisions and blockers.
Decide whether the update should emphasize trends, top risks, actions, or business impact
Not every monthly report should look the same. Some organizations need rapid visibility into top exposures. Others need follow-through on mitigation plans. The format should reflect the main decision objective.
Choose the emphasis carefully:
Trends when leadership needs to understand movement over time
Top risks when prioritization is the main need
Actions when execution discipline is the problem
Business impact when strategic tradeoffs or funding decisions are likely
Standardize a small set of fields so every monthly report is easy to scan
No matter which format you choose, keep the core fields consistent. This supports comparison, improves trust in the data, and reduces reporting friction for risk owners.
A practical executive reporting standard usually includes:
Risk title
Brief description
Current rating
Prior rating
Trend
Business impact
Owner
Mitigation status
Target date
Escalation or decision needed
7 risk management reporting format examples for monthly executive updates
Below are seven proven risk management reporting format examples that work well for monthly executive updates. Each serves a different reporting goal.
1. One-page risk dashboard
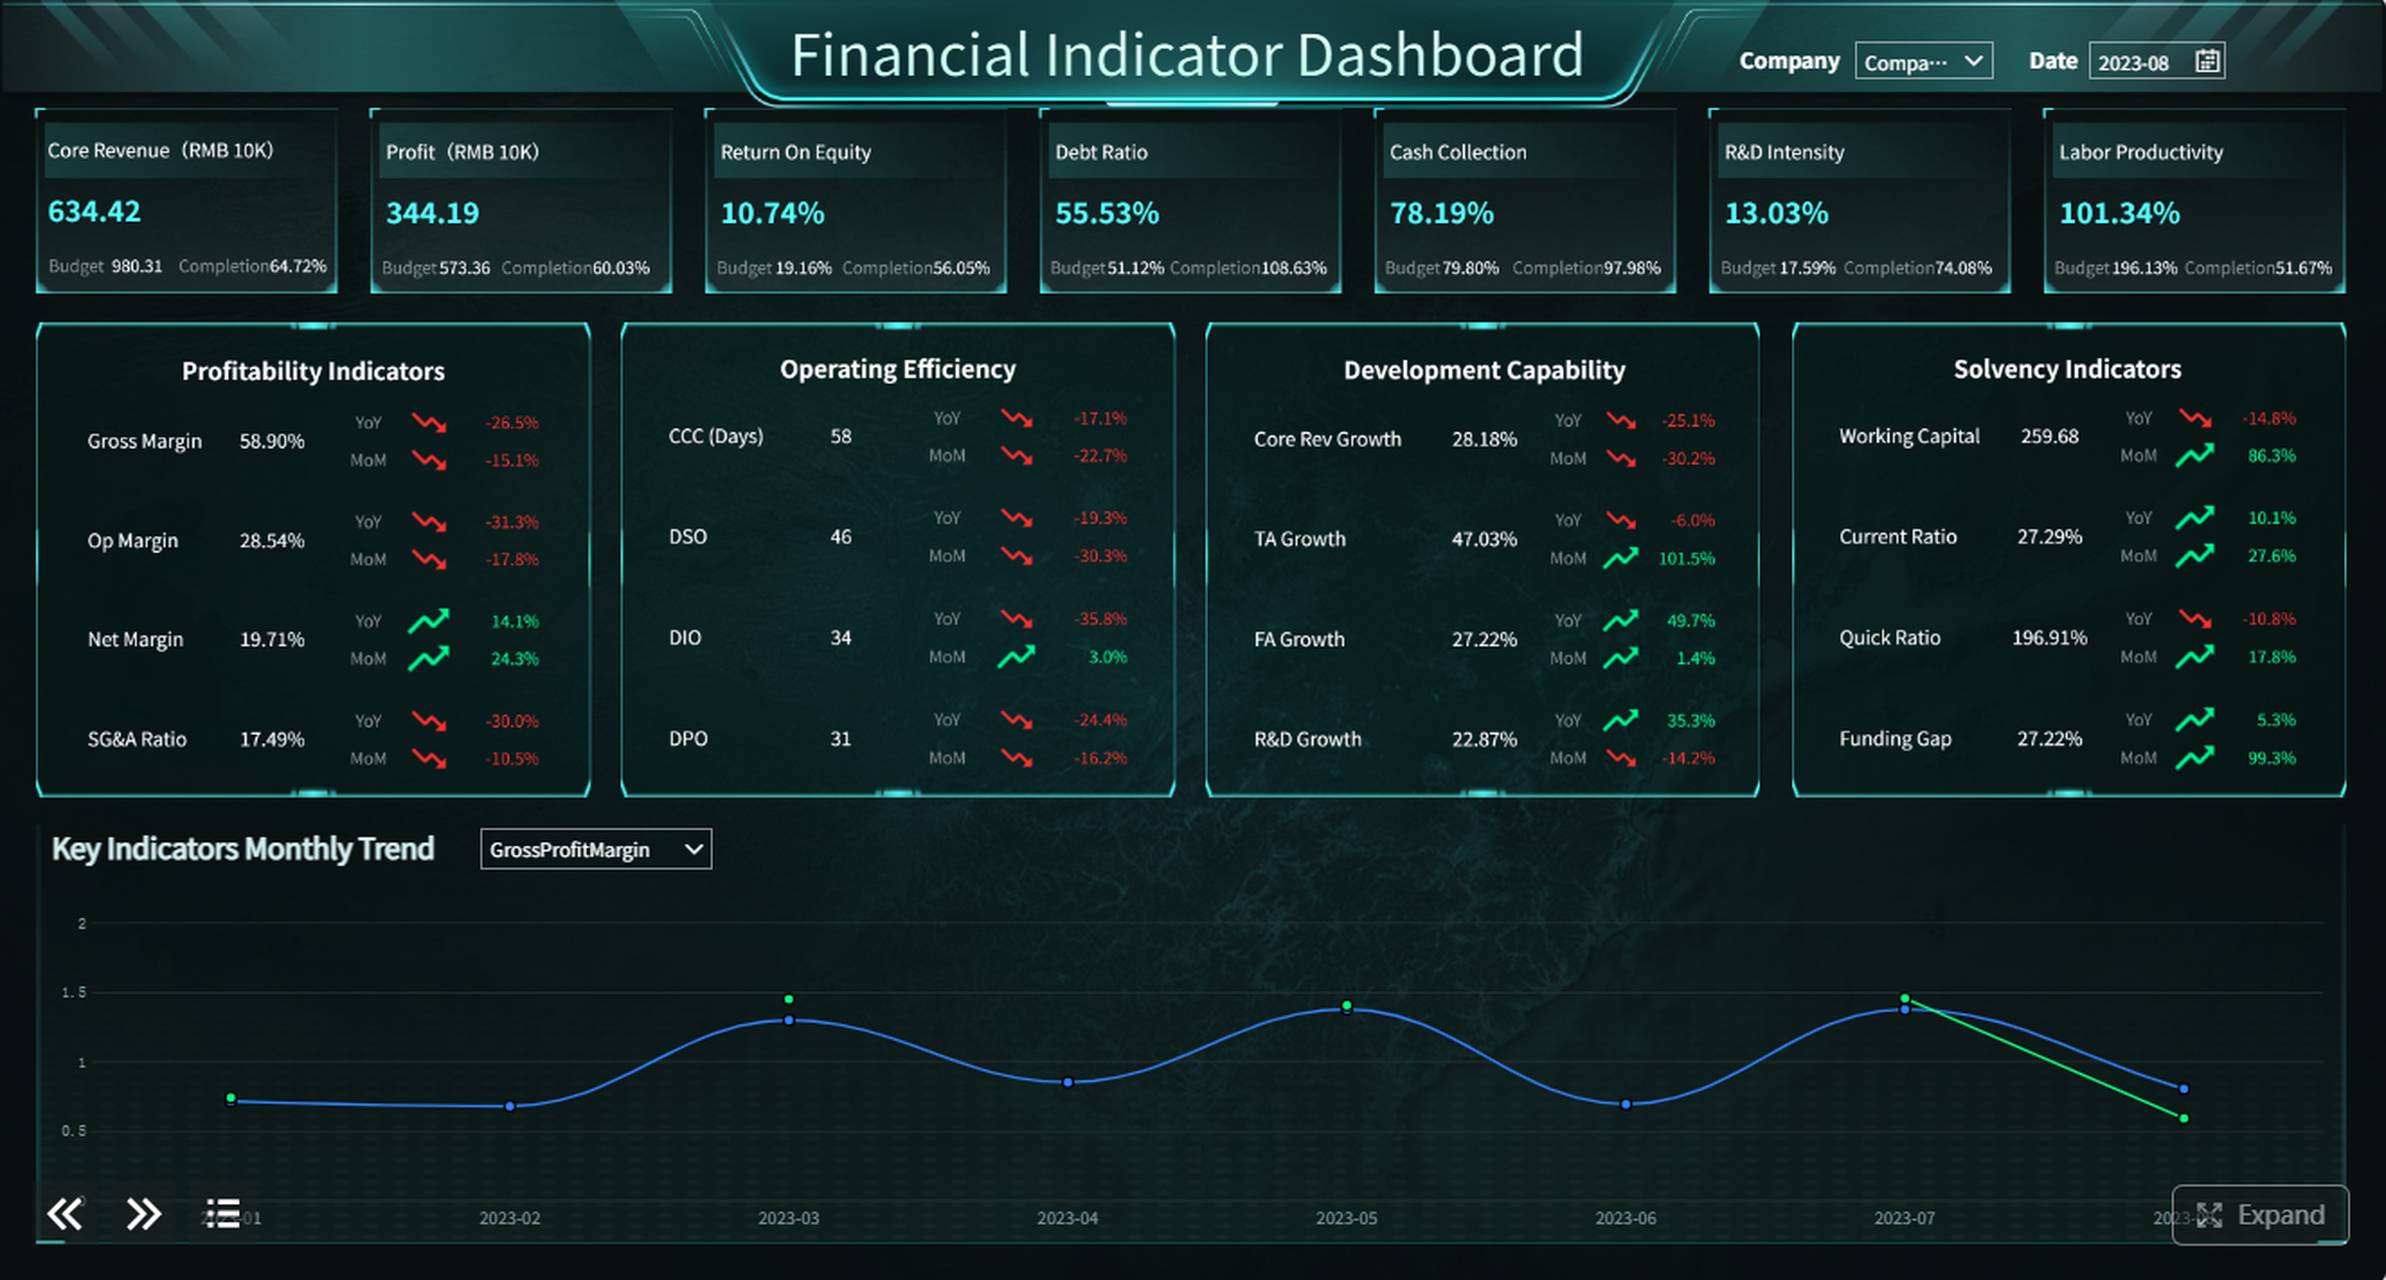
A one-page risk dashboard condenses the monthly risk picture into a single executive view. It usually includes top risks, rating changes, action status, owners, and immediate priorities.
This format is best when leaders want a quick snapshot before a meeting or when reporting time is limited.
Best use case
Use this when:
Executives review the report in advance of a short leadership meeting
The organization wants a repeatable monthly summary
Senior leaders need immediate visibility without reading long narrative sections
What to include
Top 5 to 10 risks
Current and prior rating
Trend arrows
Risk owner
Mitigation status
Required action this month
Why it works
A one-page layout forces prioritization. It is especially effective when the main challenge is executive attention span.
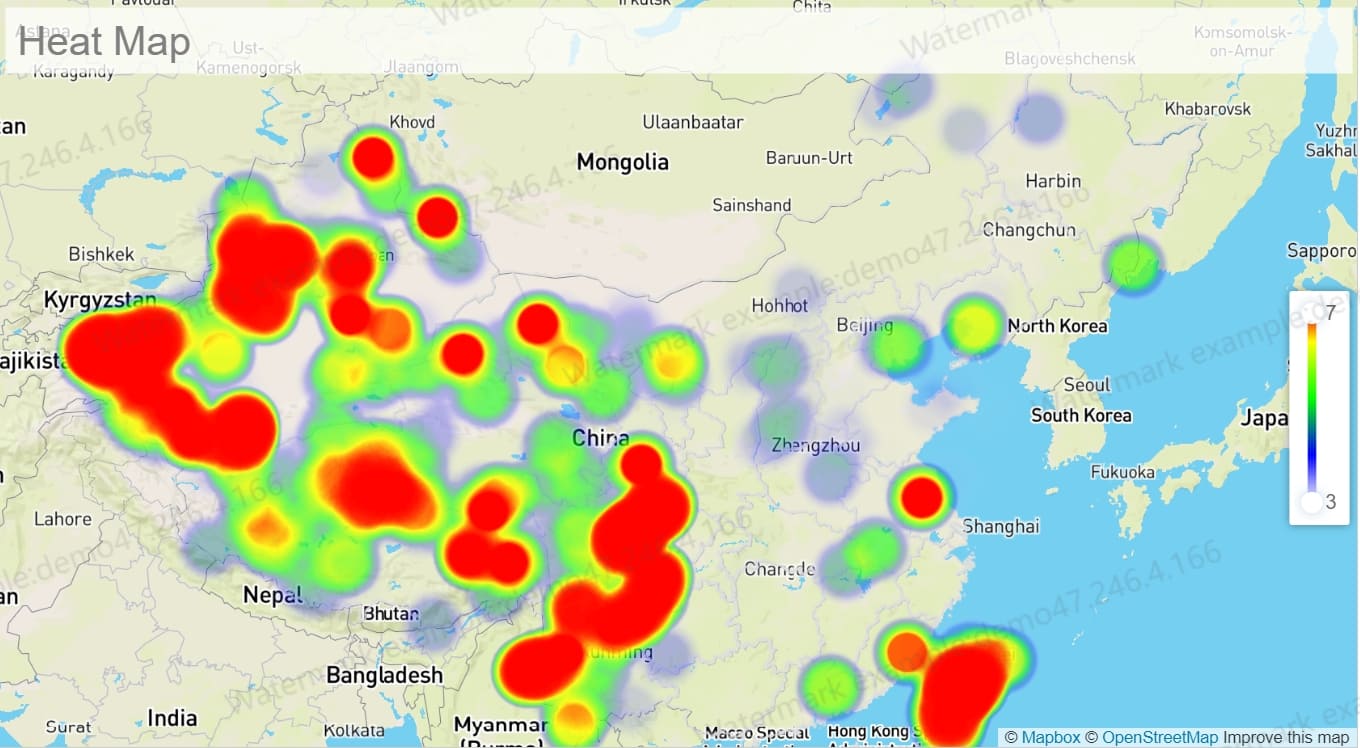
A heat map summary plots risks by likelihood and impact, helping executives see where high-priority exposure is concentrated across the portfolio.
This is one of the most recognizable risk management reporting format examples because it turns abstract scoring into a visual decision aid.
Best use case
Use this when:
Leadership needs a portfolio-level exposure view
The goal is to show clustering of severe risks
You want to compare concentration changes month over month
What to include
Likelihood-impact matrix
Color-coded severity bands
Labels for top risks
Count of risks in each zone
Optional filters by unit, region, or category
Why it works
Executives can quickly identify whether risks are accumulating in the high-likelihood, high-impact zone. It is ideal for visual prioritization, though it should be paired with action details elsewhere.
3. Top risks with action tracker
This format pairs each key risk with its mitigation plan, due dates, blockers, and accountable owner. It shifts focus from visibility to follow-through.
When leadership is frustrated by recurring issues that remain unresolved, this format is often the best choice.
Best use case
Use this when:
Executive concern is execution, not just awareness
Mitigation plans involve multiple departments
Delays and dependency issues need escalation
What to include
Risk title
Mitigation action
Action owner
Due date
Current status
Blocker or dependency
Escalation required
Why it works
It creates accountability. Instead of simply telling leaders what the risks are, it shows whether the organization is doing what it said it would do.
4. Trend-based monthly comparison
A trend-based monthly comparison highlights what moved up, down, or stayed stable since the previous reporting cycle. This keeps executive attention on change rather than static repetition.
It is particularly useful for mature organizations where the main question is not “What are our risks?” but “What changed and why?”
Best use case
Use this when:
The audience already knows the recurring risk universe
Monthly reporting should focus on movement
Leadership wants a concise explanation of changes
What to include
Current vs prior rating
Trend arrows or variance indicators
New risks added
Risks downgraded or closed
Commentary on change drivers
Why it works
It reduces reporting fatigue. Executives can zero in on change signals and avoid rereading stable information every month.
A business-unit roll-up organizes risks by function, geography, product line, or operating unit. It balances local accountability with enterprise oversight.
This format works well when risks originate in different parts of the business, but leaders still need a consolidated view.
Best use case
Use this when:
The company has multiple regions, brands, or business units
Risk ownership is decentralized
Enterprise leadership wants to compare exposure across units
What to include
Unit-level top risks
Unit risk count by severity
Common enterprise themes
Overdue actions by unit
Consolidated enterprise summary
Why it works
It helps leadership distinguish isolated unit issues from systemic enterprise risks. It also makes it easier to identify where support or intervention is needed.
6. Exception-only report
An exception-only report shows only risks that are new, escalated, overdue, or above a defined threshold. It is concise by design.
This is one of the most efficient risk management reporting format examples for organizations that already maintain a live dashboard elsewhere.
Best use case
Use this when:
Executives already have access to a standing dashboard
The monthly update should focus only on material exceptions
Reporting efficiency and speed matter
What to include
Newly identified risks
Escalated risks
Overdue mitigation actions
Threshold breaches
Immediate attention items
Why it works
It respects executive time. Instead of repeating everything, it highlights only what changed enough to matter.
7. Decision-oriented executive brief
A decision-oriented executive brief frames each risk around the leadership decisions required. It is less about description and more about action, tradeoffs, and resource implications.
This is ideal when executives must approve plans quickly in a meeting.
Best use case
Use this when:
Leadership meetings are decision-heavy
Risks require funding, policy, or cross-functional coordination
Fast approvals are more important than broad visibility
What to include
Risk statement
Business consequence
Options under consideration
Recommended action
Cost or resource implications
Decision required by date
Why it works
It aligns risk reporting with executive workflow. Leaders are not just informed; they are guided toward a decision.
What to include in every monthly executive risk report
Regardless of format, some content elements should always appear. This is what makes reports easy to compare, easy to trust, and easy to act on.
Core fields that make reports easy to compare
At a minimum, every monthly report should include these standard fields:
Risk title and short description: A clear label and concise explanation.
Current rating: The latest severity level.
Prior rating: The previous month’s severity level.
Trend direction: Up, down, or stable.
Business impact: What the risk could disrupt or damage.
Owner: The accountable person or function.
Mitigation status: Whether planned action is on track.
Target date: The timeline for mitigation completion or review.
These fields create a consistent reading experience and reduce unnecessary back-and-forth with executives.
Supporting context executives actually use
Metrics alone are not enough. Add just enough narrative to clarify urgency and actionability.
Executives typically want to know:
What changed this month and why it matters now
Whether action is on track, delayed, or blocked
What decision, escalation, or resource support is needed
A useful rule is to keep narrative short but specific. One or two sentences per key risk is often enough.
Common mistakes to avoid when using these risk management reporting formats
Even the best template will fail if the reporting process is weak. These are the most common mistakes I see in monthly executive reporting.
Mixing operational detail with executive summary content
If the first page reads like an audit workpaper, executives will disengage. Keep detailed logs in supporting tabs or appendices, not in the main summary.
Changing categories or scoring methods from month to month without explanation
Shifting definitions breaks trust and ruins trend analysis. If methodology changes are necessary, flag them clearly and explain the impact.
Listing risks without clarifying actions, deadlines, or ownership
A risk without an owner and a next step is not executive-ready. Every major issue should link to accountability and timing.
Presenting too many risks instead of prioritizing the few that matter most
Most executive teams do not need to review 30 risks every month. They need the top handful that could materially affect strategic, operational, or financial performance.
How to implement these risk management reporting formats effectively
Choosing among risk management reporting format examples is only the first step. Implementation discipline is what turns a template into a management tool.
1. Define a reporting standard before building visuals
Start with the mandatory fields, scoring definitions, update frequency, and threshold rules. Do not let each function invent its own version.
2. Limit executive reports to the most material risks
Create threshold logic for what belongs in the monthly executive pack. Keep lower-level operational risks in the detailed register.
3. Separate summary, analysis, and action tracking layers
Use one layer for executive summary, one for supporting context, and one for operational follow-up. This prevents clutter while preserving drill-down capability.
4. Automate data collection where possible
Manual reporting creates delays, inconsistency, and version-control problems. Pull data from source systems, standard forms, or structured business inputs whenever possible.
5. Review the report format quarterly with stakeholders
Executive needs change. Reassess whether your report is still helping leaders prioritize, compare, and decide.
After implementing these practices, the difference is immediate: shorter meetings, clearer ownership, faster escalations, and more consistent risk oversight.
How FineReport Helps Build executive risk management reports
Building this manually is complex; use FineReport to utilize ready-made templates and automate this entire workflow.
For many organizations, the real challenge is not deciding which reporting format to use. It is building a repeatable process that can consolidate data, standardize layouts, visualize change, and deliver monthly reports without spreadsheet chaos.
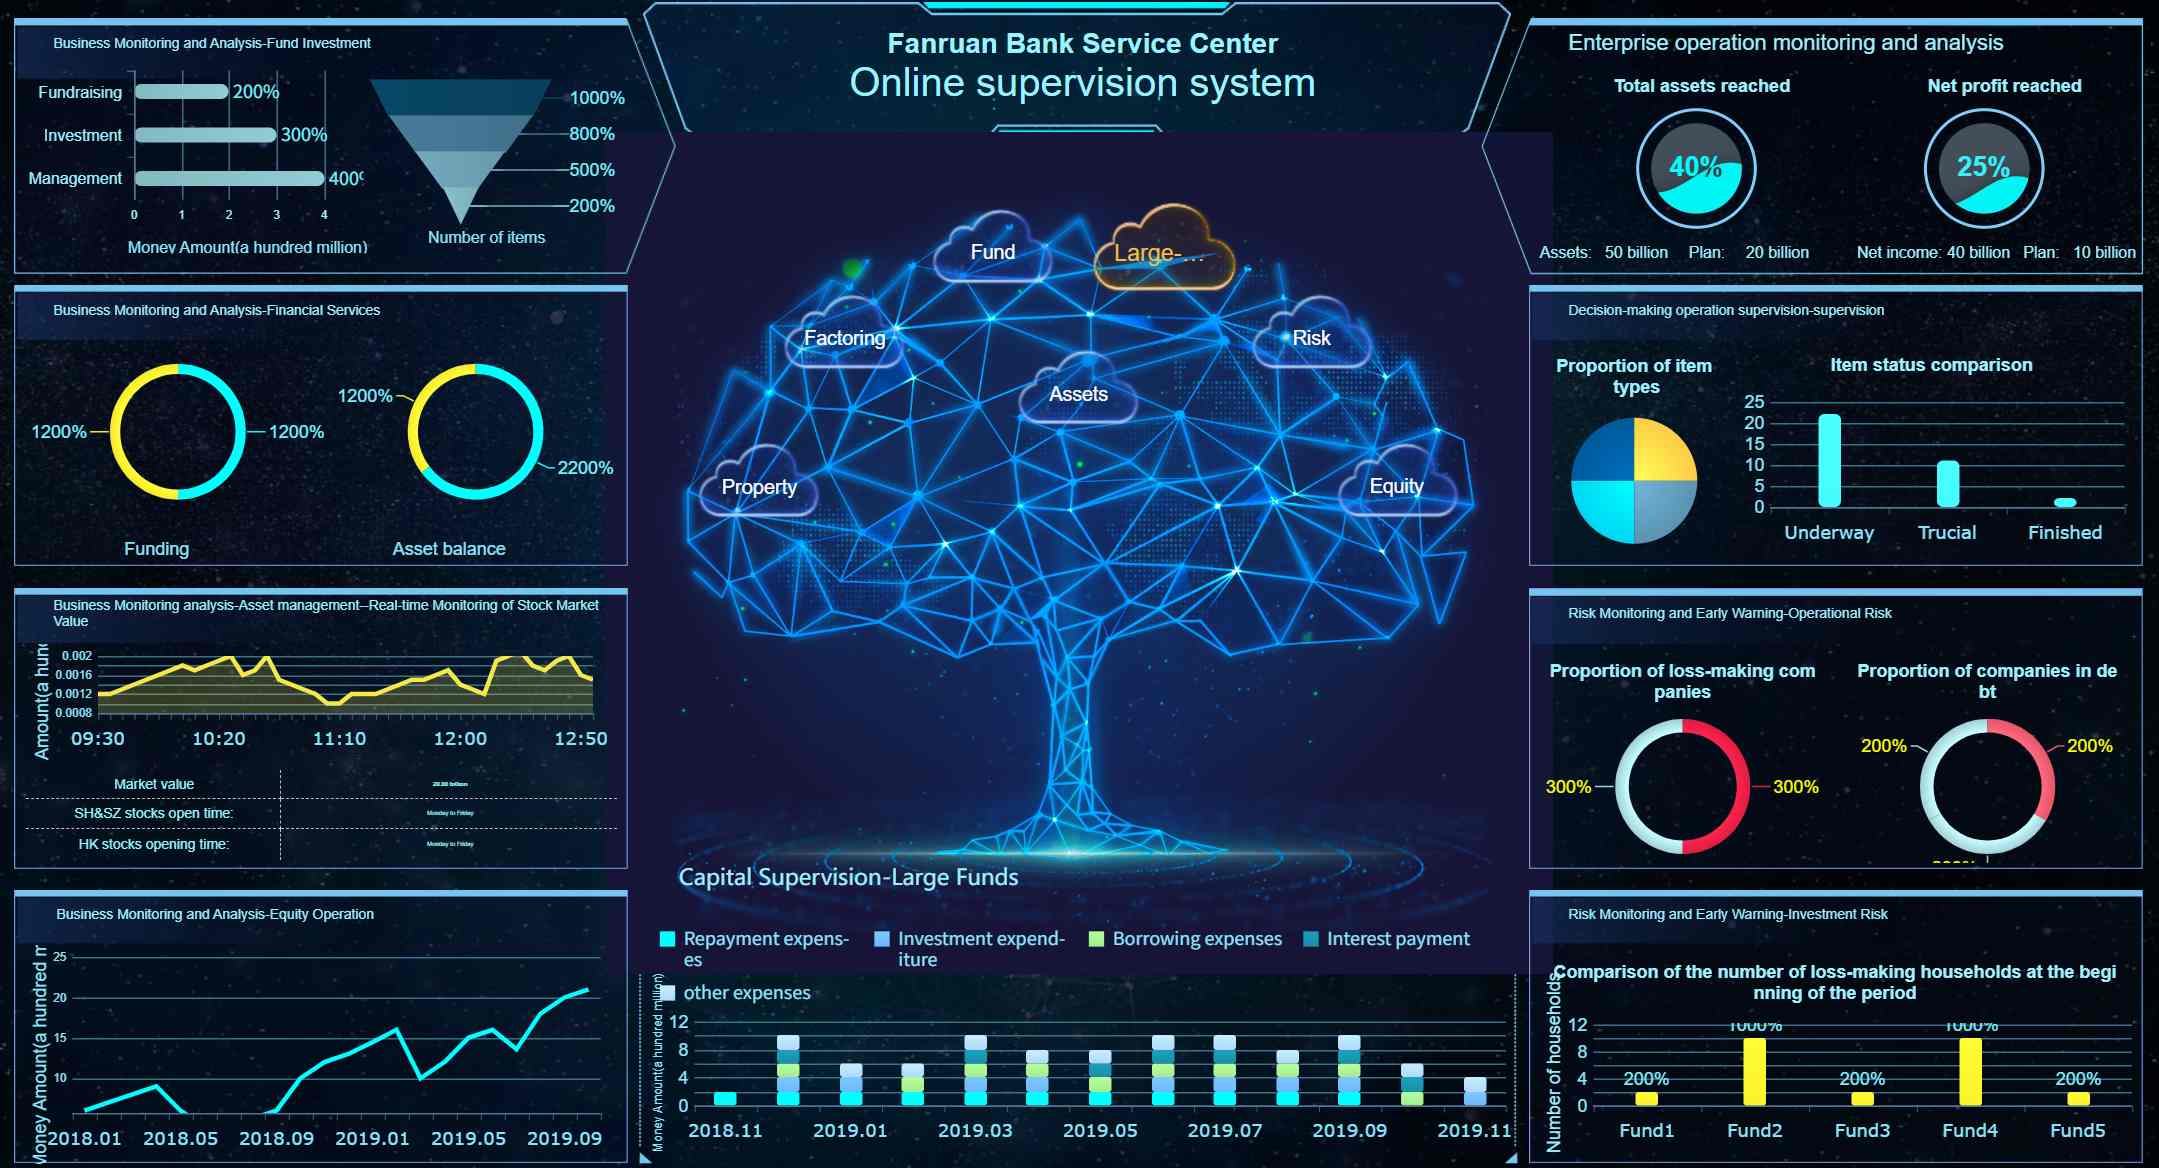
Build one-page executive dashboards with KPI cards, risk tables, and trend indicators
Create heat maps, action trackers, and business-unit roll-ups from a shared data model
Standardize core report fields so every monthly update is easy to compare
Automate scheduled distribution to executives and stakeholders
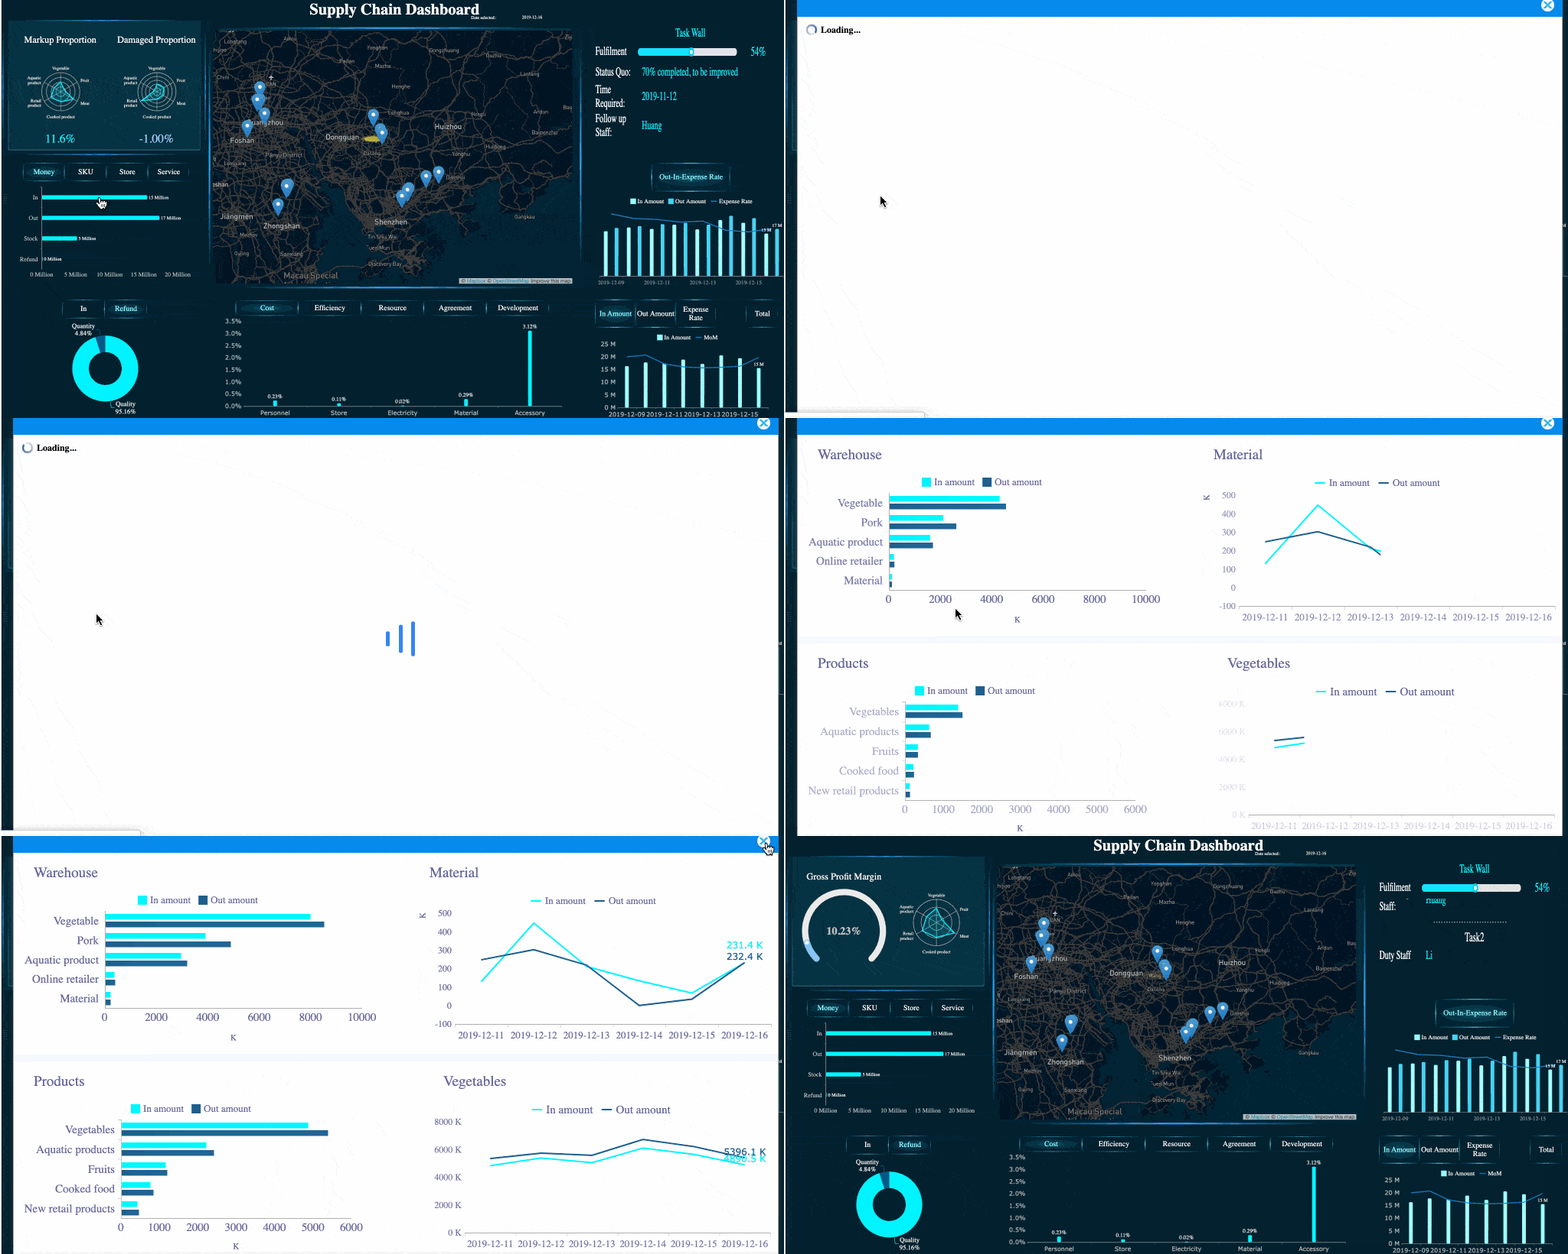
Support drill-down analysis without cluttering the executive summary
Reuse ready-made templates instead of designing each report from scratch
FineReport's Drill-down Capability
This is especially valuable for enterprise teams managing multiple reporting entities, inconsistent source data, and tight monthly reporting timelines.
How Dora Helps improve risk management reporting workflows
Beyond dashboard production, Dora can support the broader reporting workflow by helping teams structure requests, accelerate content generation, and improve coordination around monthly updates.
Simplify monthly executive reporting with the right format
The best risk management reporting format examples all have one thing in common: they make decisions easier. Whether you use a one-page dashboard, a heat map, an action tracker, or a decision-oriented brief, the goal is the same: surface the few risks that matter most, show what changed, and clarify what leaders need to do next.
If your current monthly process is slow, inconsistent, or too detailed, start by standardizing the core fields and selecting one format aligned to your executive audience. From there, automate wherever possible.
Building this manually is complex; use FineReport to utilize ready-made templates and automate this entire workflow.
FAQs
It should highlight the most important current risks, changes since the prior month, potential business impact, mitigation progress, risk ownership, and any decisions or escalations needed from leadership.
Executive reporting is a concise decision-making summary, while a risk register is a more detailed operational record. Leaders usually need prioritized risks, trend signals, and action requirements rather than every event and control detail.
Common KPIs include current and prior risk rating, trend direction, likelihood, impact, mitigation status, risk owner, target resolution date, and escalation need. Using a small consistent set makes monthly comparisons easier.
They often contain too much operational detail, inconsistent structure, or metrics without business context. That makes it harder for executives to quickly understand urgency, ownership, and the decisions they need to make.
Start with the audience, reporting purpose, and decision cadence. A strong format should match whether leaders need a view focused on top risks, trends, mitigation actions, or business impact.
Product Trial
FineReport
Pixel-perfect reports · Interactive dashboards · Easy data entry · Digital twins


 FineReport's Drill-down Capability