Executive leaders do not need a dense analytics export every Monday. They need a web analytics report template that quickly shows what changed, why it matters to the business, and what should happen next. That means combining a trusted reporting foundation with an AI assistant layer that speeds up interpretation and follow-up.
With FineReport + Dora, teams can ask for a report summary in chat, generate structured narratives from trusted report assets, receive scheduled briefings, and push exceptions to the right owner. This is especially useful for weekly executive briefings, where speed, consistency, and decision clarity matter more than raw data volume.
Click To Try The Dashboard
All reports in this article are built with FineReport
What a web analytics report template should do for executive weekly briefings
A weekly executive briefing should help leaders understand performance in minutes, not force them to interpret every dimension and filter manually. The right web analytics report template is designed for business action, not analyst exploration.
An executive weekly briefing is different from a detailed analyst report in several ways:
It emphasizes decision-making speed
It focuses on business impact
It surfaces trend direction and exceptions
It ends with clear next steps and owners
A detailed analyst report may include deep segmentation, attribution debates, exploratory cuts, and technical notes. An executive briefing should answer a smaller set of recurring questions:
Are we growing or slowing down?
Which channels or campaigns drove the result?
Is conversion efficiency improving or declining?
What risks need immediate attention?
What actions should owners take this week?
The main stakeholders typically include:
Executives: want a concise business story tied to pipeline, revenue, efficiency, and risk
Marketing leaders: want channel and campaign performance in context
Operations or sales leaders: want to understand lead quality, conversion bottlenecks, and follow-up implications
IT and analytics teams: want a governed, repeatable reporting process that reduces manual effort
For these users, the report should deliver clarity in minutes. FineReport helps standardize the briefing format, KPI logic, and distribution workflow. Dora adds the AI assistant layer so leaders can consume reports through chat, summaries, scheduled briefings, and exception notifications instead of waiting for a manual narrative every week.
A practical web analytics report template for executives should be compact but complete. It should cover the performance story from top-line outcome to likely cause to required action.
Executive summary
This section should explain the week in plain business language. It is not a metric dump. It should highlight:
Biggest wins
Biggest losses
Emerging risks
Recommended actions
Report Element: Executive summary narrative. Business value: Gives leadership an immediate understanding of what happened and what matters most. AI use:Dora’s Report Researcher can generate a structured report summary from FineReport outputs, emphasizing major changes, anomalies, and likely business impact.
A strong summary might include:
Revenue grew week over week, but conversion rate declined on paid social landing pages
Organic traffic improved due to better branded search demand
Lead volume remained stable, but qualified lead share fell below target
The immediate action is to review campaign targeting and landing page friction
KPI snapshot
This section should present top-line indicators in a scannable scorecard. Common weekly metrics include:
Sessions
Users or engaged users
Conversions
Revenue
Lead volume
Conversion rate
Cost per lead, if paid acquisition is included
Qualified traffic or qualified leads, if available
Comparisons should include:
Prior week
Prior month equivalent or rolling benchmark
Target, where relevant
Report Element: KPI snapshot scorecard. Business value: Shows whether performance is improving, flat, or deteriorating at a glance. AI use:Dora can explain changes in scorecards, summarize variances, and prepare a scheduled management briefing that highlights only the KPIs outside expected range.
To make this section useful for executives, each KPI should be defined and linked to a business outcome:
Sessions Definition: Total visits during the reporting period. Business value: Indicates top-of-funnel demand and traffic generation. AI use:Dora can explain whether traffic growth came from meaningful channels or low-quality spikes.
Conversions Definition: Desired actions completed, such as form fills, demo requests, purchases, or sign-ups. Business value: Connects web activity to business outcomes. AI use:Dora can summarize where conversion gains or losses happened and point to affected campaigns or landing pages.
Revenue Definition: Revenue attributed to website activity or ecommerce transactions. Business value: Directly links digital performance to financial results. AI use:Dora can produce a chart-based answer explaining revenue shifts and include it in a weekly executive briefing.
Lead volume Definition: Number of leads generated through web channels. Business value: Supports pipeline forecasting and sales planning. AI use:Dora can compare lead volume to target and flag declines that may require campaign or follow-up changes.
Conversion rate Definition: Percentage of visitors who completed the target action. Business value: Measures efficiency of website traffic and user journey. AI use:Dora can identify whether conversion rate changes are broad-based or isolated to specific sources, pages, or devices.
Executives usually do not need every campaign detail, but they do need to know what drove the overall result. This section should summarize the contribution of major channels and campaigns such as:
Organic search
Paid search
Paid social
Email
Referral
Direct
Key campaigns or landing pages
The goal is not to create a media buyer dashboard. The goal is to explain contribution and efficiency.
Report Element: Channel and campaign contribution view. Business value: Helps leaders see where growth is coming from and where budget or focus may need adjustment. AI use:Dora can retrieve the relevant FineReport channel report, explain channel contribution in natural language, and flag channels with declining efficiency or unusual movement.
A good layout may include:
Top channels by sessions, conversions, and revenue
Best and worst performing campaigns
Landing page conversion comparison
Efficiency view such as cost per lead or return by source
Insights and action items
This is where the report becomes useful for leadership. Data without decisions creates extra meeting time.
Report Element: Insights and action log. Business value: Turns reporting into execution by assigning owners and next steps. AI use:Dora’s Daily Briefing Secretary or Risk Alert Officer can generate plain-language insights, push follow-up items to owners, and keep records of unresolved exceptions.
This section should include:
What changed
Why it likely changed
What action is recommended
Who owns the next step
When it should be reviewed
For example:
Paid search conversions fell due to lower brand campaign volume; marketing should review budget pacing by Wednesday
Mobile conversion rate dropped on one landing page; web team should validate page performance and form behavior
Lead volume held steady but sales-qualified rate declined; sales operations should review routing and follow-up speed
A strong web analytics report template should be repeatable, trusted, and easy to update every week. The best templates are built around recurring executive questions, not around whatever data happens to be available.
Start with executive questions
Start with the questions leaders ask every week. This keeps the template focused and prevents metric overload.
Typical executive questions include:
Are we ahead or behind target?
Which channels drove this week’s outcomes?
Are we acquiring the right kind of traffic?
Where are the biggest risks or bottlenecks?
What actions should happen before next week’s review?
When these questions are stable, FineReport can standardize the report structure and operational cockpit views around them. That gives the organization a trusted reporting foundation. Dora can then sit on top of that foundation as an enterprise Data Agent, helping users retrieve answers, summaries, and follow-up actions without manually rebuilding the story each week.
Choose metrics that connect to business outcomes
Executives do not need vanity numbers unless those numbers explain business value. Choose metrics that map to:
Pipeline
Revenue
Lead quality
Retention
Conversion efficiency
Qualified traffic
Avoid overloading the report with secondary engagement metrics unless they explain a business issue. For example, pageviews may matter if they indicate content reach tied to lead generation, but not as a headline KPI on their own.
A practical rule is to separate metrics into three layers:
FineReport can organize these layers into formatted management reports and weekly operational views. Dora can interpret the layers in chat so users can ask follow-up questions like, “Why did conversion rate drop even though traffic increased?”
Standardize formatting and comparisons
Consistency is what makes a weekly briefing useful. Every report should use the same logic for:
Date ranges
Comparison windows
Naming conventions
Benchmarks
Threshold colors
Chart ordering
Definitions
Without this standardization, executives spend time debating what the numbers mean instead of deciding what to do.
Useful formatting practices include:
Keep top KPIs in the same order every week
Use the same channel taxonomy
Show current period beside prior week and target
Use color cautiously for exceptions and changes
Limit each chart to one clear message
FineReport is especially valuable here because it allows teams to build governed templates, formatted reports, and operational cockpits that look consistent across departments. That consistency also improves Dora’s execution because the AI assistant works better when KPI definitions, business terms, and report structures are standardized.
Add commentary that explains why performance changed
A chart alone is not enough for executive briefings. Each key section should include short commentary covering:
What changed
Why it likely changed
Whether it is expected, positive, or risky
What action should happen next
This commentary is where many teams lose time. Analysts often gather numbers quickly but spend hours writing summaries. FineReport provides the trusted report assets and data context. Dora can then generate structured report summaries, chart explanations, and management narratives based on those governed assets.
That means teams move from manually writing every weekly narrative to reviewing and refining an AI-assisted draft. This is a practical use of Agentic BI: controlled AI workflow on top of trusted enterprise reporting, not an ungoverned prompt experiment.
Dashboard and formatting options that save time
The format of your web analytics report template should match how executives consume information. Some teams need a boardroom slide summary. Others need a live dashboard before a recurring leadership meeting.
When to use slides, spreadsheets, or dashboards
Each format has a role:
Slides: best for formal briefing meetings and concise storytelling
Spreadsheets: best for analyst review, audit trails, and working data
Dashboards: best for repeatable access, drill-down, and near real-time visibility
A practical model is:
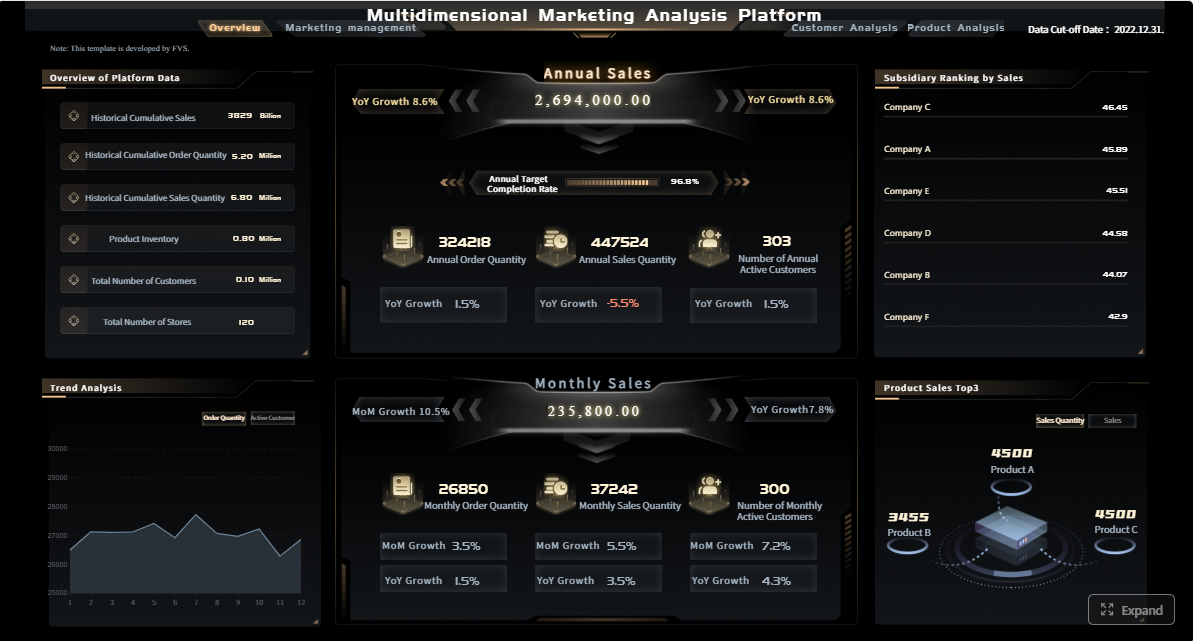
FineReport dashboard or cockpit for live monitoring
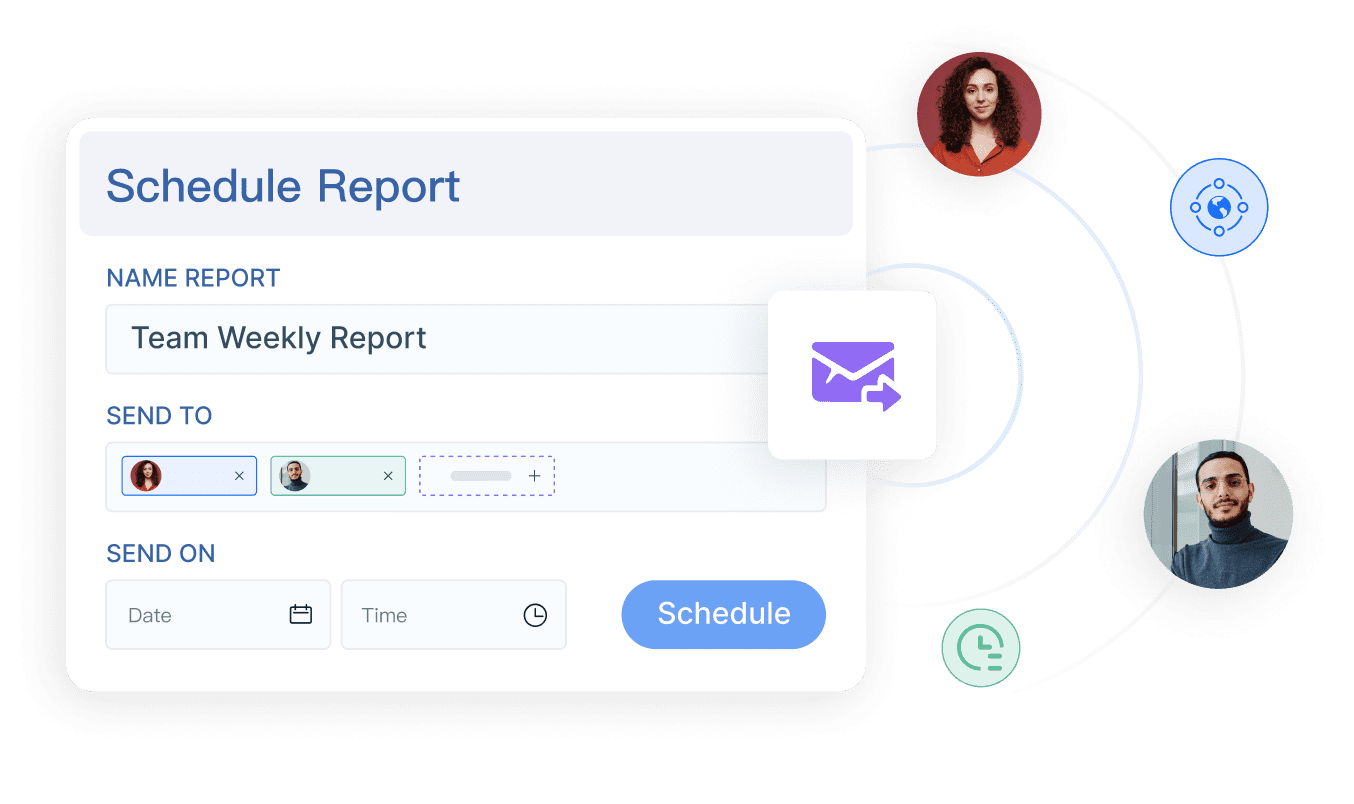
Dora summary pushed through chat or scheduled briefing before the meeting
This gives each audience the right level of detail. Executives get the summary. Analysts get the underlying data. Owners get exception-based follow-up.
Variance tables: for current vs prior period and target
Exception lists: for pages, campaigns, or segments needing follow-up
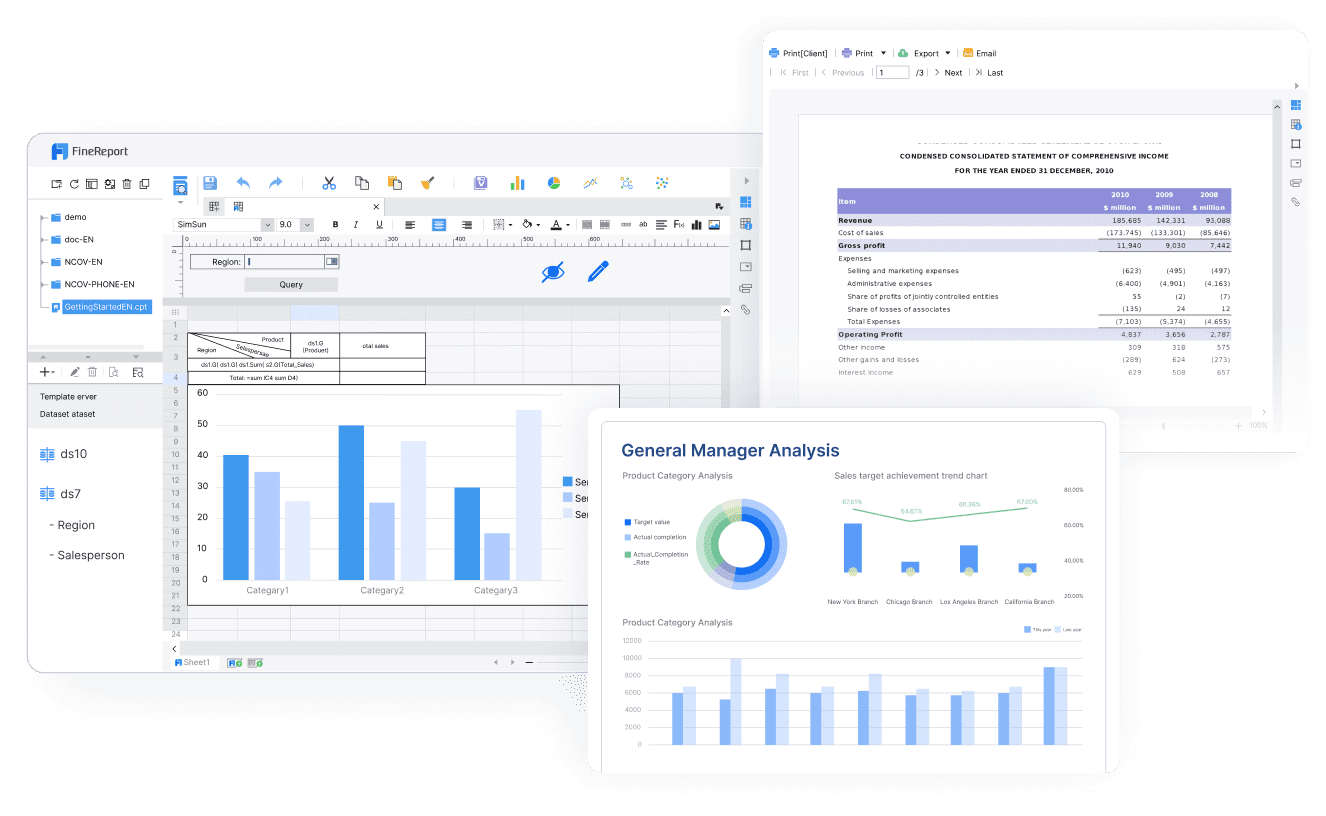
FineReport can build these reusable views as a standardized management cockpit. That matters because once the reporting layout is trusted and adopted, Dora can retrieve the exact dashboard sections, metrics, and exception lists needed for summaries and alerts.
Where free templates can help
Free templates can be helpful starting points, especially for layout inspiration. But before using one for executive weekly briefings, evaluate whether it supports:
Business-outcome KPIs rather than vanity metrics
Clear weekly comparisons
Channel-to-revenue or channel-to-lead context
Space for commentary and action items
Standardized definitions
Governance and permission control
Many free templates are visually useful but operationally incomplete. They may show traffic and engagement but not support the reporting workflow executives need. This is where enterprise teams often outgrow template-only tools and need a reporting foundation like FineReport, plus an AI assistant layer like Dora to make report consumption faster and more actionable.
A weekly report is only valuable if people actually consume it, understand it, and act on it. This is where Dora adds a major upgrade to the traditional web analytics report template.
Dora should be positioned here as an enterprise Data Agent on top of trusted FineReport assets. FineReport builds the governed report, semantic layer, KPI definitions, and operational cockpit. Dora turns that reporting foundation into a scenario-specific AI assistant for weekly executive briefings.
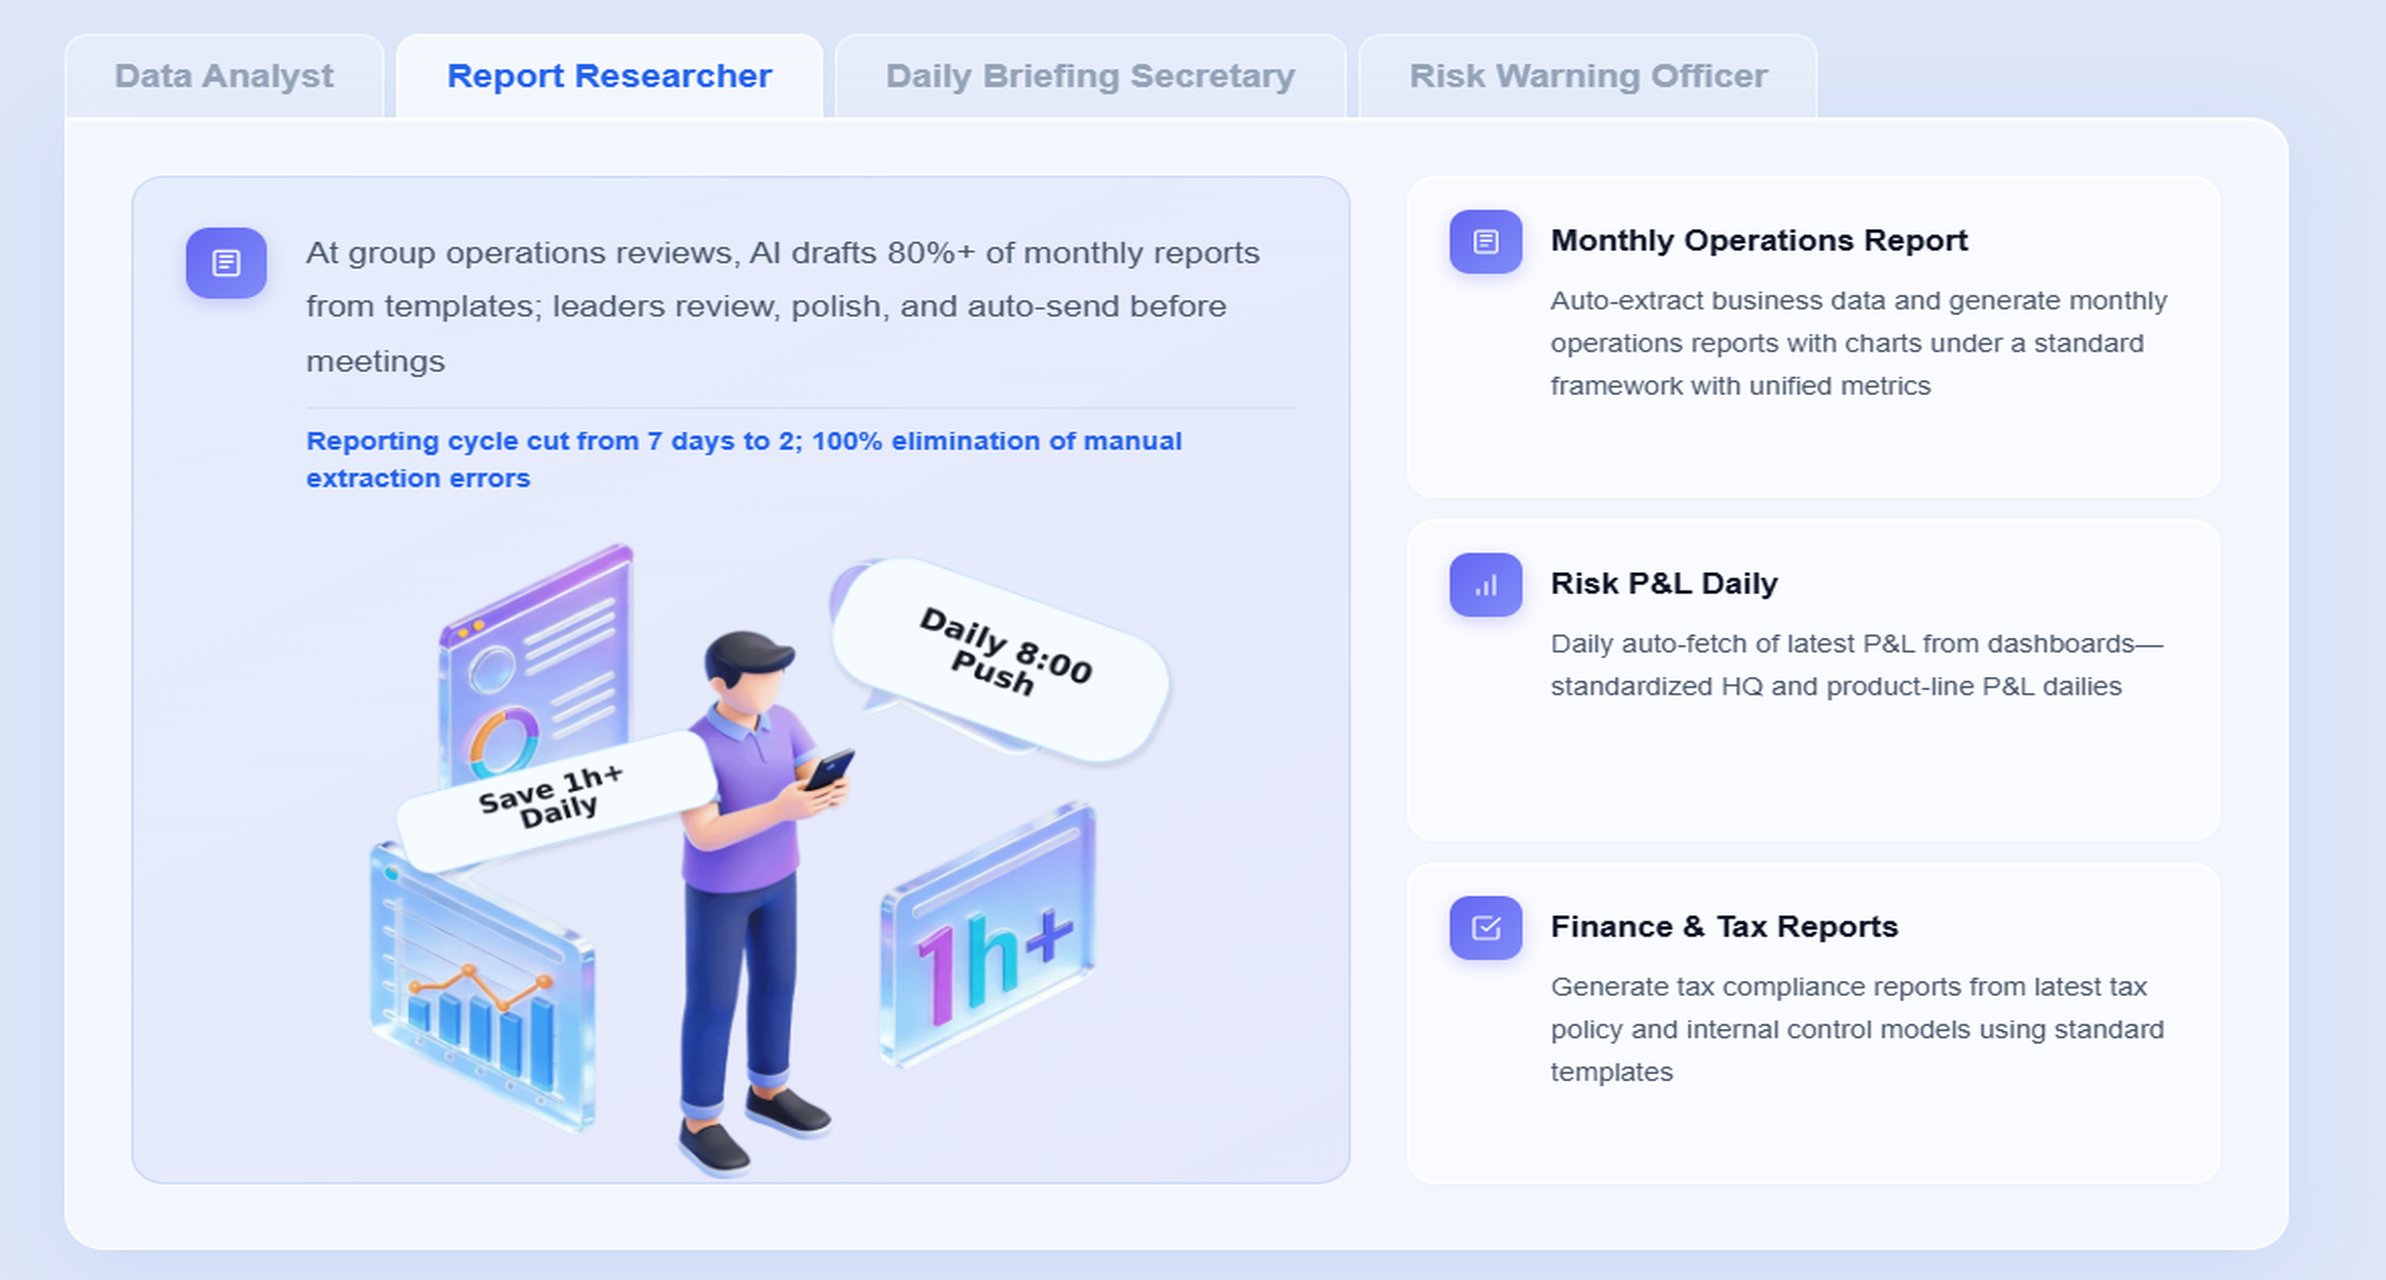
For this scenario, the most relevant Doradigital employee is the Daily Briefing Secretary, often supported by the Report Researcher.
A chat-style example for an executive weekly briefing
An executive or marketing leader might ask:
“Summarize this week’s web analytics report, highlight any abnormal changes in conversions or revenue, compare major channels with last week, and list the owners who need follow-up.”
This is not a generic chatbot use case. It is a governed AI workflow using trusted report assets, KPI rules, and access permissions.
How the AI workflow works
A practical 6-step Dora workflow for this scenario looks like this:
Retrieve trusted FineReport report or operational cockpit data Dora accesses the approved weekly web analytics report, executive cockpit, and supporting channel tables already built in FineReport.
Understand KPI definitions, report templates, filters, and business terms Dora uses the governed semantic layer to interpret terms like sessions, qualified leads, conversion rate, revenue attribution, and target thresholds correctly.
Generate a structured report summary through chat Dora creates a concise executive narrative covering wins, losses, risks, channel contribution, and trend interpretation.
Detect exceptions and unusual changes Dora checks for threshold breaches such as conversion declines, landing page underperformance, channel efficiency drops, or revenue variance outside expected range.
Push summaries, alerts, and suggested actions to responsible users
The Daily Briefing Secretary can send scheduled weekly summaries, while the Risk Alert Officer can notify channel owners or web owners about anomalies requiring review.
Create follow-up records and recurring review summaries Dora can help maintain a record of what issues were flagged, what actions were recommended, and what should be reviewed in the next briefing.
Why FineReport matters to AI reporting quality
AI reporting only works well when the reporting foundation is trustworthy. FineReport provides that foundation by standardizing:
Without this governed layer, AI outputs become less controllable and harder to trust. With FineReport in place, Dora can produce more relevant, auditable, and stable workflow execution.
Dora improves report consumption in several concrete ways:
Enables natural-language query over trusted reporting assets
Delivers chat-based AI assistant access to weekly report content
Retrieves reports, cockpits, metrics, and exception lists from FineReport
Generates structured report summaries, chart explanations, and management narratives
Supports scheduled summaries, daily or weekly briefings, and push notifications
Powers digital employees for recurring reporting workflows
Uses Skills-based execution for more controllable and auditable AI workflows
Fits enterprises better through permissions, semantic rules, KPI governance, and report templates
Compared with raw prompt-only agents, this model offers better landing capability for real enterprise reporting because it is grounded in governed data assets and repeatable workflow design. It also helps reduce token waste, improve response speed, and increase workflow stability by narrowing the AI task to controlled reporting scenarios rather than open-ended prompting.
For executives, that means Dora is not an AI experiment. It is a practical AI digital employee for recurring reporting work such as weekly web performance summaries, campaign exception alerts, and owner-based follow-up.
For IT and analytics teams, it changes the role from manually producing every report summary to improving data connections, semantic rules, permissions, templates, and reusable agent Skills.
For business users, it means getting timely summaries and chart-based answers without chasing analysts for every update.
Reporting best practices and common mistakes to avoid
The best web analytics report template is not just well designed once. It is managed over time for clarity, trust, and repeatability.
Standardize KPI definitions, business terms, and exception rules before scaling Dora workflows
This improves summary quality and makes AI outputs more consistent.
Preserve permission governance so AI outputs respect FineReport access boundaries
Not every executive, manager, or campaign owner should see the same detail level.
Common reporting mistakes
Common issues include:
Metric overload
Unexplained variance
Inconsistent time frames
Weak channel attribution context
No clear recommendation
No assigned follow-up owner
AI-specific mistakes include:
Asking AI to summarize ungoverned or inconsistent reports
Expecting reliable narratives without data quality controls
Automating every report immediately instead of starting with a high-value recurring briefing
A good rollout approach is to start with one recurring executive web analytics briefing, validate the template and summary logic, then expand to campaign reviews, lead quality reports, or monthly management reports.
Example workflow for creating a repeatable weekly briefing
A repeatable web analytics report template depends on workflow discipline as much as layout design. A simple enterprise-ready process looks like this:
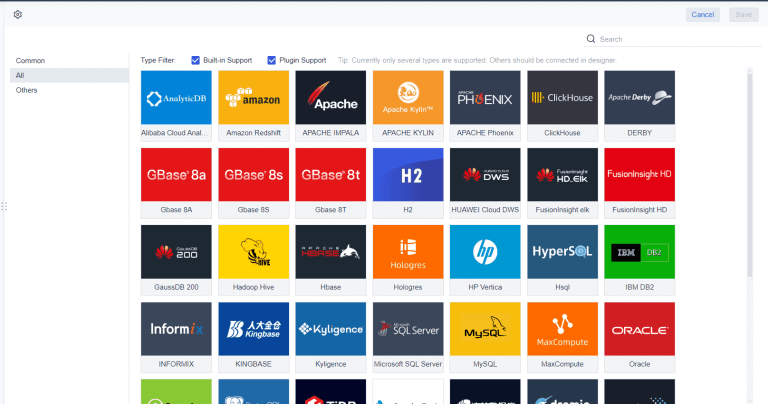
Gather data from analytics, CRM, ad platforms, and revenue systems FineReport helps consolidate reporting inputs into a trusted reporting structure.
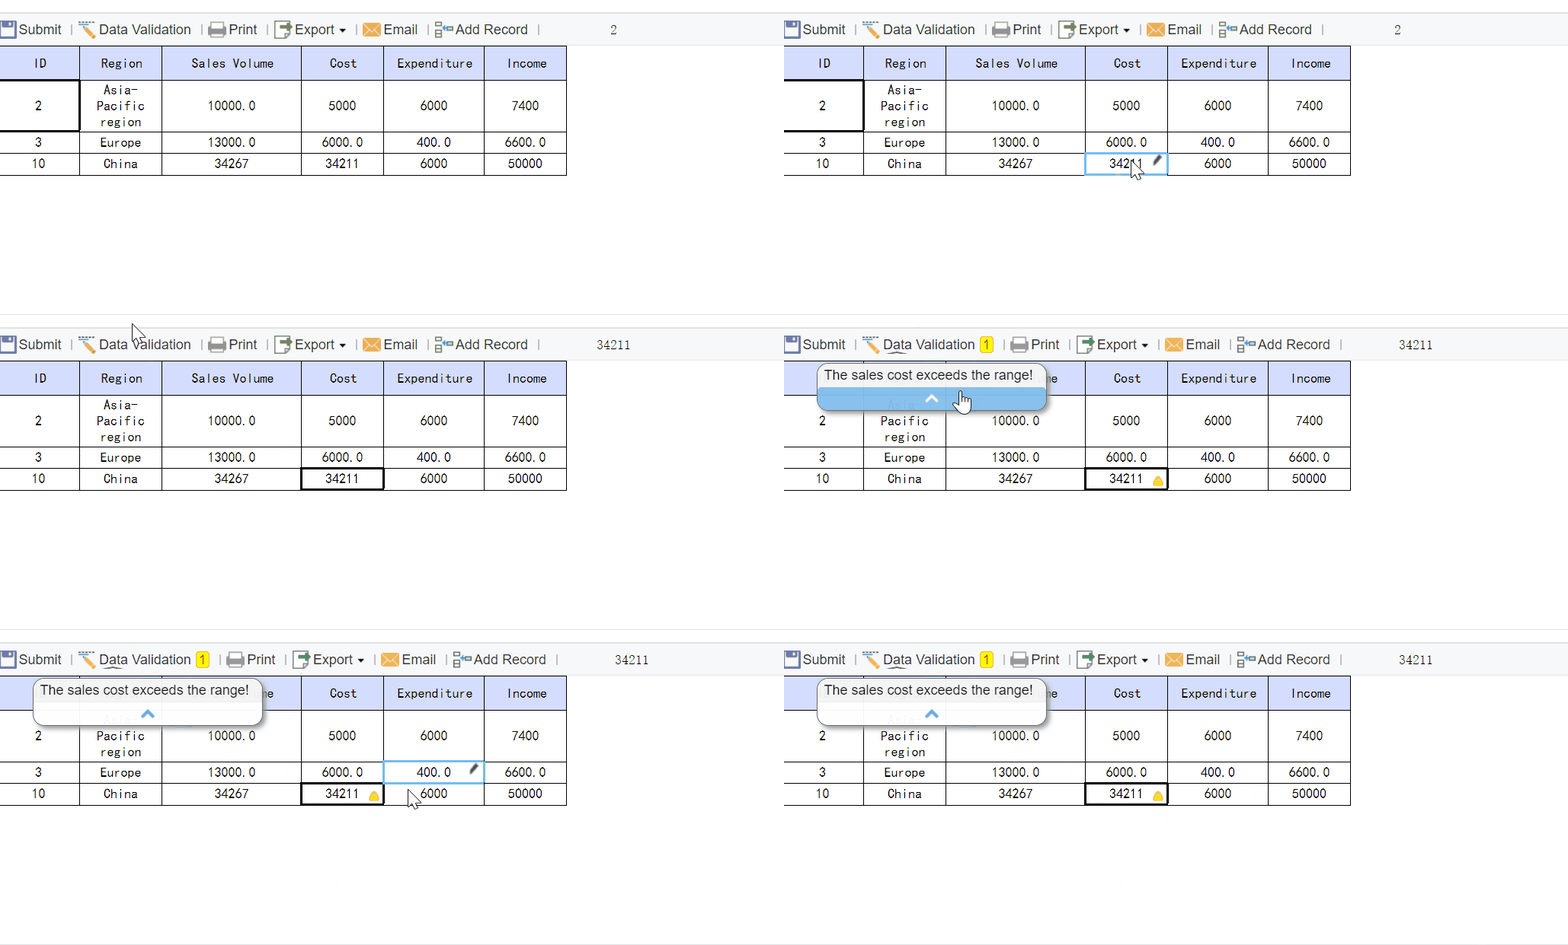
Validate numbers and annotate unusual movements before sharing
Teams review outliers, tracking changes, campaign launches, or known operational issues.
Publish the report on a fixed schedule
The weekly rhythm should be predictable so leaders know when to expect the briefing.
Assign clear owners for follow-up actions
Insights should not end as commentary. Each issue should have an accountable owner.
Archive prior reports for trend analysis and quarterly review
Historical reporting improves context and helps executives spot recurring patterns.
With Dora added to this workflow, the process becomes more efficient:
The Daily Briefing Secretary can generate scheduled weekly summaries
The Report Researcher can answer follow-up questions on demand
The Risk Alert Officer can push exception alerts to responsible users
Teams can maintain a stronger link between reporting, interpretation, and action
Building this manually is complex. FineReport helps teams standardize trusted reports, operational cockpits, templates, and reporting workflows. Dora turns those assets into an AI assistant that can answer report questions in chat, generate structured summaries, push scheduled briefings, monitor exceptions, and follow up with responsible owners.
For executive weekly web analytics reporting, this combination is especially practical:
FineReport organizes KPI scorecards, channel views, and exception tables into reusable executive formats
Dora adds natural-language access to those trusted assets
Dora helps convert report consumption into summaries, alerts, and action follow-up
FineReport + Dora is not only a reporting upgrade; it is a practical fourth-generation Agentic BI path. FineReport provides governed reports and operational cockpits. Dora provides the AI assistant layer for scenario execution, with more controlled Skills, lower token waste, faster execution paths, and more stable workflows than prompt-only agents.
Get Ready-to-Use Dashboard Templates in Fine Gallery
The strongest Dora pitch is scenario + product + service: FineReport provides the trusted reporting foundation, Dora provides the AI digital employee, and implementation service connects data, governance, semantic setup, Skills, report templates, permissions, and rollout.
If your team wants to make weekly executive reporting faster, more consistent, and more actionable, this is the practical path: build a governed web analytics reporting foundation first, then upgrade report consumption with an enterprise Data Agent.
It should include an executive summary, a KPI snapshot, major trends, key exceptions, and clear next actions with owners. The goal is to help leaders understand performance quickly and decide what to do next.
The most useful KPIs are usually sessions, conversions, revenue, lead volume, conversion rate, and cost efficiency metrics when paid channels are involved. These measures connect website performance to business outcomes instead of showing traffic alone.
An executive report is shorter, more focused, and built around business impact, risks, and actions. A detailed analyst report goes deeper into segments, attribution, and technical analysis.
FineReport provides the governed report structure and trusted KPI views, while Dora adds AI-powered summaries, scheduled briefings, and exception alerts. This helps teams reduce manual reporting work and deliver faster insights to leadership.
For most leadership teams, a weekly cadence is ideal because it balances timeliness with enough data to spot meaningful changes. Critical exceptions can also be pushed in real time when immediate action is needed.
Product Trial
FineReport
Pixel-perfect reports · Interactive dashboards · Easy data entry · Digital twins