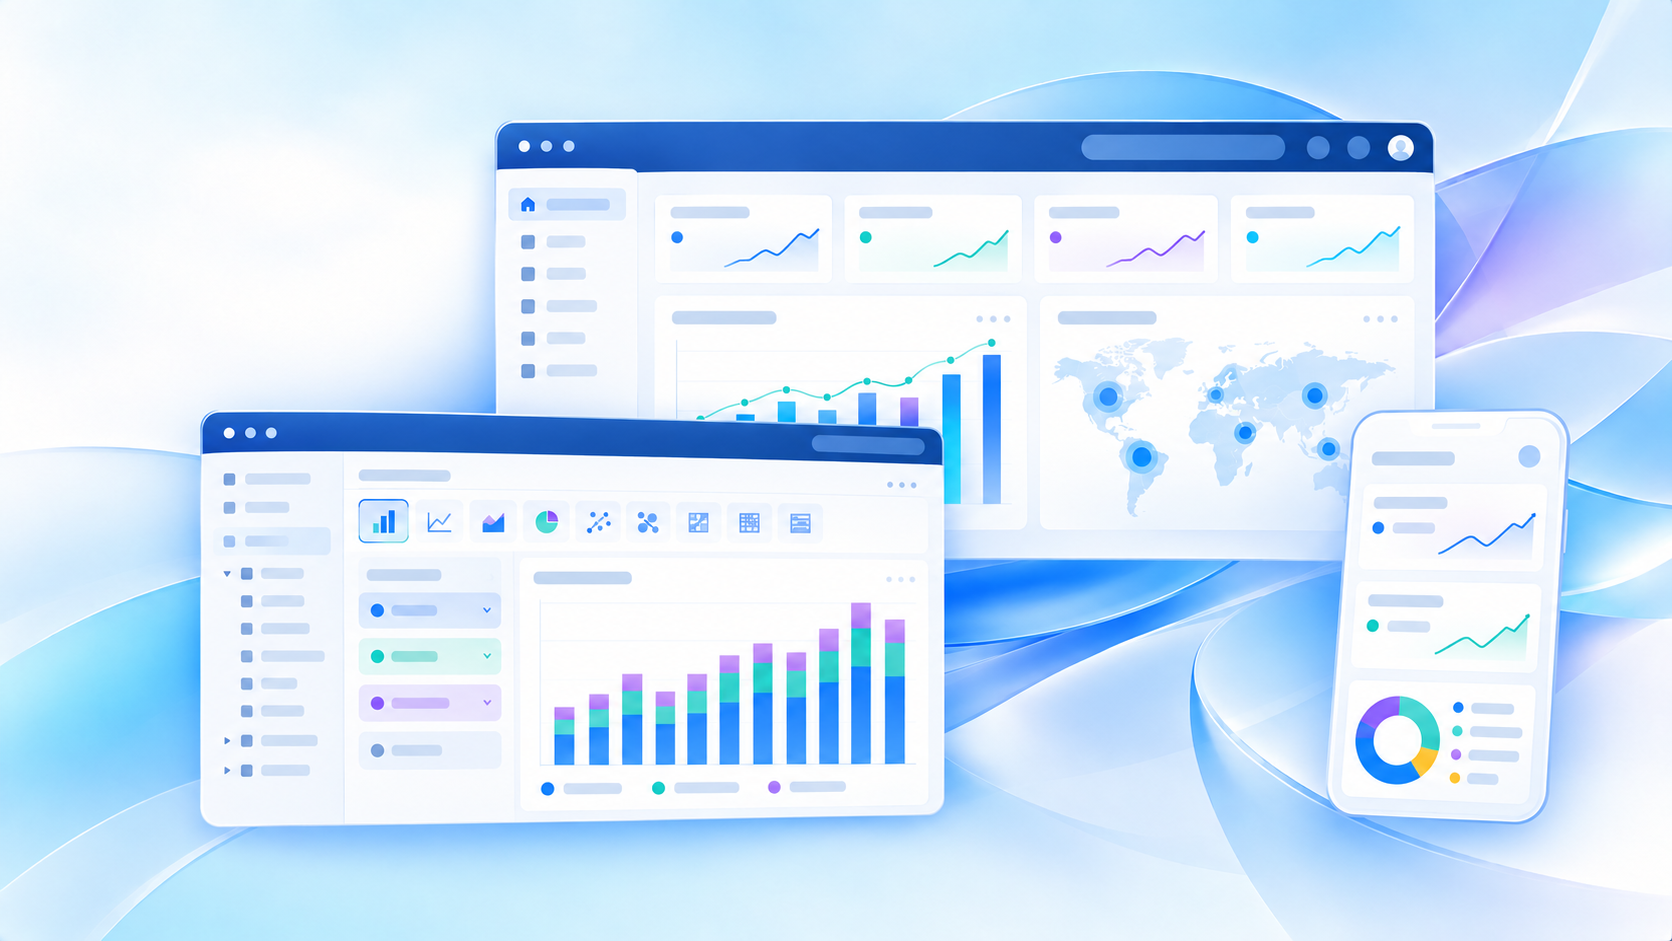
If you are searching for ecommerce data analytics software, you are probably trying to solve a practical problem: how to turn store, marketing, customer, and retail channel data into decisions that improve revenue, margin, retention, and operational efficiency.
For DTC brands, marketplace sellers, omnichannel retailers, and agencies, the challenge is rarely a lack of data. It is usually one of these:
Too many disconnected tools
Unclear attribution across channels
Weak visibility into repeat purchase behavior
Limited insight into inventory, marketplace, and retail performance
Dashboards that look good but do not help teams act
This guide compares 10 ecommerce analytics tools by use case, not just by feature count. That matters because the right tool for a Shopify startup is often very different from the right tool for an enterprise retail team with marketplace feeds, POS data, warehouse systems, and scheduled reporting requirements.
Best for startups: GA4 or Hotjar, depending on whether you need traffic metrics or UX insight
Best for scaling brands: Triple Whale or Mixpanel
Best for enterprise retail: Looker, Adobe Analytics, or FineReport
Best for marketplaces: DataHawk
Best for buyer behavior analysis: Mixpanel or Hotjar
The best way to use this guide is to start with your primary use case. Do not chase the longest feature list if your real need is simply better attribution, stronger cohort analysis, or more reliable cross-channel reporting.
What ecommerce analytics is and how to choose the right tool
Ecommerce analytics is the practice of collecting, analyzing, and presenting data from your online store and connected channels to answer business questions such as:
Which channels drive profitable customers?
Why are shoppers dropping off before purchase?
Which products increase margin and repeat purchases?
How is CAC changing by campaign, market, or channel?
Which customer segments are most valuable over time?
Where are inventory, fulfillment, or return issues affecting growth?
A simple definition of ecommerce analytics and the business questions it should answer
A good ecommerce analytics system should help you answer questions in five areas:
Acquisition: Where customers come from and what it costs
Conversion: What helps or hurts purchase completion
Retention: Who returns, repurchases, or churns
Merchandising: Which products, bundles, and categories perform best
Operations: How inventory, shipping, refunds, and supply chain affect outcomes
The difference between basic reporting, BI, product analytics, and retail-focused intelligence platforms
These categories are often mixed together, but they serve different jobs.
Basic reporting
Basic reporting tools focus on standard dashboards and KPI summaries. They are useful for quick visibility into revenue, orders, traffic, and campaign performance.
Best for:
Smaller stores
Teams needing fast setup
Weekly or monthly reviews
BI platforms
Business intelligence tools combine data from many systems and allow more flexible analysis, custom dashboards, and enterprise reporting.
Best for:
Finance and operations teams
Omnichannel retail organizations
Businesses with data warehouses or multiple source systems
Product analytics
Product analytics tools focus on events, funnels, user paths, cohorts, and retention behavior.
Best for:
Conversion optimization teams
Growth teams
Stores with complex customer journeys
Retail-focused intelligence platforms
These tools are built for ecommerce and retail use cases such as marketplace performance, inventory analysis, retail partner reporting, and omnichannel sales visibility.
Best for:
Sellers on Amazon and Walmart
Consumer brands with retail distribution
Teams balancing ecommerce and supply chain decisions
Core evaluation criteria: integrations, data freshness, identity resolution, ease of use, customization, and total cost
When comparing ecommerce data analytics software, use these six filters:
1. Integrations
Can the platform connect to your store, ad platforms, CRM, email tools, POS, and warehouse?
2. Data freshness
Do you need near-real-time monitoring, or is daily refresh enough?
3. Identity resolution
Can the tool help connect anonymous visitors, known customers, and repeat buyers across touchpoints?
4. Ease of use
Who will maintain it: founders, marketers, analysts, or IT?
5. Customization
Can you tailor dashboards, KPIs, reports, and filters to your business model?
6. Total cost
Look beyond subscription price. Include:
Implementation time
Consultant support
Data engineering work
Training
Ongoing maintenance
Common mistakes to avoid when comparing free and paid options
Common buying mistakes include:
Choosing a free tool that cannot scale to cross-channel analysis
Overbuying enterprise software before the team has clear analytics processes
Confusing web analytics with full ecommerce business intelligence
Underestimating the work required to clean and unify data
A free analytics tool can be enough for basic visibility. But if your teams need investor reporting, marketplace performance rollups, regional sales packs, operational reporting, or printable scheduled reports, the cheapest option often becomes expensive later.
9 tools compared by use case
Best for all-in-one ecommerce performance reporting
These tools suit merchants who want sales, marketing, and customer KPIs in one place.
1. FineReport
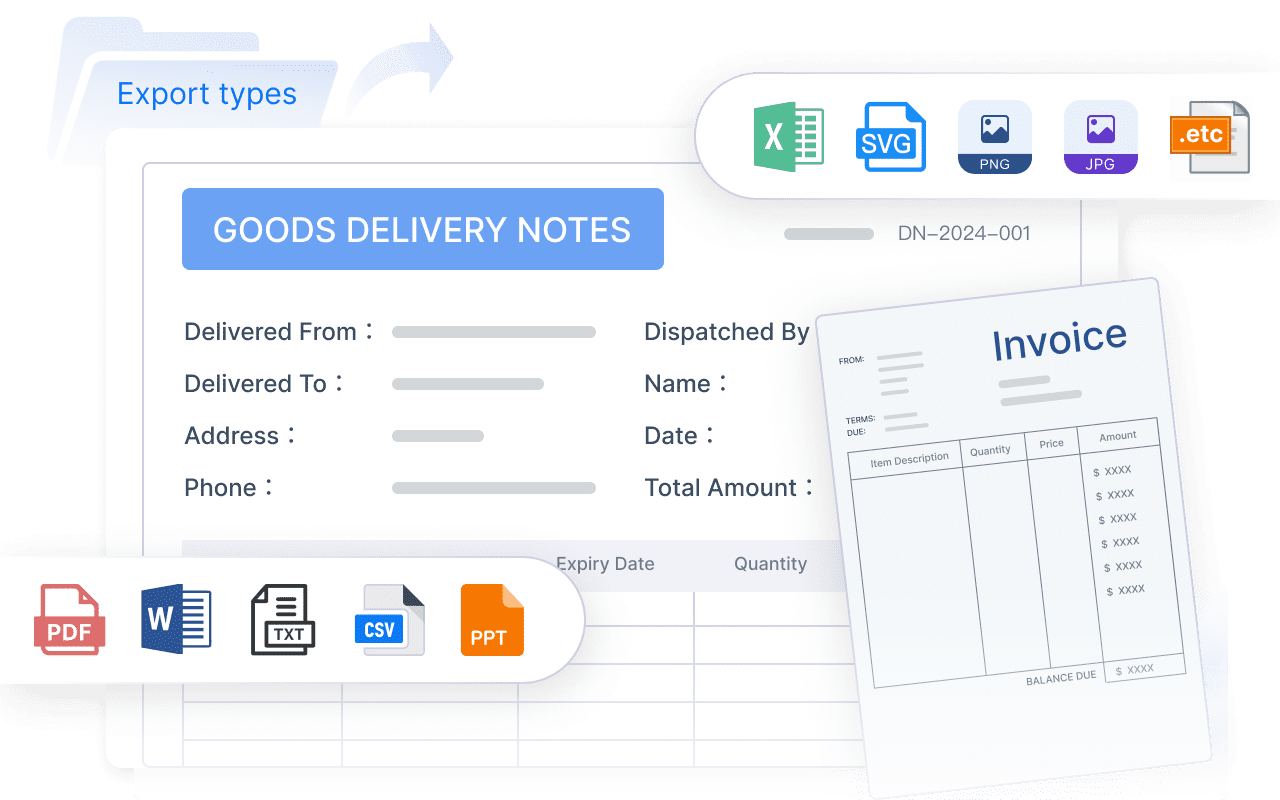
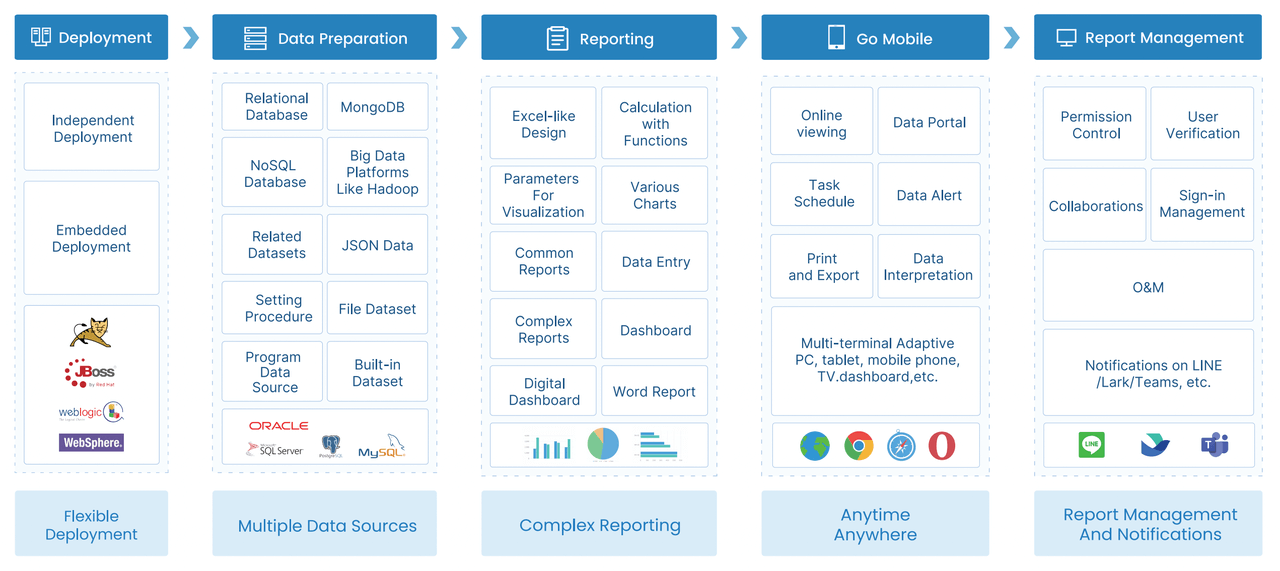
FineReport is a strong fit when ecommerce reporting needs go beyond dashboards into structured business reporting, scheduled distribution, parameterized analysis, and operational workflows.
Strengths
Supports dashboard and report integration
Well suited to pixel-perfect, paginated, and printable reporting
Useful for finance, operations, logistics, and management packs
Supports parameter queries and scheduled report distribution
Can support form-based workflows and data entry scenarios where reporting and action need to connect
Limitations
Not positioned as a pure product analytics tool
Best value appears when teams need formal reporting, recurring reporting operations, or enterprise governance
May need to be paired with another reporting stack for executive or finance use
Ideal team size
Marketplace teams
Brands with Amazon-heavy revenue mix
Pricing expectations
Mid to high
8. Supermetrics
Supermetrics is more of a data pipeline layer than a standalone analytics destination, but it is valuable for pulling channel data into sheets, dashboards, or BI environments.
Some enterprise and BI tools support more advanced forecasting or analytical extensions, but availability varies by implementation and data model. If forecasting is central to your use case, validate it in a live product demo rather than assuming it is built in.
Scheduled reporting
This is where many ecommerce teams discover a gap. Dashboards are useful, but executives, finance teams, operations teams, and retail partners often still need recurring reports.
The best value tool is not always the cheapest. It is the one that helps your team make better decisions consistently without creating reporting bottlenecks.
Which tool is best for your business stage
Best choice for new brands that need quick wins and simple reporting
For early-stage brands, Google Analytics 4 is usually the practical starting point. Pair it with Hotjar if you need quick visibility into user friction and checkout behavior.
Choose this route if you need:
Fast setup
Basic acquisition and conversion visibility
Minimal upfront cost
Best choice for growth-stage teams optimizing CAC, LTV, and repeat purchase rate
For growth-stage teams, Triple Whale and Mixpanel are often the strongest options depending on the core question.
Choose Triple Whale if you need unified performance reporting and attribution-oriented ecommerce visibility.
Choose Mixpanel if you need stronger funnel, cohort, and retention analysis.
Best choice for enterprise ecommerce and retail organizations with complex data stacks
For enterprise teams, the strongest fit depends on the type of complexity:
Looker for warehouse-led BI
Adobe Analytics for advanced journey analysis in large digital ecosystems
This distinction matters. Many enterprise ecommerce organizations need both analytical dashboards and formal business reports. Dashboards alone may not satisfy finance reviews, regional operating packs, inventory control reporting, or management reporting cycles.
Best choice for teams asking for practical resources and a clear next step before switching tools
If you are not ready to replace your analytics stack immediately, shortlist tools by the problem you need to solve first:
Better buyer behavior visibility: Mixpanel or Hotjar
2. Separate behavioral analytics from business reporting
A funnel analysis tool and an executive reporting platform are not the same thing. Many ecommerce teams need both.
3. Validate scheduled reporting needs early
If leadership, finance, or operations rely on recurring reports, test report scheduling, access control, printable formats, and parameterized filtering before purchase.
4. Check how easily the tool handles multichannel complexity
A tool may work well for one Shopify store but struggle when you add:
Amazon
Walmart
POS
ERP
warehouse data
regional entities
5. Plan for adoption, not just implementation
The best ecommerce data analytics software is the one your teams actually use. Favor clarity, consistency, and reporting workflows that match how stakeholders consume information.
When FineReport is a good fit for ecommerce analytics
Tools like Tableau, Power BI, Looker, GA4, and Mixpanel are widely used for visualization and analysis, but teams with complex reporting workflows may also need a dedicated enterprise reporting platform like FineReport.
FineReport is especially relevant when your ecommerce analytics requirements include more than exploratory dashboards, such as:
Pixel-perfect report design for board packs, finance statements, and formal operating reports
Paginated and printable reports for management reviews and operational distribution
Parameter queries for filtering by store, brand, channel, region, date, or category
Scheduled reporting and automated distribution to recurring stakeholder groups
Dashboard and report integration so users can move from KPI views to detailed reports
Data entry and form-based workflows when teams need to submit or update operational information
Sales, logistics, and management dashboards tied to printable detail reports
Get Ready-to-Use Dashboard and Report Templates in Fine Gallery
A practical way to think about FineReport is this: if your ecommerce team needs dashboards plus formal reporting operations, it is worth evaluating. It is not a replacement for every specialized analytics tool, but it can be a strong fit where reporting quality, scheduled delivery, cross-functional reporting, and operational governance matter.
Final verdict and shortlist recommendations
There is no single best ecommerce data analytics software for every business. The right choice depends on what you are trying to improve.
The top pick overall and who should choose it
Triple Whale is a strong overall pick for many scaling DTC brands that want unified ecommerce performance visibility without a heavy BI build.
The best alternative if buyer behavior analysis is the priority
Mixpanel is the best alternative when behavior, funnel analysis, cohort tracking, and retention are the main priorities.
Choose it if you want:
Event-based analysis
Customer journey visibility
Better understanding of repeat purchase and drop-off patterns
The best option for marketplace analytics and retail data complexity
DataHawk is a strong fit for marketplace-focused teams. FineReport is a strong fit when that marketplace complexity also needs to be operationalized into structured enterprise reporting.
Formal management, finance, or operations reporting
The best value choice among free and paid tools
Google Analytics 4 remains the best value starting point for basic ecommerce analytics. Add Hotjar if you need UX insight without major extra cost.
If your business is growing beyond simple dashboards and needs more controlled, enterprise-ready reporting, FineReport is worth adding to the shortlist.
Ecommerce data analytics software helps businesses combine store, marketing, customer, and operational data to understand performance and make better decisions. Teams use it to track revenue, conversion, retention, attribution, inventory, and channel profitability.
Start with your main use case, such as attribution, buyer behavior analysis, marketplace reporting, or enterprise BI. The right choice depends on your business size, data sources, reporting complexity, and whether you need fast setup or deeper customization.
Shopify-focused and scaling DTC brands often look at tools like Triple Whale for performance reporting or Mixpanel for funnels and retention analysis. If budget matters, GA4 can cover core ecommerce tracking, while Hotjar adds UX insight.
The most useful tools track revenue, conversion rate, average order value, repeat purchase rate, customer acquisition cost, return on ad spend, and customer lifetime value. Many teams also need visibility into cart abandonment, product performance, refunds, and inventory health.
Yes, stronger platforms can unify data from marketplaces, POS systems, warehouses, and ecommerce stores for a fuller view of operations. That makes it easier to spot stock issues, compare channel performance, and improve forecasting and replenishment decisions.
Product Trial
FineReport
Pixel-perfect reports · Interactive dashboards · Easy data entry · Digital twins


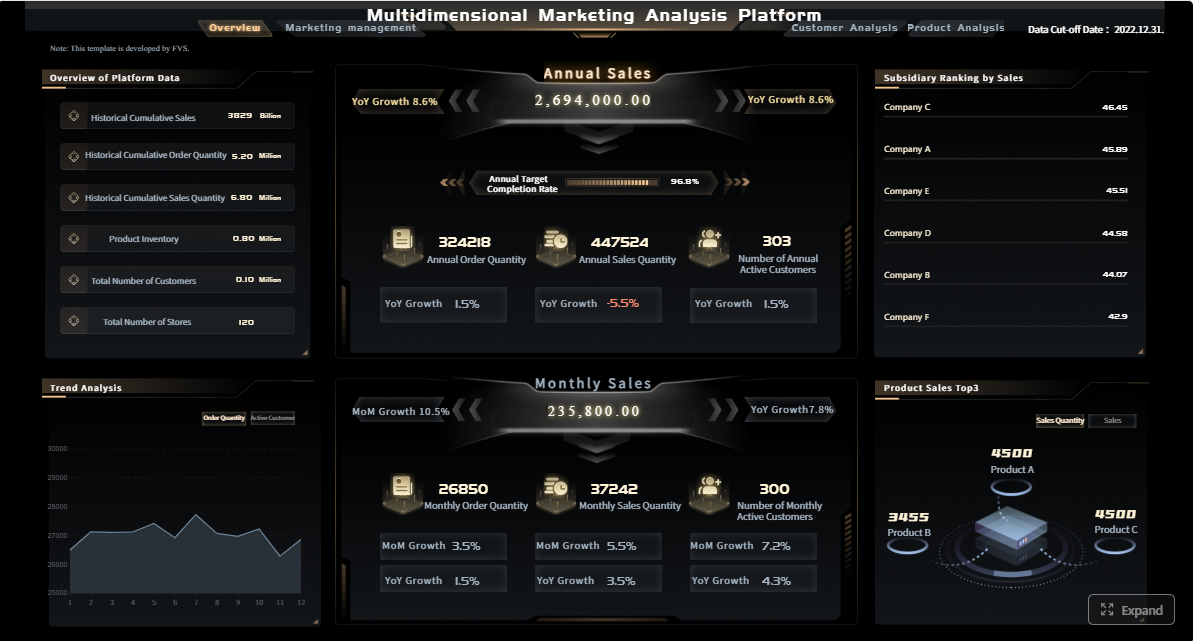
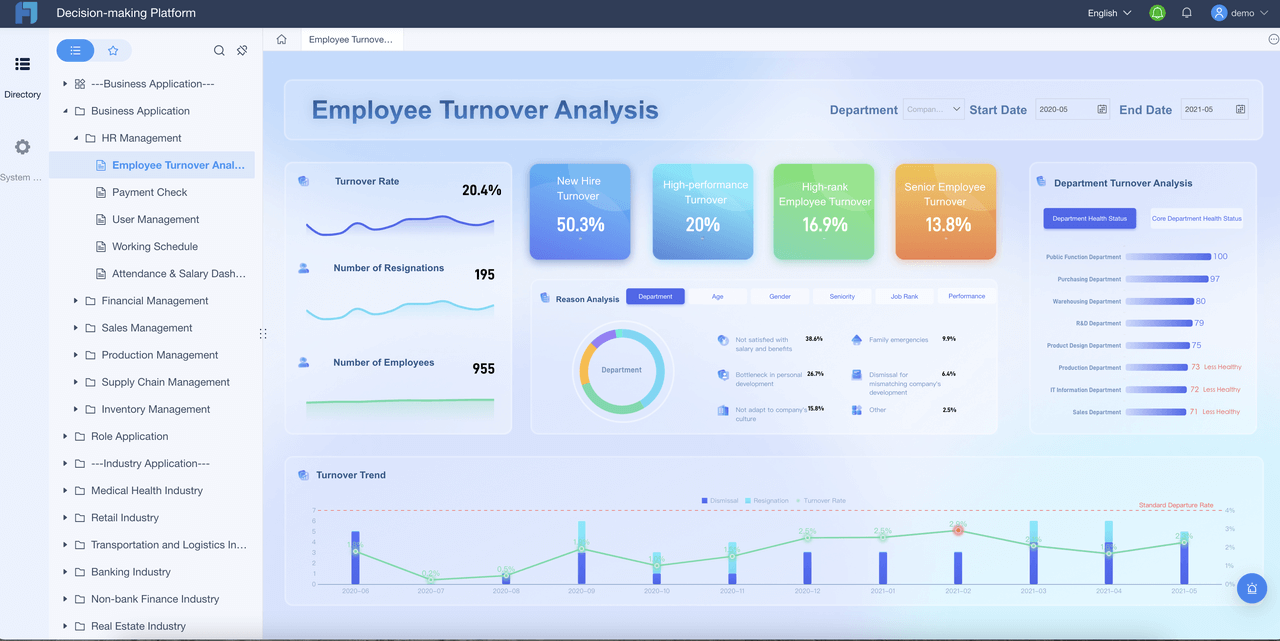
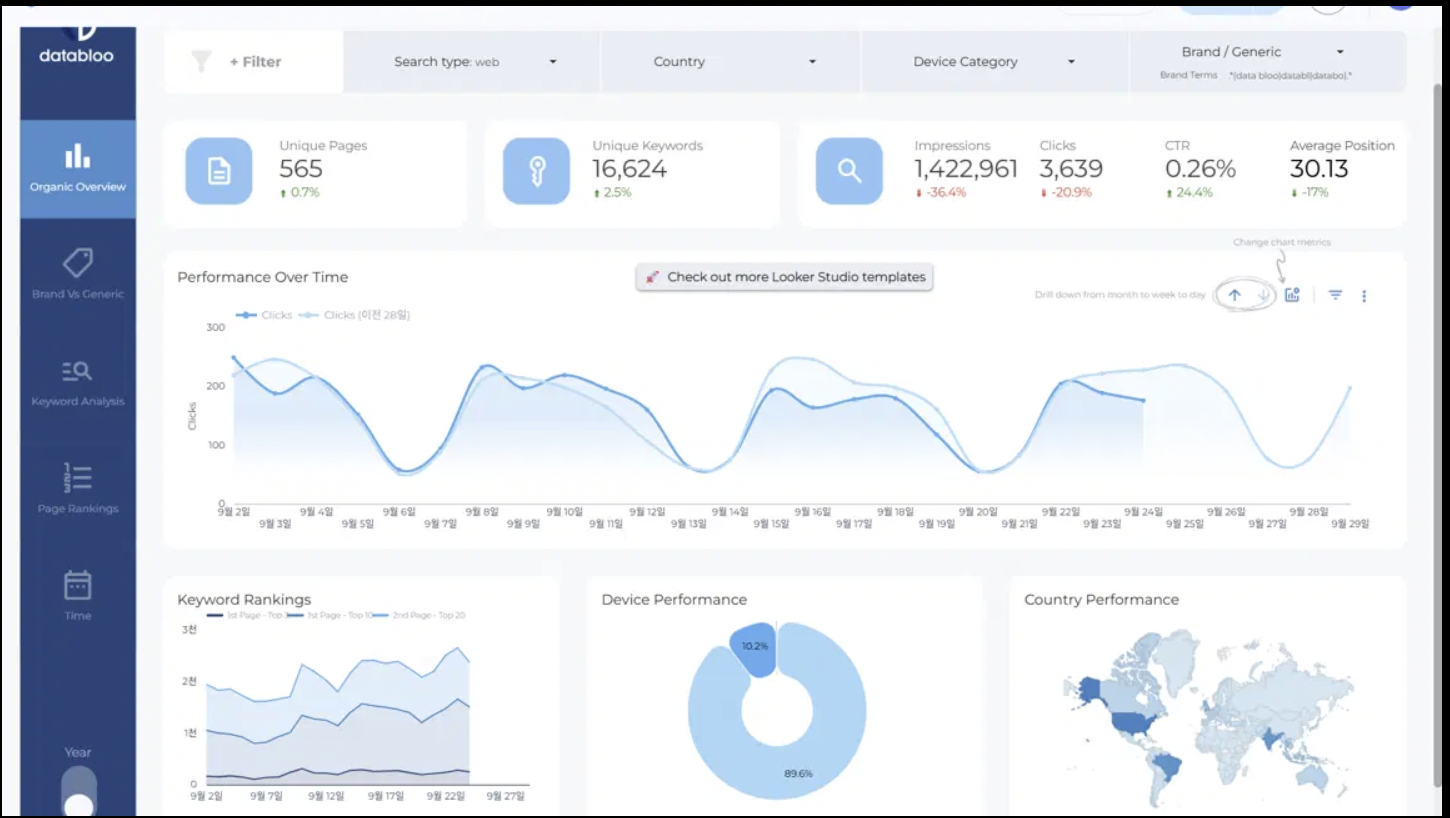 Looker fits businesses that want a more robust BI layer on top of ecommerce and warehouse data.
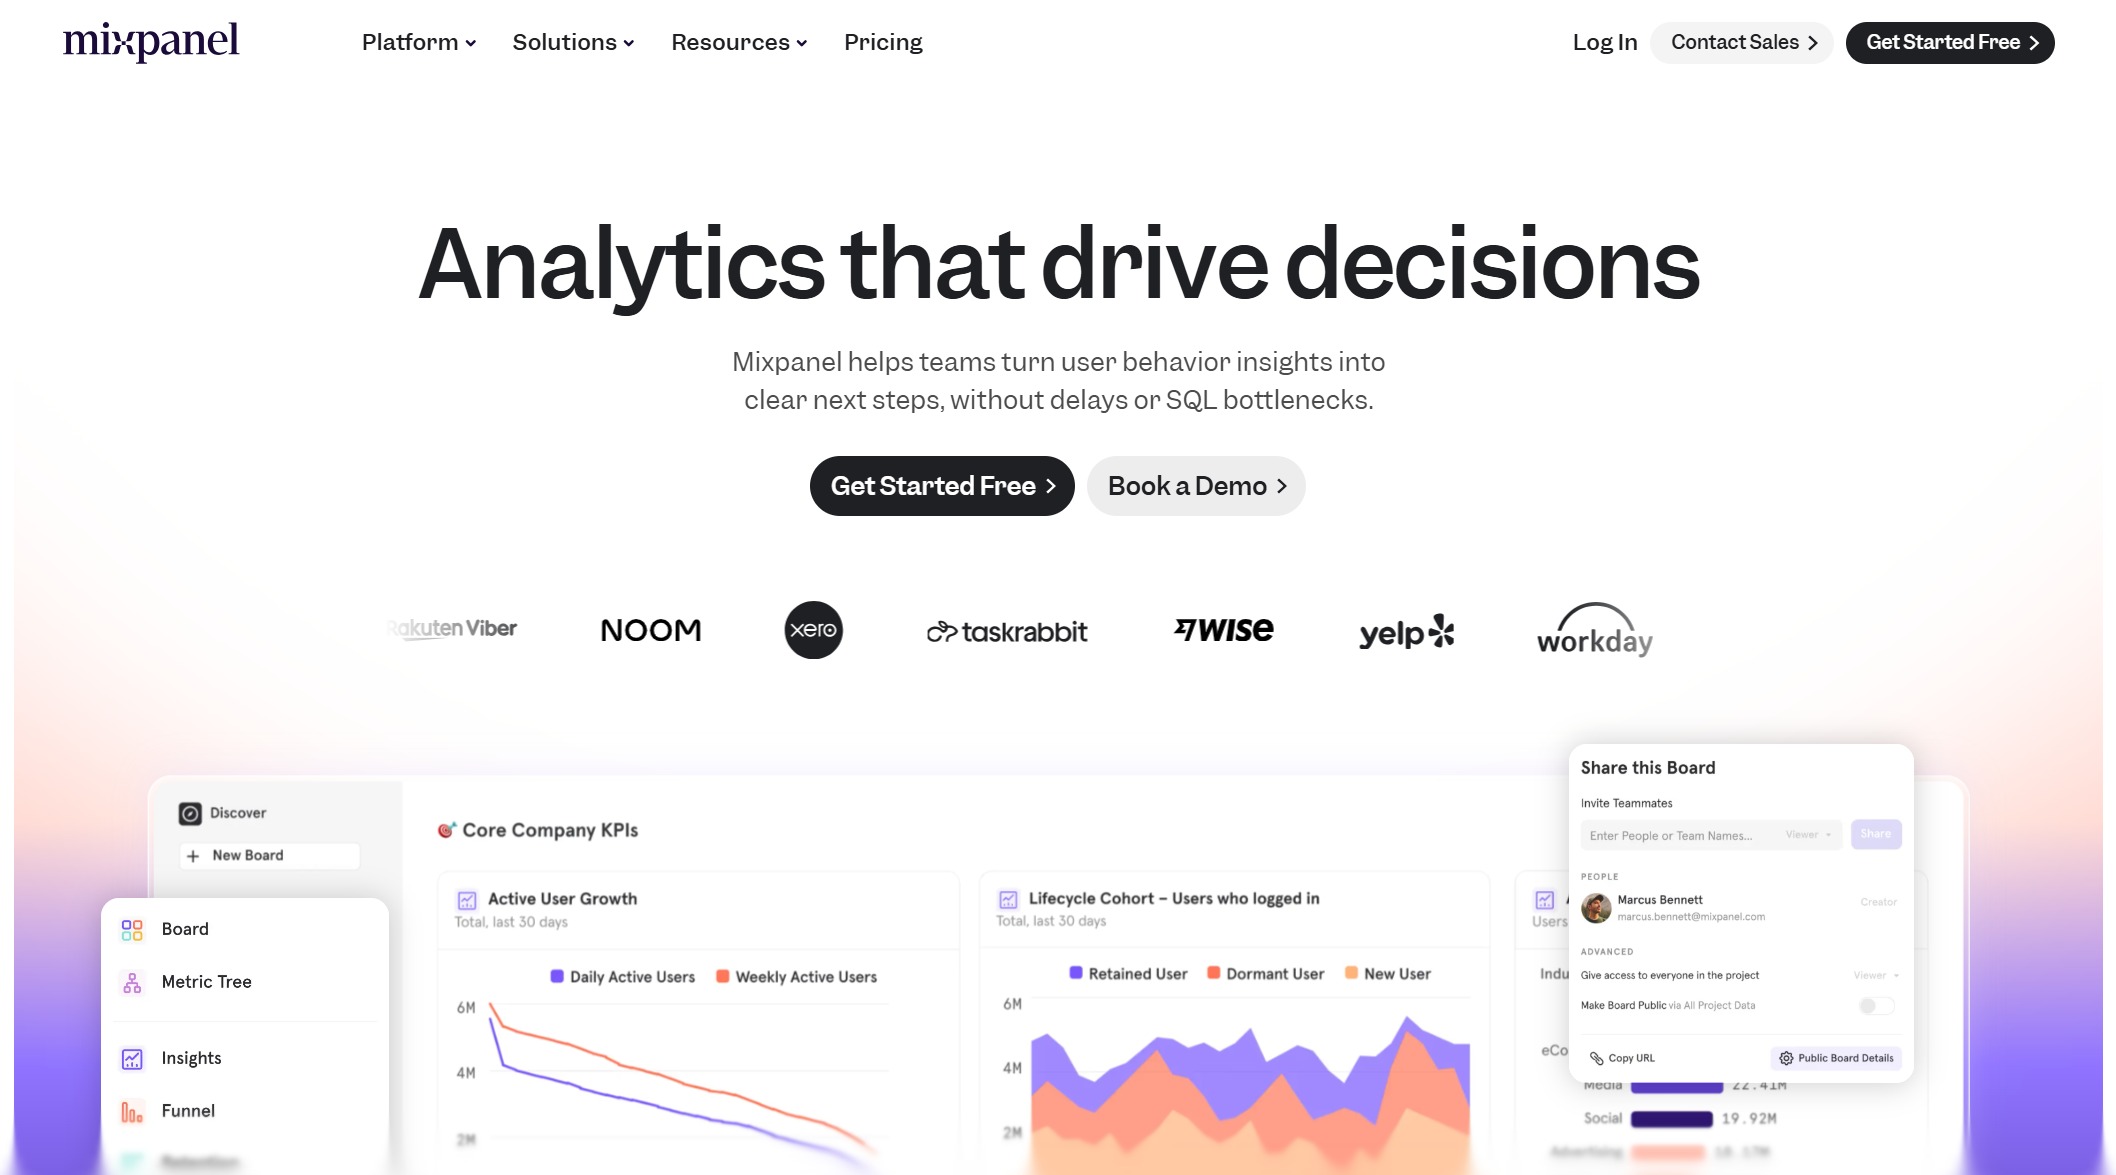 Mixpanel is a strong option for event-based ecommerce analysis.
 Hotjar helps teams understand what shoppers are doing visually.
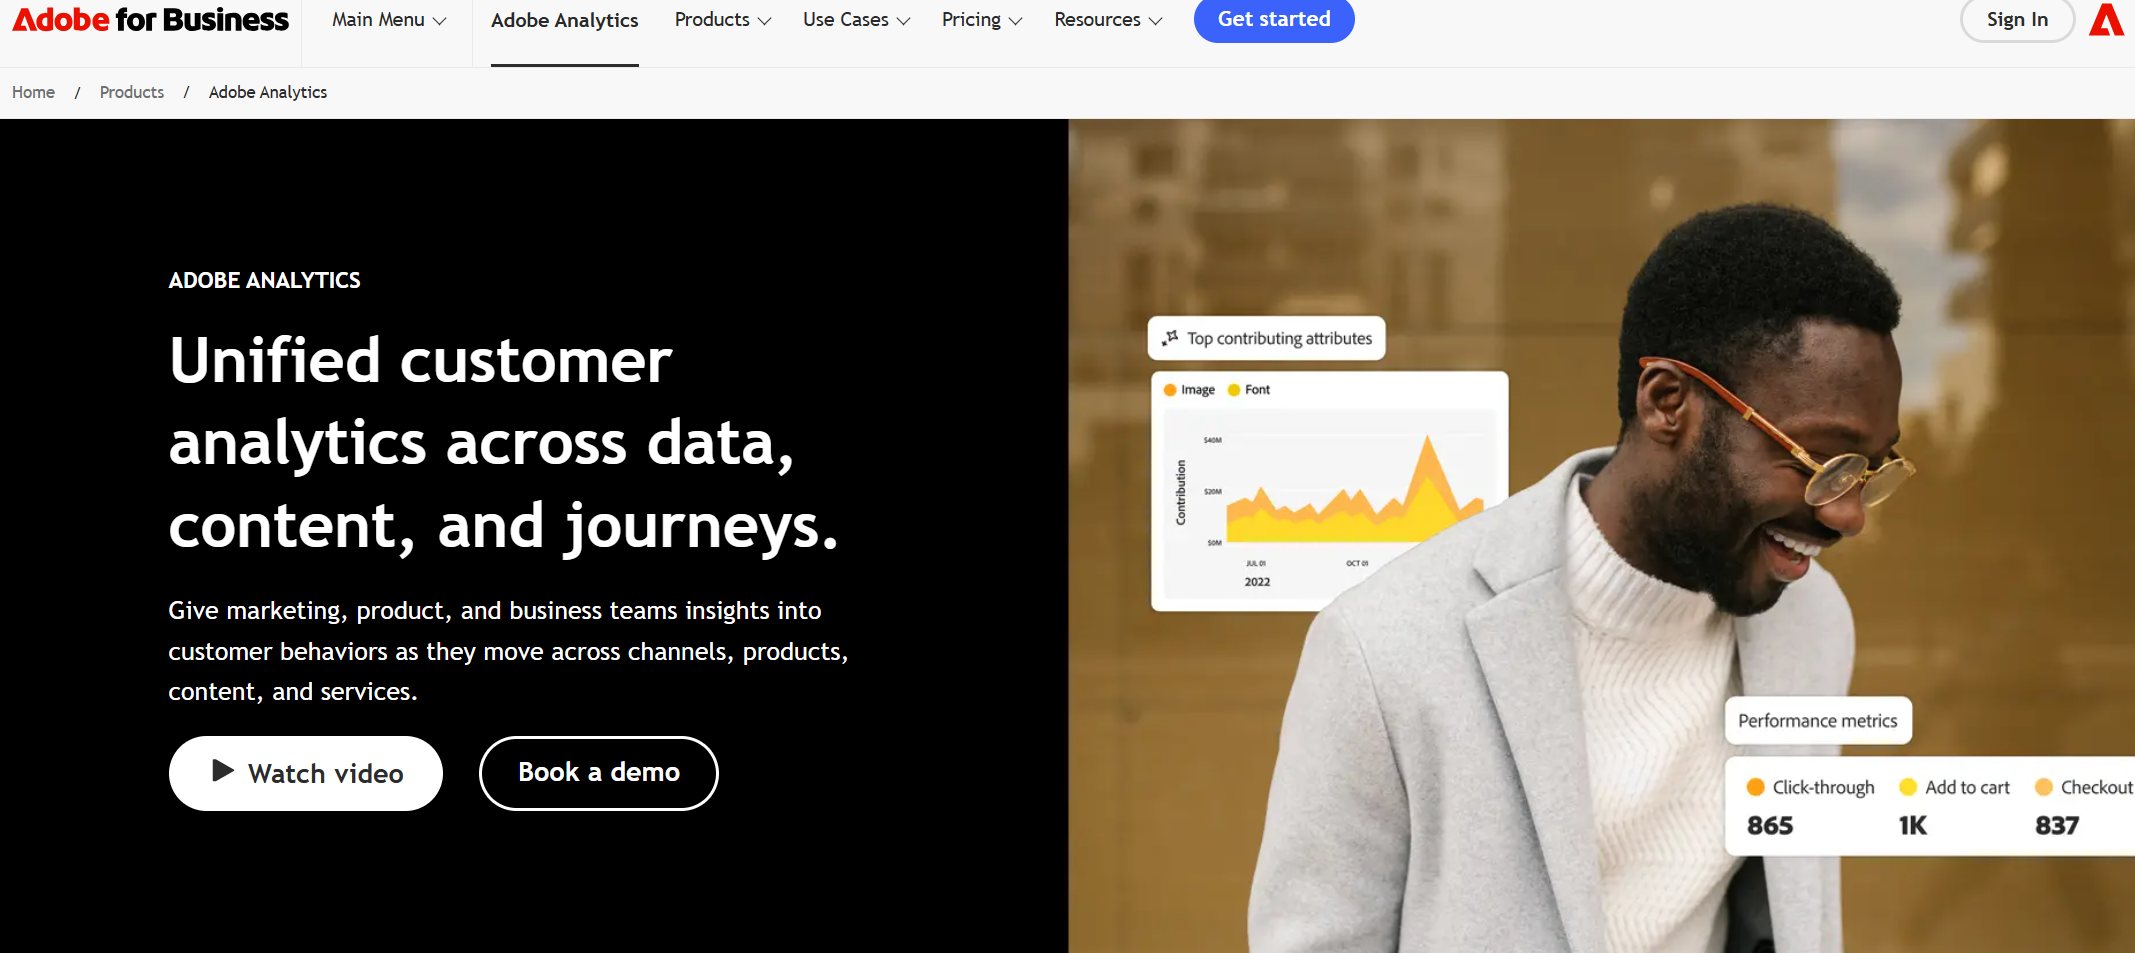 Adobe Analytics suits larger organizations needing advanced customer journey analysis and segmentation.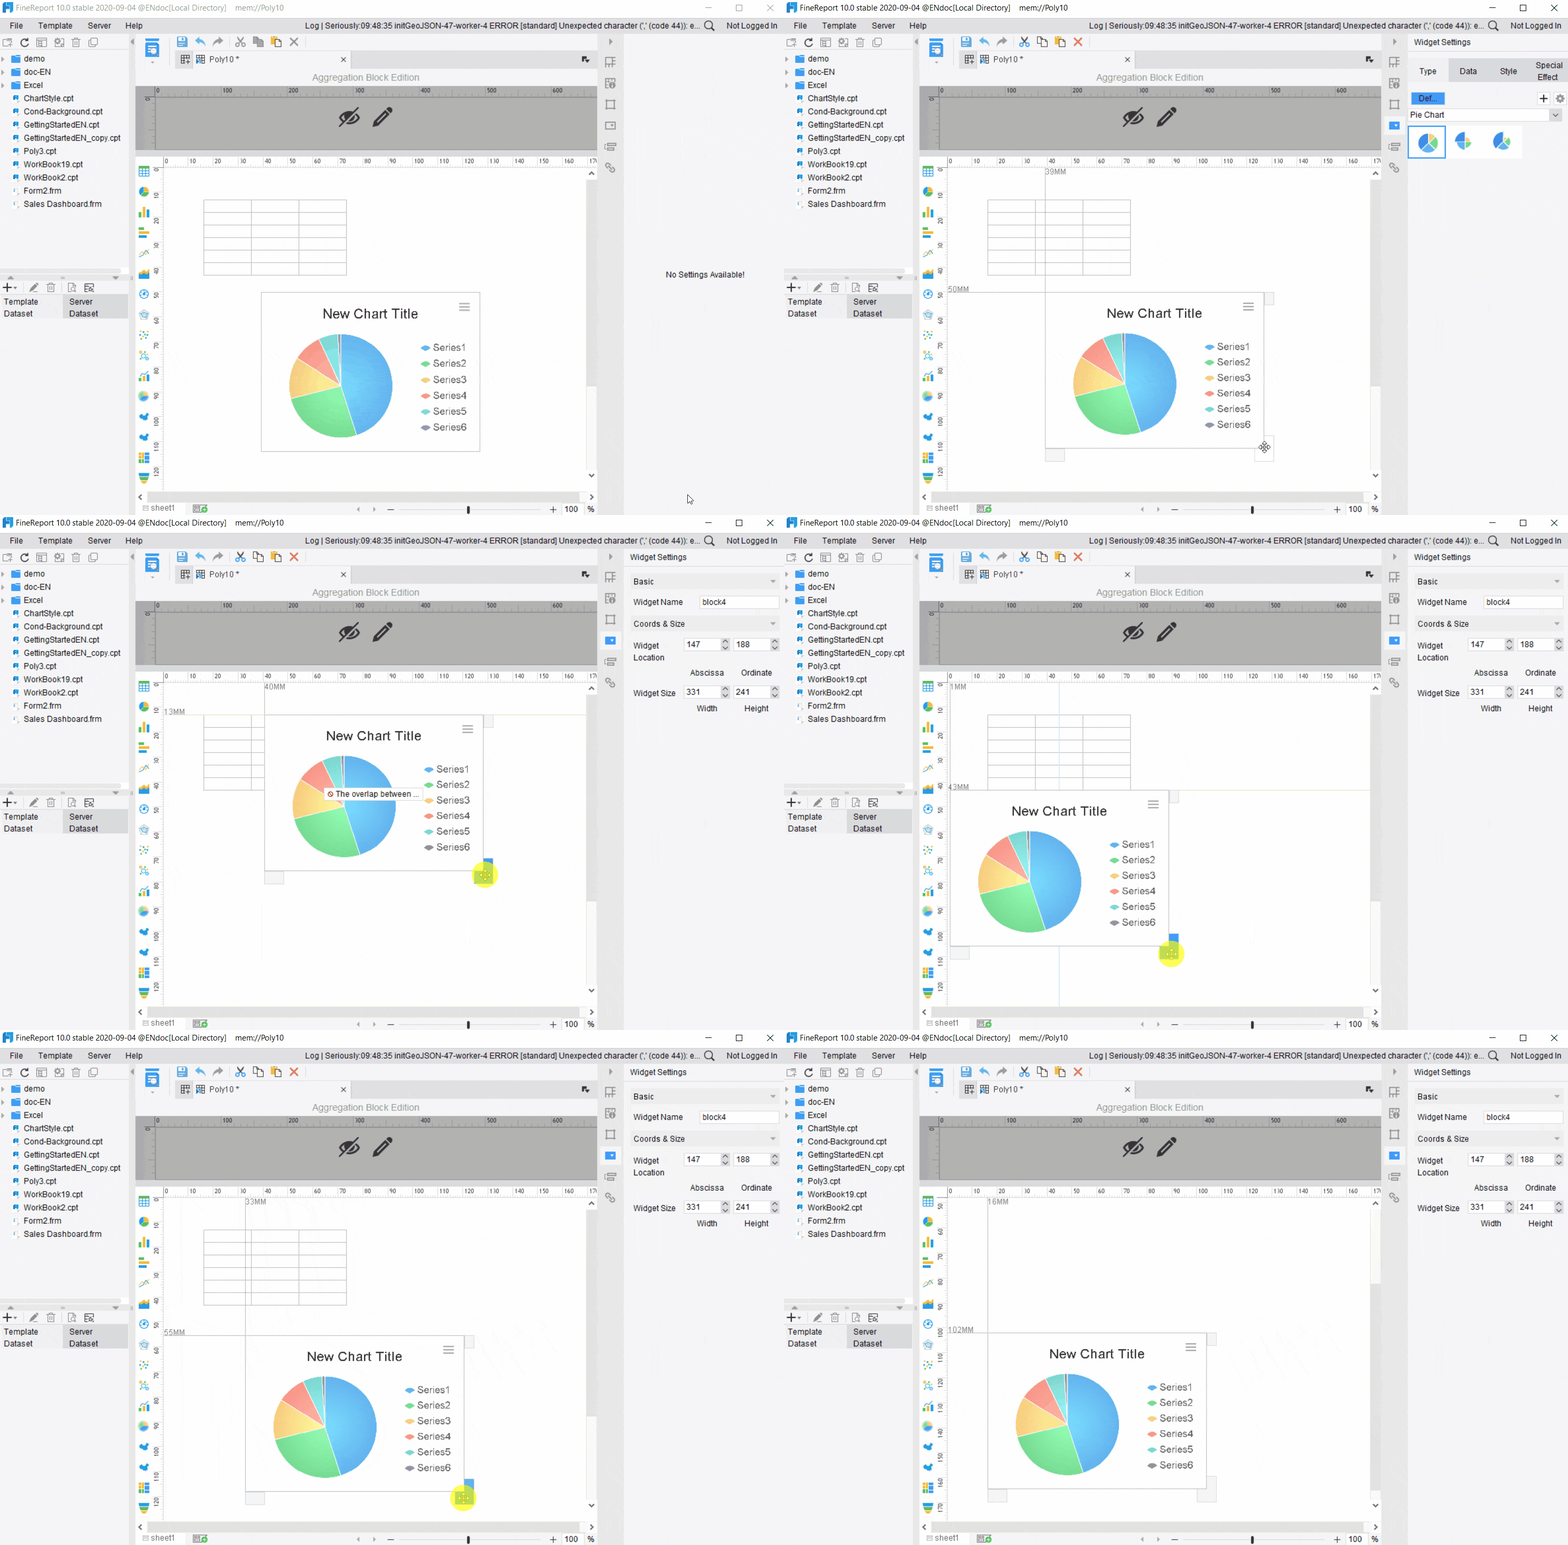
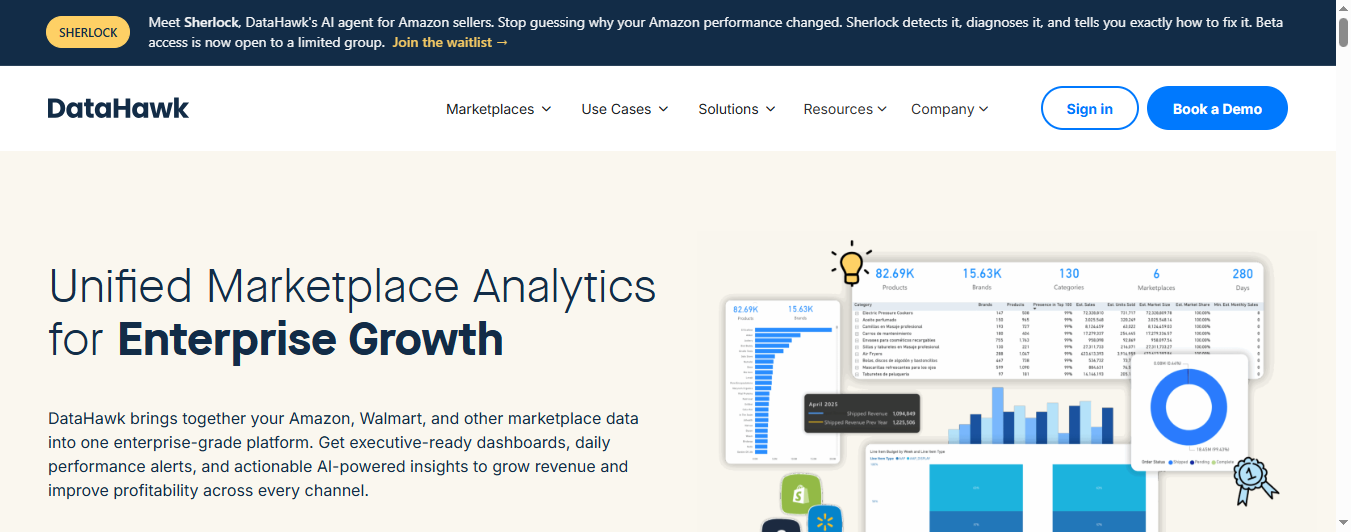 DataHawk is widely associated with marketplace and
  Supermetrics is more of a
  GA4 remains a common starting point for