If you are searching for tableau competitors, you are likely trying to answer a practical question: what BI platform can match or improve on Tableau for your team’s reporting, dashboarding, governance, or self-service analytics needs? For BI leaders, analysts, and operations teams, this usually comes down to trade-offs around usability, cost, modeling, deployment, and how well a platform supports business users beyond the analytics team.
Tableau remains a well-known BI platform for interactive data visualization. But many teams now evaluate alternatives because they need stronger self-service adoption, easier administration, embedded analytics, better alignment with their existing cloud stack, or more accessible AI-assisted analysis.
Quick Comparison Table
The table below gives a balanced snapshot of the leading Tableau competitors covered in this guide.
Tableau is widely respected for visual analytics, but it is not the right fit for every organization. Teams that compare Tableau competitors usually have one or more of these issues in mind.
Common reasons teams explore other BI platforms
Cost and total platform spend
For many organizations, the question is not just license cost. It is also the cost of administration, user enablement, dashboard maintenance, and scaling governed analytics across departments. A tool that is powerful for analysts may still become expensive if business users depend heavily on a small expert team.
Governance and metric consistency
As BI programs mature, teams often need more than attractive dashboards. They need shared definitions, reusable datasets, permission control, and consistent KPI logic across departments. This is one reason buyers compare Tableau with modeling-first tools like Looker or enterprise self-service tools with stronger centralized data management.
Embedded analytics requirements
Some companies are not only building internal dashboards. They also want to surface analytics inside customer-facing products, portals, or SaaS applications. In those cases, embedded BI capabilities can become a bigger priority than traditional dashboard authoring.
Ease of use for business users
A common gap in many BI rollouts is adoption outside the analytics team. Business stakeholders may want to filter, drill down, and build simple reports without depending on analysts for every change. That drives interest in more self-service-oriented platforms.
AI-assisted analysis expectations
Modern BI evaluation increasingly includes AI. Teams want to know whether a platform can help users ask questions, interpret trends, accelerate dashboard creation, or reduce repetitive analysis work. This does not replace core BI architecture, but it does affect productivity and adoption.
Key evaluation criteria for comparing platforms
When reviewing Tableau competitors, focus on the operating model your team needs, not just visual polish.
Data connectivity
Check whether the tool connects well to your warehouse, databases, spreadsheets, and operational systems. Also evaluate whether the connectors are practical for your real environment, not just listed in product pages.
Modeling and semantic control
Some teams need governed metrics and reusable business logic. Others need lightweight data prep that business users can manage. Understanding where your organization sits on that spectrum will narrow the shortlist quickly.
Dashboards and interactivity
Visual quality still matters. But also assess filtering, drill-down, responsiveness, mobile experience, and how easy it is to maintain dashboards over time.
Collaboration and sharing
A dashboard is only useful if people act on it. Review how the platform supports publishing, permissions, annotations, subscriptions, and cross-team access.
Security and administration
Enterprise teams should assess role-based access, row-level permissions, auditing, centralized administration, and scalability across departments.
Total cost of ownership
The lowest license price does not always produce the lowest BI cost. Factor in deployment effort, training, developer dependency, content sprawl, and long-term governance overhead.
Top Tableau Competitors at a Glance
The BI market has become more specialized. Some Tableau competitors prioritize governed analytics, some prioritize business-user self-service, and others focus on embedded analytics or SQL-centric workflows.
A quick side-by-side snapshot of the 10 tools covered in this comparison
Below is the practical framing for this list:
FineBI: Best for organizations that want self-service BI and interactive dashboards with enterprise-ready control.
Microsoft Power BI: Strong option for Microsoft ecosystem alignment and budget-sensitive scaling.
Looker: Strong fit for teams that want governed, model-centric analytics at scale.
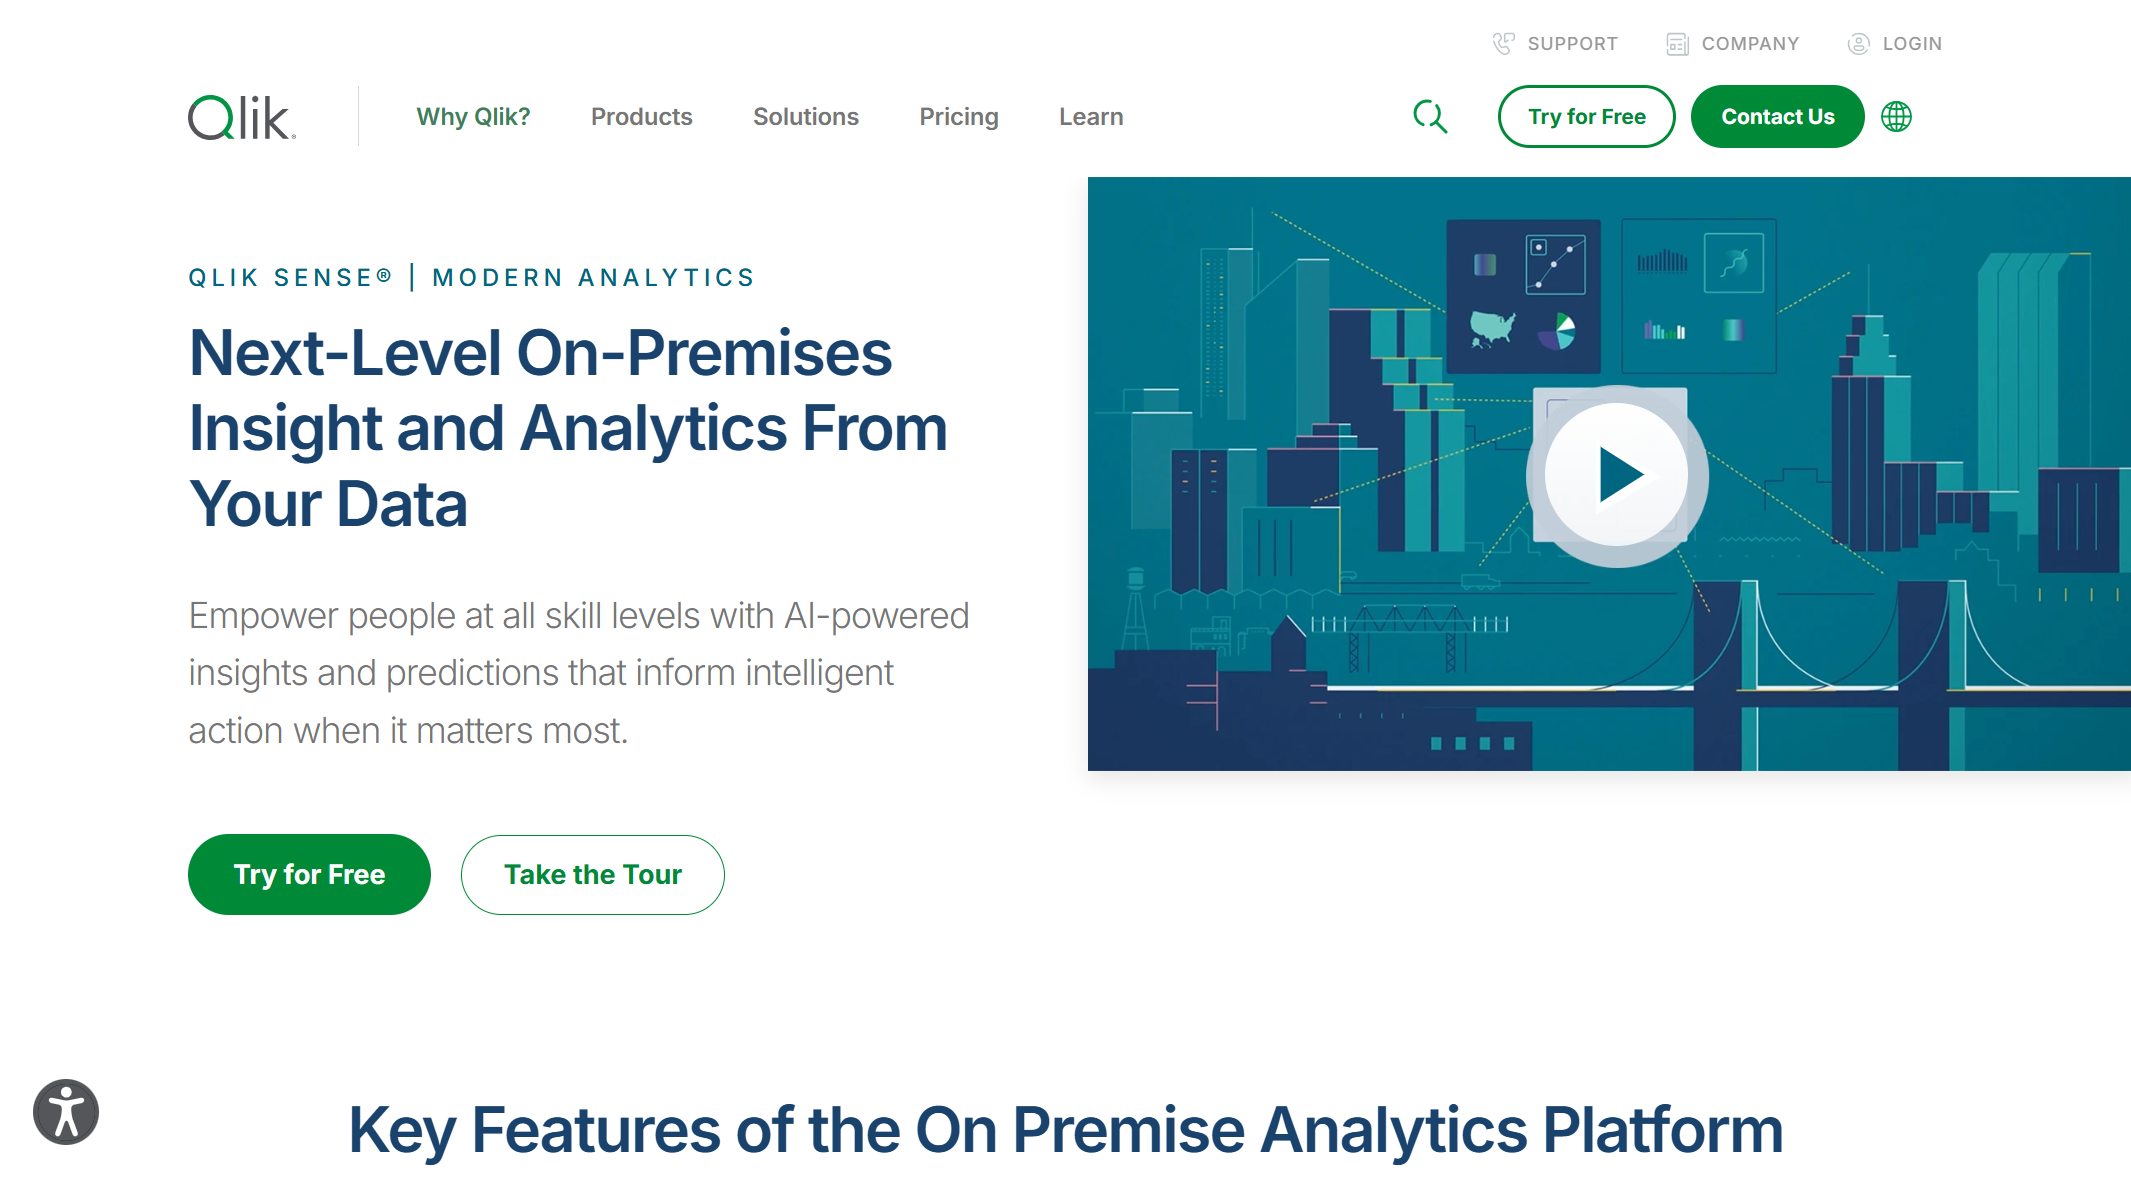
Qlik Sense: Useful for exploratory analysis across related datasets.
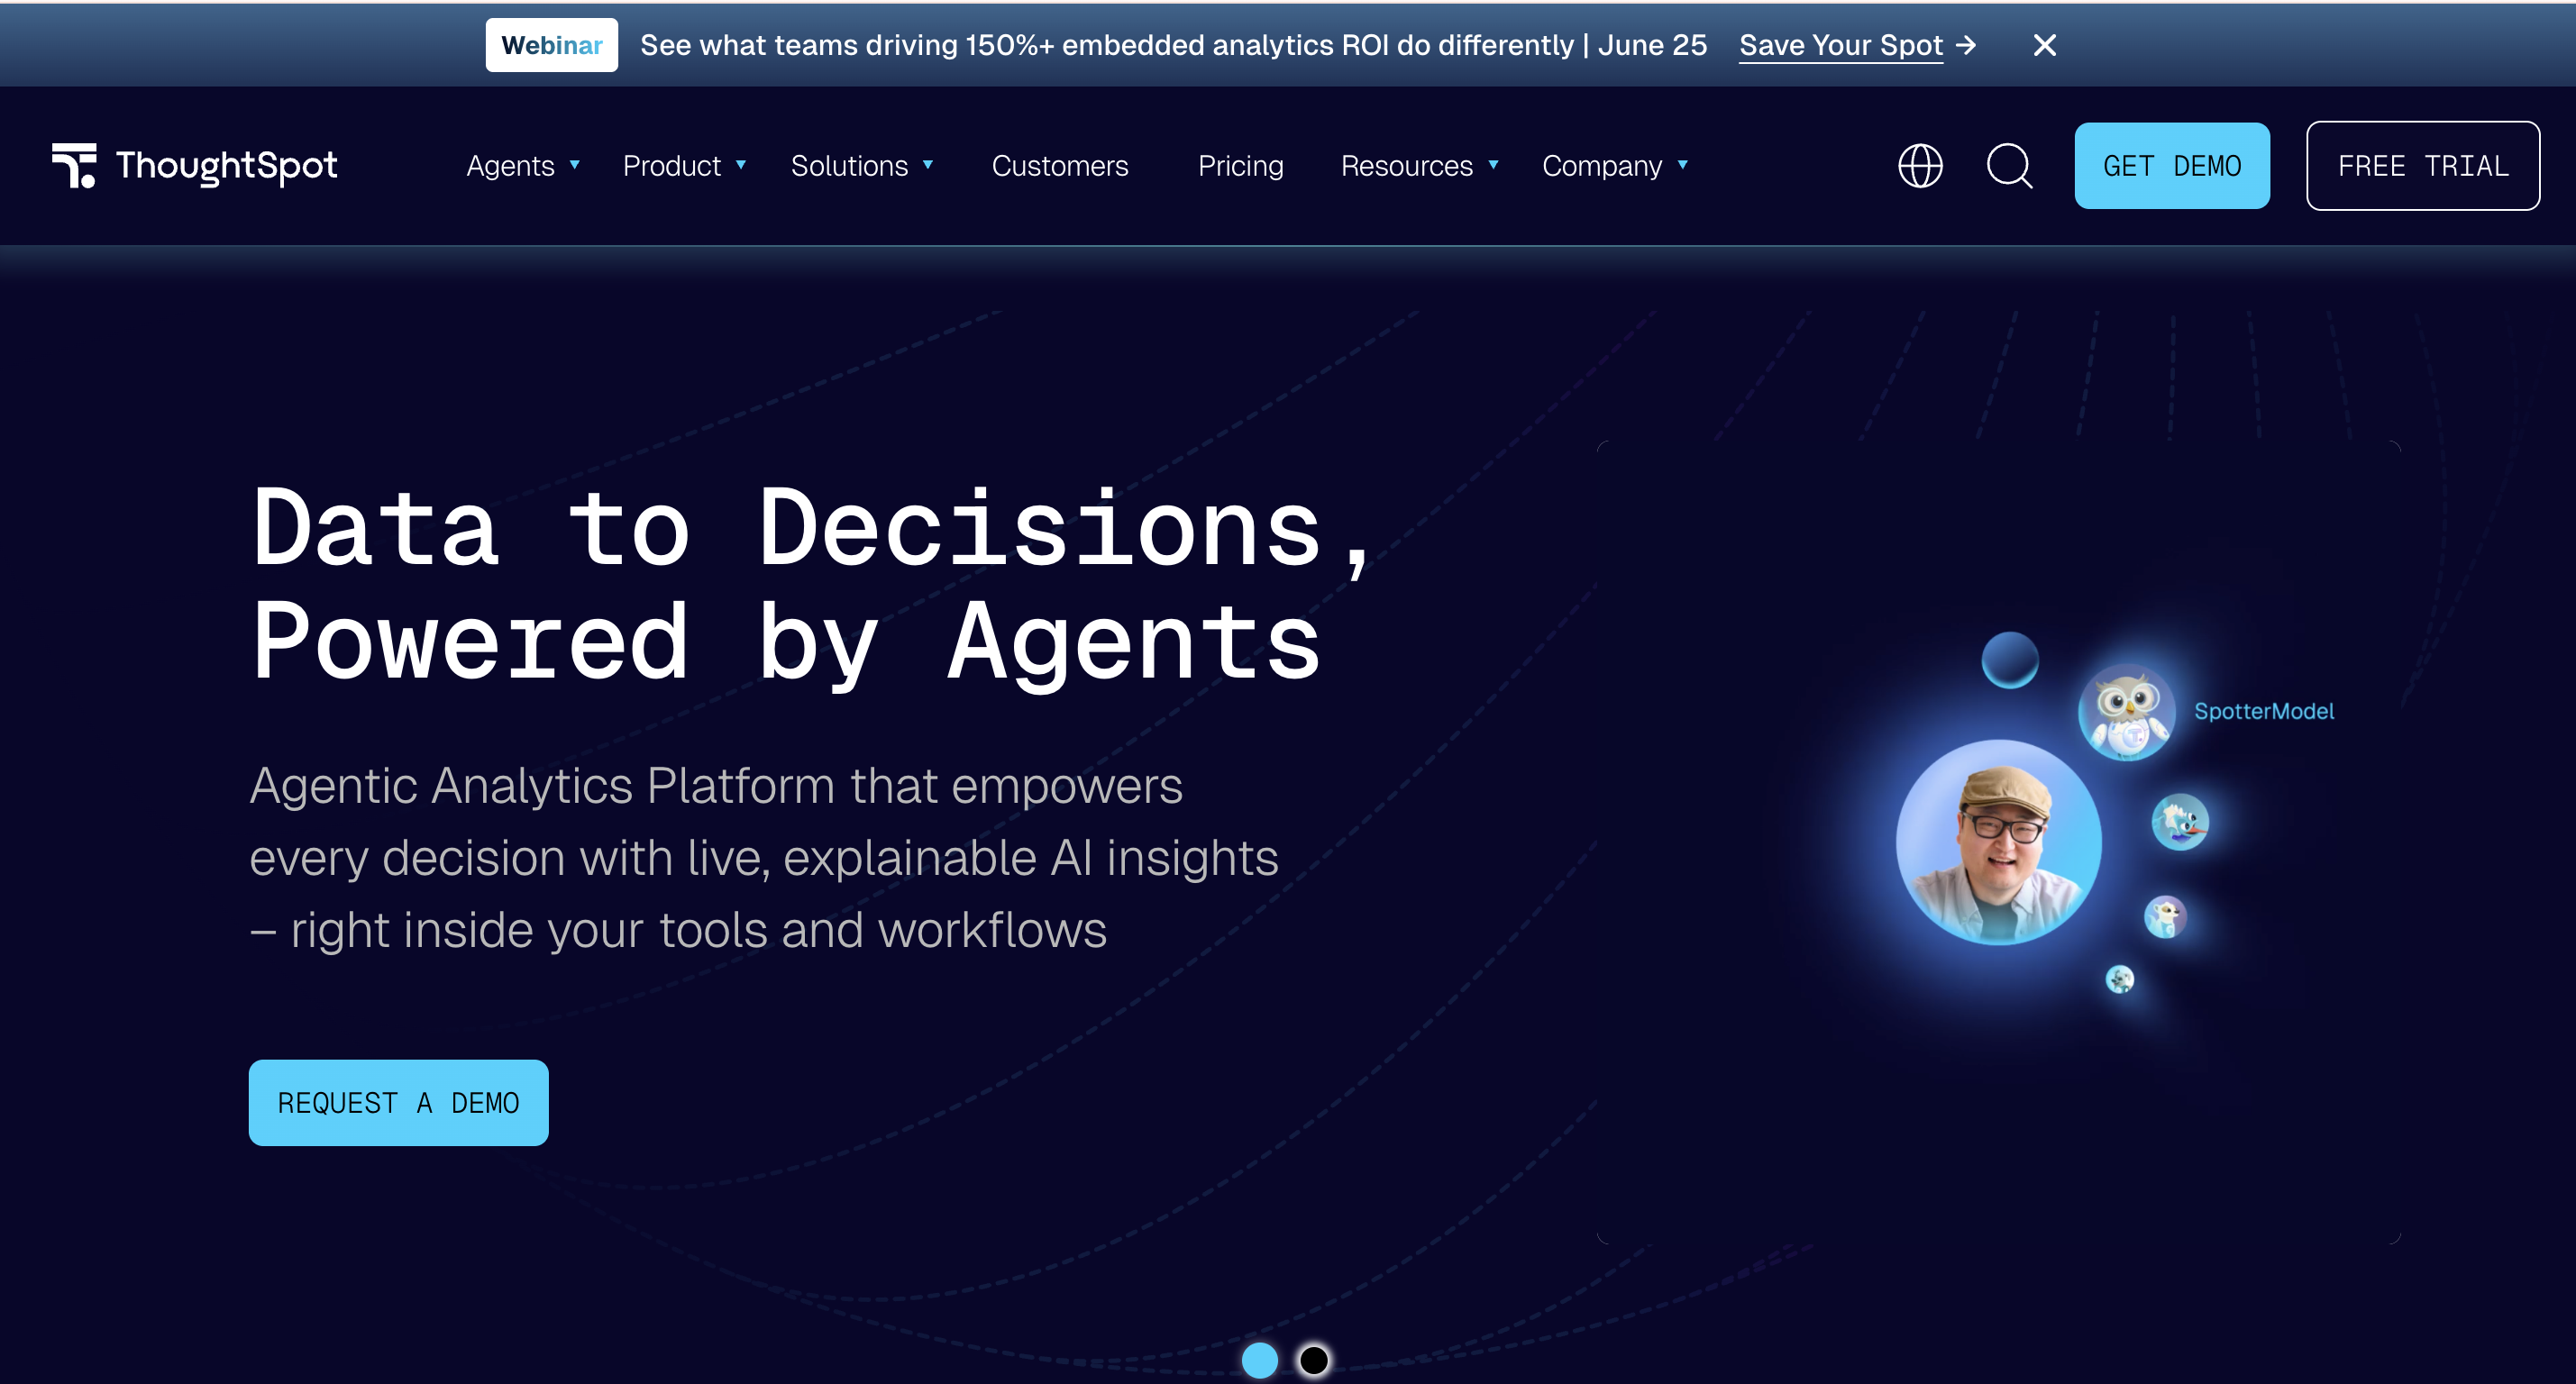
ThoughtSpot: Best for search-driven and question-first analytics.
Budget-conscious smaller teams: Power BI, Metabase, Superset
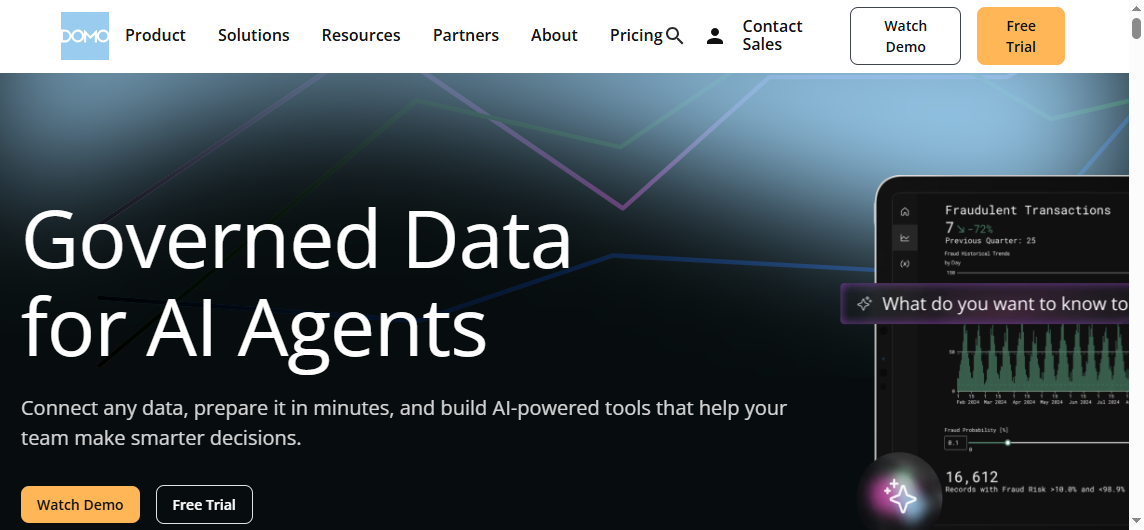
Operational dashboarding with cloud-first workflows: Domo
Shortlist guidance for teams choosing between enterprise, self-service, and embedded BI options
If your main problem is adoption by business teams, put FineBI, ThoughtSpot, and Power BI high on the shortlist.
If your main problem is metric governance and semantic consistency, prioritize Looker and also evaluate FineBI based on your desired level of business-user flexibility.
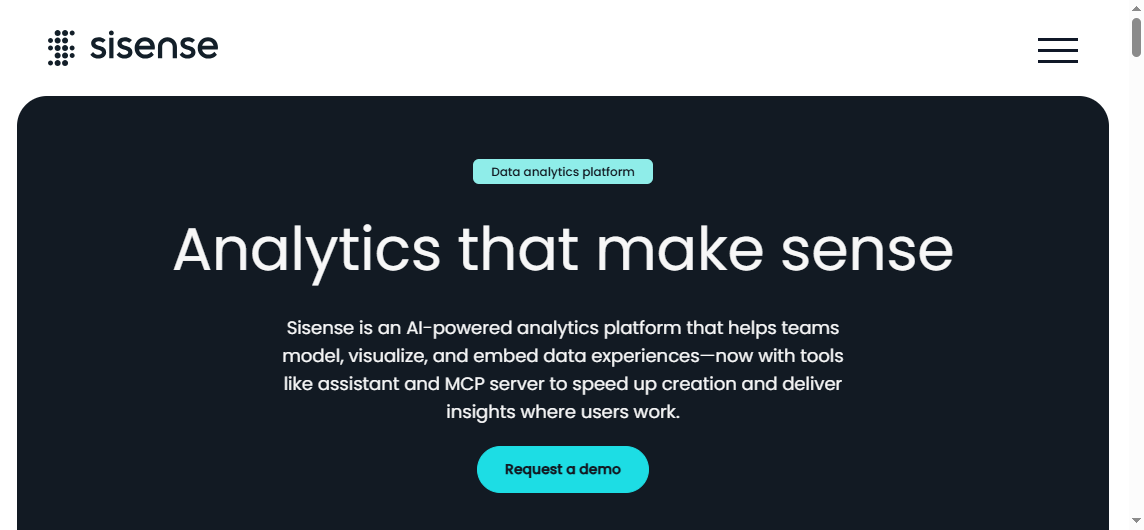
If your main problem is embedded analytics, consider Sisense and Looker.
If your main problem is open-source cost control, compare Superset and Metabase.
FineBI is a self-service BI platform designed to help business users and analytics teams build interactive dashboards, perform ad hoc analysis, and explore data with less technical friction. It is especially relevant for organizations that want broader BI adoption beyond a specialist analyst group.
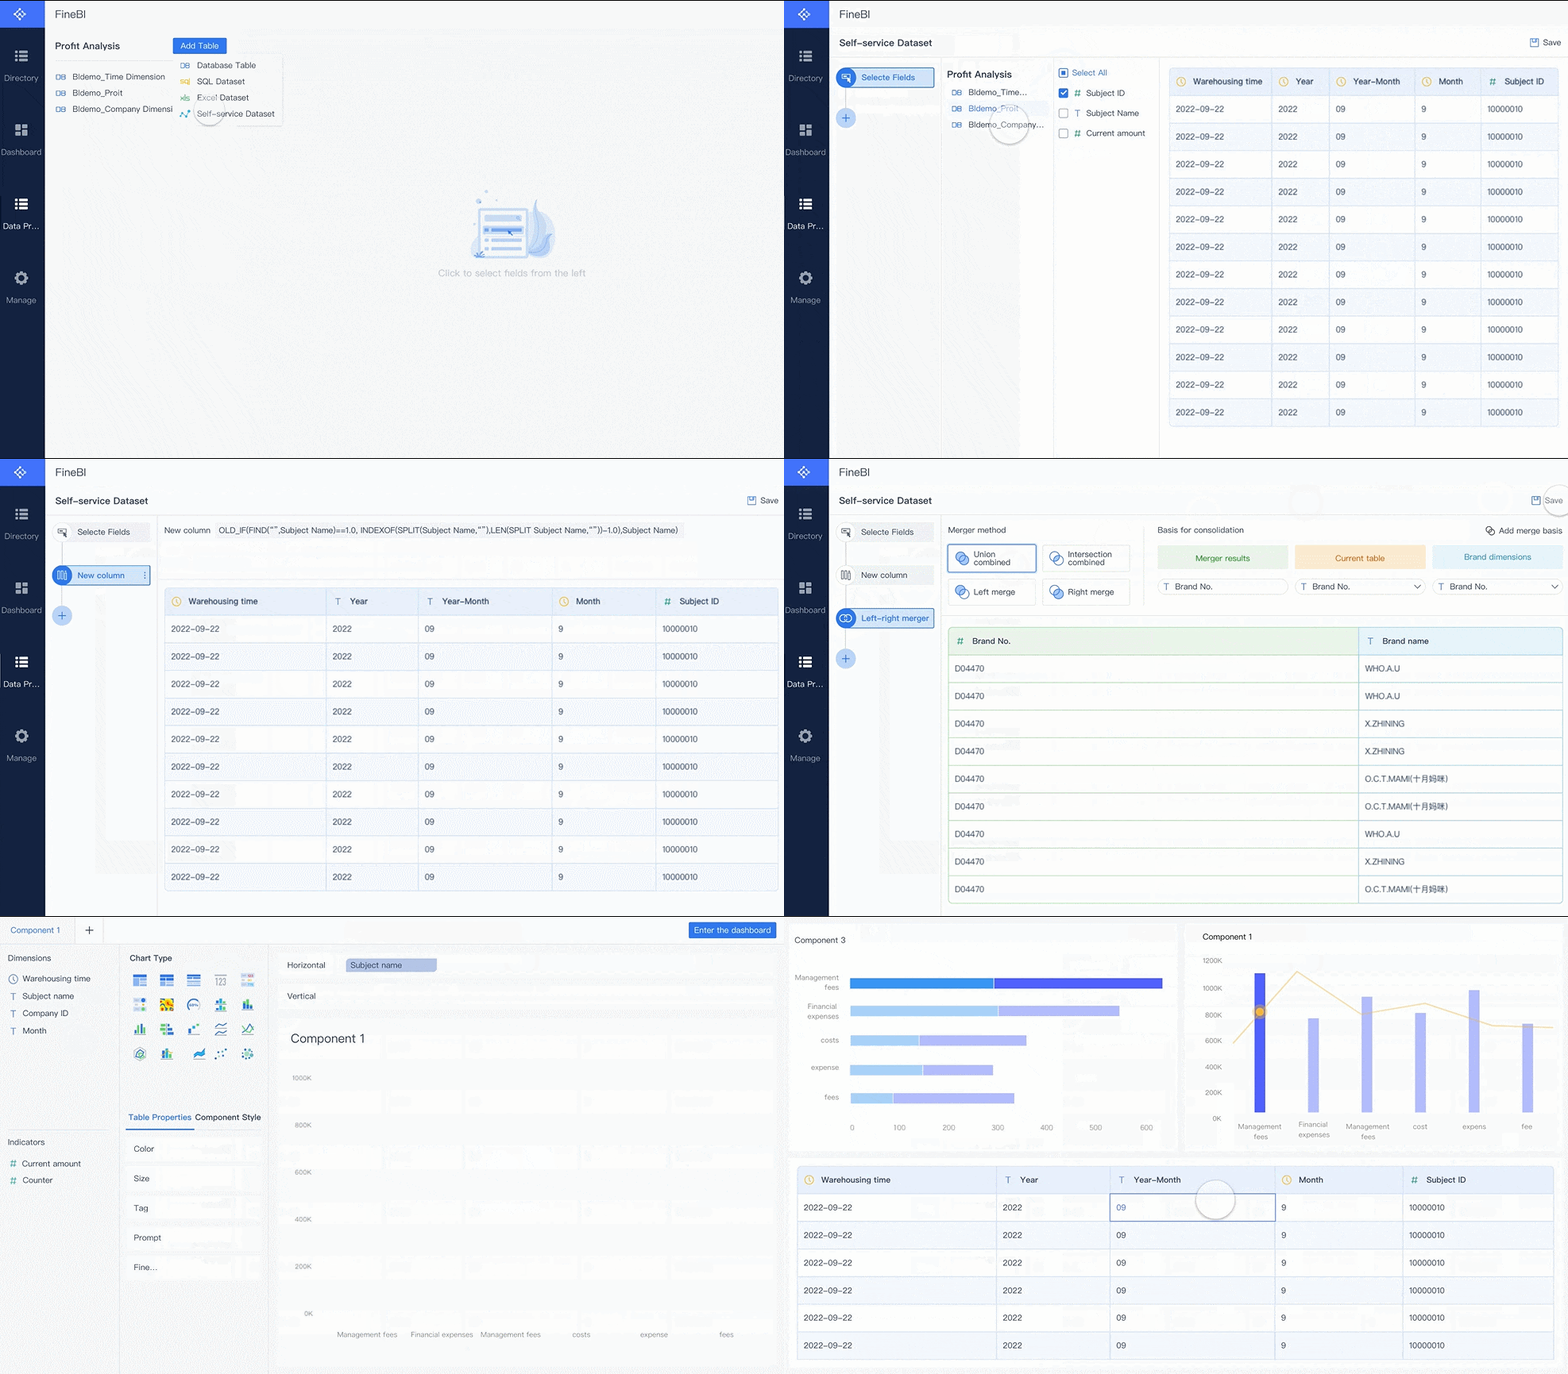
At a practical level, FineBI supports drag-and-drop analysis, dashboard creation, data exploration, drill-down workflows, and enterprise data connectivity. It is often a strong fit when teams want a balance between business-user accessibility and centralized BI management.
Departmental dashboarding for sales, operations, finance, HR, and management
Organizations trying to reduce analyst bottlenecks for recurring dashboard requests
Teams that need business-friendly dashboard creation with interactive analysis
FineBI’s AI-powered analytics with Dora
After evaluating the core BI workflow, many teams also want to know how AI can improve analysis without creating governance risks. This is where Dora becomes relevant alongside FineBI.
Dora adds an AI-powered analysis layer that can help users interact with data more naturally and accelerate insight discovery. In practical terms, this matters when business teams do not just want dashboards—they also want help understanding what to ask, where to drill, and how to move from data to explanation faster.
Combined with FineBI, Dora is especially relevant for teams that want:
Faster analysis support for business users
Easier question-driven exploration on top of dashboards and datasets
Reduced friction between dashboard viewing and deeper investigation
A more accessible path to AI-assisted analytics within a broader BI workflow
Rather than replacing dashboards, Dora can complement FineBI’s self-service environment by helping users move from visual monitoring to guided analysis more efficiently.
Tools like Tableau and Power BI are widely used in the BI market, but teams that need a more business-user-friendly, self-service BI platform may also consider FineBI, especially when they want interactive dashboards plus AI-assisted analysis support through Dora.
Get Ready-to-Use Dashboard Templates in Fine Gallery
Power BI is one of the most common Tableau competitors because it offers broad BI capabilities at a relatively accessible entry point, especially for companies already using Microsoft products.
Pros
Strong integration with Excel, Azure, Teams, and the wider Microsoft ecosystem
Widely adopted across SMB and enterprise environments
Good balance of dashboarding, reporting, and modeling capabilities
Familiar choice for organizations standardizing around Microsoft infrastructure
Cons
Advanced modeling and calculations can require DAX expertise
Governance and content sprawl may become challenging without disciplined administration
Some business users may still depend on specialists for more complex builds
Pricing considerations
Power BI is often considered budget-friendly compared with some enterprise BI platforms, but actual cost depends on user mix, sharing model, premium requirements, and administrative overhead.
Best use cases
Microsoft-centered organizations
Excel-heavy finance and operations teams
Companies looking for broad BI capability with mainstream adoption
Often favored by teams with analytics engineering resources
Cons
More technical setup and maintenance than many self-service-focused BI tools
Can be less approachable for teams that want fast business-user dashboard creation
Visualization flexibility may not be the main reason teams choose it
Modeling strengths
Looker is best understood as a model-centric analytics platform rather than only a dashboarding tool. Its value often comes from enforcing metric definitions and data logic at scale.
Best use cases
Governed analytics programs
Teams with strong SQL and data modeling capabilities
Organizations prioritizing semantic consistency over lightweight self-service
Qlik Sense is known for associative analysis, which helps users explore relationships across datasets in a less linear way than many traditional BI tools.
Pros
Strong exploratory analytics experience
Supports discovery across related data points without rigid navigation paths
Good fit for organizations that value flexible analysis patterns
Enterprise-ready option for larger analytics environments
Cons
Learning curve can be steeper for non-technical users
Final cost and deployment complexity may be significant for smaller teams
May be more platform than some departments need for lightweight dashboarding
Associative analysis strengths
Qlik Sense stands out when users need to investigate data relationships dynamically rather than simply consume predefined dashboards.
Best use cases
Exploratory dashboards
Data-heavy organizations
Teams investigating patterns across complex related datasets
Mode is better understood as an analytics workspace for data teams than a broad business-user BI platform.
Pros
Strong for SQL-heavy workflows
Supports analyst productivity with code-oriented analysis patterns
Useful for combining queries, analysis, and reporting outputs
Cons
Less suitable for non-technical business users
Self-service adoption may be limited outside analyst teams
Dashboarding is not usually the main reason organizations choose it
Analyst workflow strengths
Mode appeals to teams where analysts drive exploration and reporting, often with SQL as the primary interaction layer.
Best use cases
Data analysts
SQL-heavy teams
Technical reporting environments
Apache Superset, Metabase
These two tools are often compared together because both are popular alternatives for budget-conscious and open-source-minded teams, though they serve different maturity levels.
Less suitable for advanced enterprise governance and complex analytics programs
Visualization and modeling depth may be limited for larger BI maturity stages
Can be outgrown as reporting complexity increases
Best use cases
Startups
Small businesses
Internal team reporting with straightforward needs
How to Choose the Right Tableau Competitor for Your Team
Choosing among Tableau competitors is less about finding a universal winner and more about matching a platform to your organization’s BI operating model.
Match the tool to your BI maturity and decision-making style
A common mistake is buying an enterprise-grade BI platform when the real problem is simple departmental reporting, or choosing a lightweight self-service tool when the organization really needs metric governance.
When to prioritize self-service reporting versus centralized semantic governance
Choose self-service-oriented BI when:
Business users need to create or adapt dashboards frequently
Analysts are overloaded with recurring report requests
The goal is broader data adoption across departments
Choose centralized semantic governance when:
KPI consistency is the top priority
Multiple teams depend on shared metric definitions
You have data engineering or analytics engineering capacity to support a governed model
For many organizations, this is where a platform like FineBI becomes relevant: it supports self-service dashboarding for business teams while still fitting broader enterprise BI programs. If AI-assisted analysis is also becoming a priority, pairing that workflow with Dora can help teams move faster from dashboards to guided insight exploration.
Compare deployment fit, administration burden, and long-term scalability
Do not evaluate a tool only by the first dashboard demo. Review how much effort it takes to administer permissions, onboard users, maintain data models, and keep dashboards reliable over time.
How security, performance, and stakeholder adoption affect platform choice
A platform with strong visuals but weak adoption will underperform. A platform with strong governance but low usability may create bottlenecks. The best fit usually balances:
Security and access control
Performance with real business data
Ease of administration
Long-term stakeholder adoption
Build a practical shortlist and pilot plan
Before committing, reduce your list to 2 to 4 serious candidates and run a structured proof of concept.
Questions to ask in demos
How does the platform support both analyst needs and business-user self-service?
What does governed metric management look like?
How are permissions, row-level access, and sharing handled?
How easy is it to connect to our real data sources?
What does AI-assisted analysis actually do in the workflow?
Proof-of-concept steps
Use one real business use case, such as sales pipeline, finance reporting, or operations monitoring.
Connect to actual production-like data.
Rebuild a dashboard that stakeholders already use.
Test business-user interaction, not just analyst build speed.
Review governance, performance, and administration before scoring the tool.
Success metrics for final selection
Time to first usable dashboard
Business-user adoption
Governance fit
Ongoing maintenance effort
Scalability across departments
Practical Recommendations for BI Teams Evaluating Tableau Competitors
Here are five recommendations I would give as a BI consultant to any team comparing alternatives to Tableau:
Start with your decision workflow, not the feature list. If your users mainly monitor KPIs, prioritize dashboard usability. If they ask ad hoc questions, evaluate search and AI-assisted analysis more heavily.
Test with a real cross-functional use case. A polished product demo rarely reveals governance gaps or usability friction.
Separate analyst power from business-user adoption. Many BI tools perform well for expert builders but struggle to scale across non-technical teams.
Measure administration effort early. Security, content control, and metric consistency often determine BI success more than chart variety.
Evaluate AI in context. AI should support dashboarding, analysis, and insight discovery—not distract from trusted data workflows.
Final Recommendations by Use Case
The best Tableau competitor depends on what your team needs most.
Best option for enterprise governance and complex modeling
If your priority is governed analytics and semantic consistency at scale, Looker is a strong fit, especially for organizations with technical data teams and warehouse-centric architectures.
Best option for Microsoft ecosystems and budget efficiency
If your organization runs heavily on Microsoft tools and wants broad BI functionality with a familiar ecosystem, Power BI is one of the most practical choices.
Best option for embedded analytics and customer-facing dashboards
If you are building analytics into a product or customer portal, Sisense is worth serious consideration, with Looker also relevant for API- and model-oriented embedded scenarios.
Best option for analyst-led teams, small businesses, and open-source adopters
Mode fits analyst-led SQL workflows
Metabase works well for small teams with straightforward BI needs
Apache Superset is suitable for engineering-led open-source BI deployments
When FineBI Is a Strong Tableau Competitor
If your team likes the value of BI dashboards but needs a more business-user-friendly self-service experience, FineBI deserves a place at the top of the shortlist.
It is especially relevant when you need:
Interactive dashboards that business teams can actually use
Faster report and dashboard iteration across departments
Drag-and-drop analysis and drill-down exploration
Enterprise connectivity and broader analytics adoption
That combination is important. Some teams do not want to choose between traditional BI dashboards and newer AI-assisted workflows. FineBI covers the dashboarding and self-service foundation, while Dora adds a more natural, AI-powered way to support exploration and insight discovery.
In short, Tableau remains an important BI platform, but there is no shortage of strong alternatives. The right choice depends on whether your organization values governed modeling, Microsoft alignment, embedded analytics, open-source flexibility, or easier self-service adoption. For teams that want to combine interactive BI dashboards, business-user accessibility, and AI-assisted analytics, FineBI with Dora is a practical option to evaluate carefully.
The best choice depends on your priorities. Power BI is often a strong fit for Microsoft-based organizations, Looker works well for governed analytics, and FineBI suits teams that want business-friendly self-service with enterprise control.
Teams usually compare alternatives because of cost, learning curve, governance needs, self-service adoption, embedded analytics, or AI-assisted analysis. Many buyers want a platform that is easier for business users and simpler to scale across departments.
ThoughtSpot, Metabase, and FineBI are often easier for non-technical users because they reduce reliance on complex modeling or SQL-heavy workflows. The right option depends on whether your team prefers search-based analysis, simple dashboards, or drag-and-drop self-service BI.
Sisense is commonly evaluated for embedded analytics because it is designed for product and SaaS use cases. Looker can also be a strong option when you need governed metrics and API-driven embedding.
Yes, Apache Superset and Metabase are popular lower-cost options, and Superset is widely used as an open-source choice. They can work well for smaller teams or technical teams, but they usually offer less polish or require more setup than enterprise BI platforms.
Product Trial
FineReport
Pixel-perfect reports · Interactive dashboards · Easy data entry · Digital twins


 Drag-and-drop Analysis
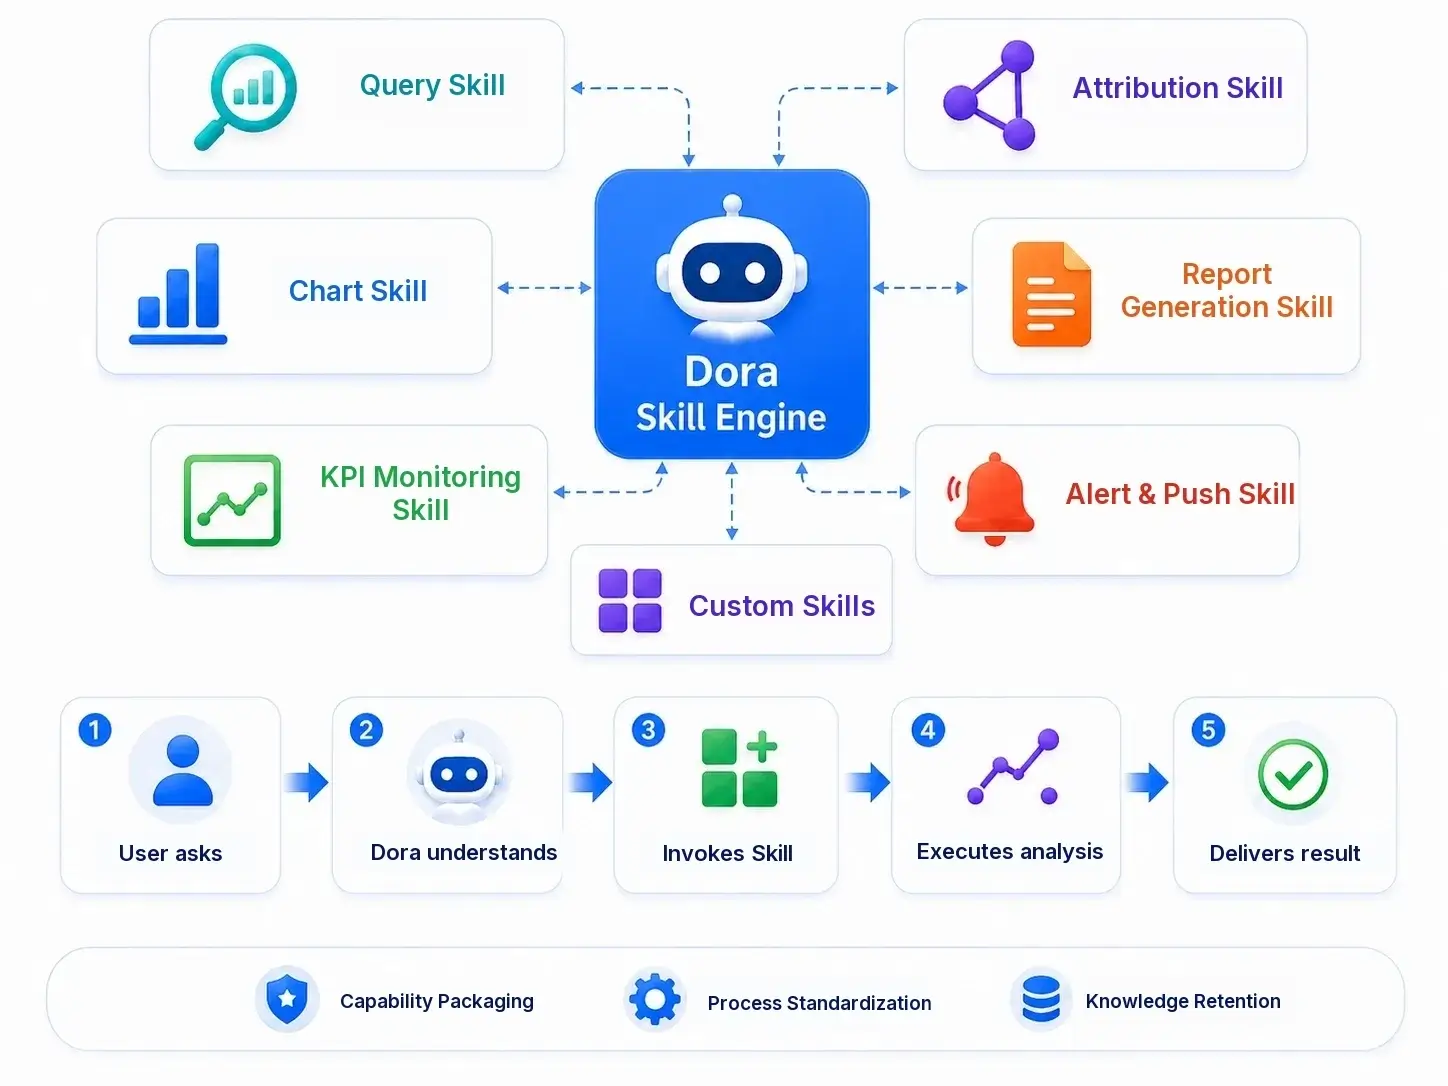 Dora is powered by skills.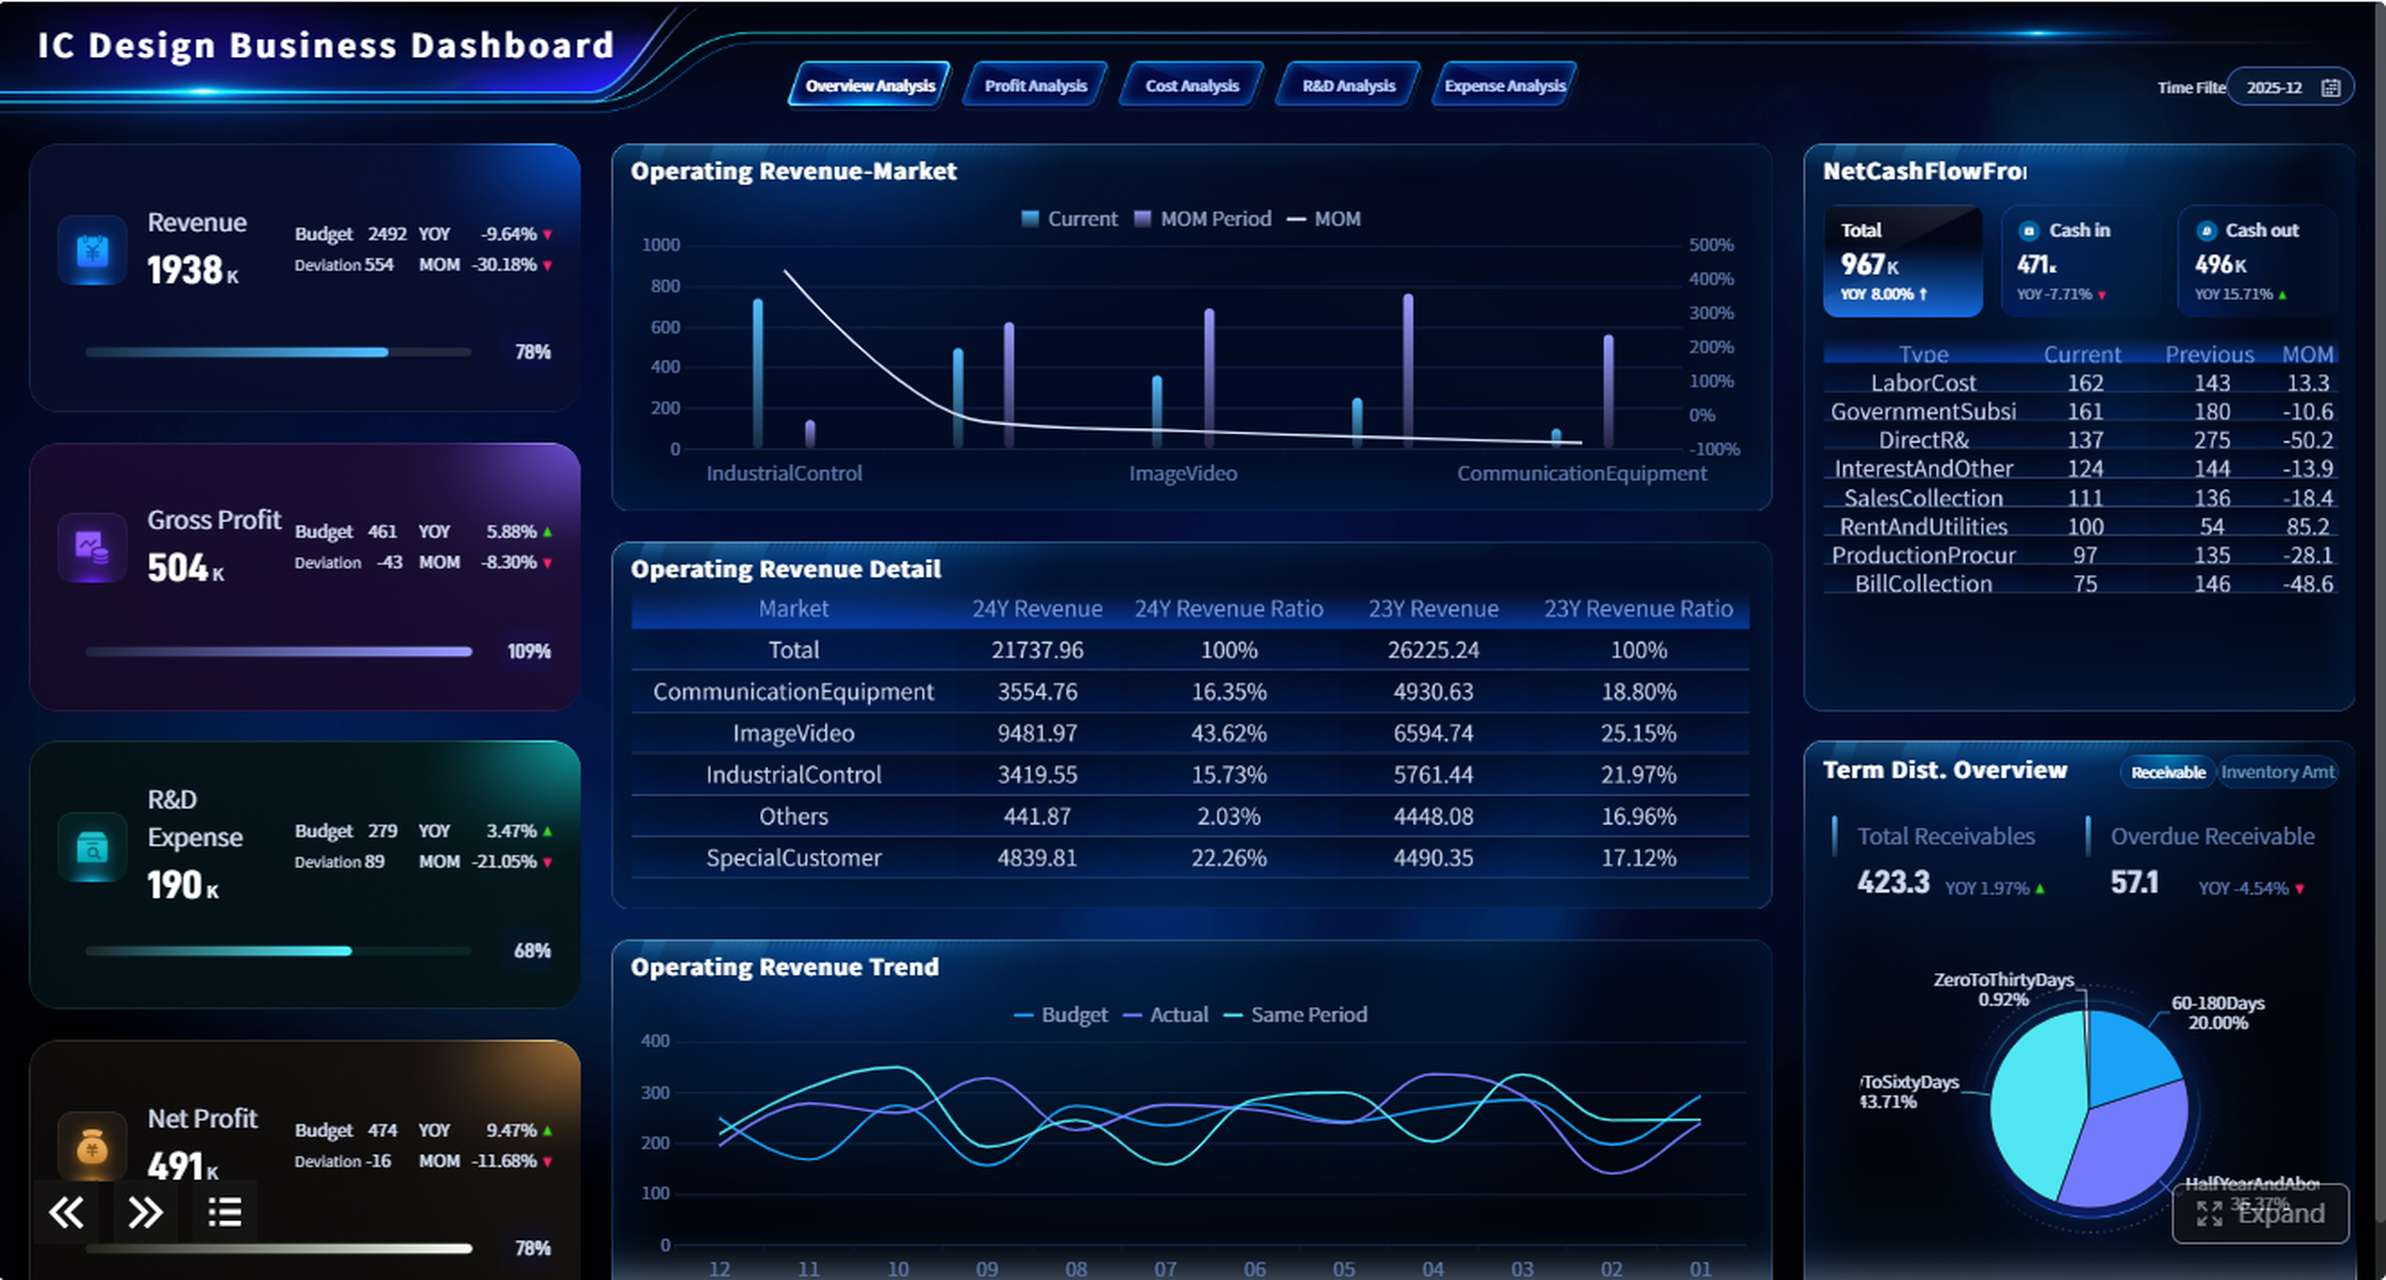

 Website:
  Website:
  Website:
  Website:
  Website:
  Website:
  Website:
  Website:
  Website: