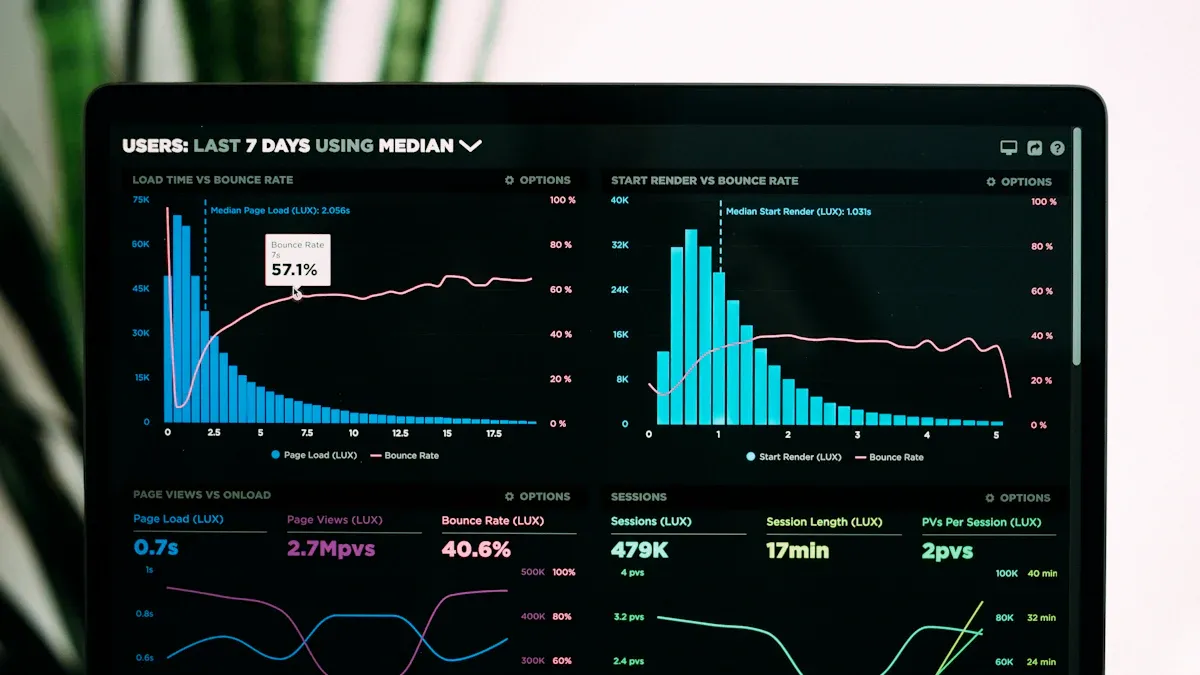
A logistics management system helps companies plan, execute, monitor, and improve the movement of goods across suppliers, warehouses, carriers, customers, and returns processes. For operations leaders, the value is straightforward: better delivery performance, lower logistics cost, fewer exceptions, and faster decisions.
In practice, the challenge is not only running shipments and warehouses. It is also turning fragmented operational data into reliable action. Teams need dashboards for daily control, and they increasingly need an AI assistant that can help them ask follow-up questions, summarize risks, and push timely updates before the next review meeting.
With FineBI + Dora, business users can ask for analysis in chat, generate chart-based answers or dashboard-style views from trusted BI assets, and receive scheduled summaries before the next meeting.
[Insert Dashboard Demo Here: Show the main FineBI dashboard for this scenario, including primary KPIs, trend chart, breakdown chart, and risk/exception view]
All dashboards in this article are built with FineBI
What a logistics management system is and why it matters
A logistics management system is the operational and data layer used to coordinate how goods move, where inventory sits, which resources handle fulfillment, and how exceptions are managed. In plain language, it helps a business answer critical questions such as:
What needs to ship today?
From which warehouse?
Through which carrier or route?
At what cost and service level?
What is delayed, at risk, or backordered?
Which issue needs action now?
For most enterprises, logistics performance depends on four capabilities:
Planning: deciding how orders, inventory, transportation, and labor should be arranged.
Execution: carrying out picking, packing, loading, shipping, receiving, and returns.
Visibility: seeing shipment status, inventory positions, bottlenecks, and exceptions.
Control: using reports, KPIs, alerts, and workflows to improve service and cost outcomes.
A logistics management system matters because logistics problems are rarely isolated. A late truck can become a customer service issue. A warehouse picking delay can create missed delivery targets. A stock discrepancy can increase transport cost through split shipments. Strong systems reduce this chain reaction by connecting operations and data.
It is also useful to separate related concepts:
Logistics management focuses on the movement, storage, fulfillment, and return of goods.
Transportation management is a narrower area focused mainly on routing, carrier selection, freight execution, and shipment tracking.
Supply chain coordination is broader still, covering sourcing, production, supply planning, inventory strategy, and partner collaboration beyond logistics alone.
So, a logistics management system often overlaps with TMS, WMS, ERP, and order systems, but its real business role is to connect the operational flow end to end.
For enterprise teams, this is where reporting becomes strategic. It is not enough to know where a shipment is. Leaders need trusted dashboards, governed KPI definitions, and an AI assistant that can help users retrieve metrics, explain variance, and surface exceptions without waiting for analysts.
Core modules found in a logistics management system
A modern logistics management system can include several operational modules. Some companies buy them as part of a suite, while others connect separate order, warehouse, transportation, and reporting tools. Either way, the core workflow usually includes planning, fulfillment, visibility, and analytics.
Order and shipment planning
Order and shipment planning is where logistics execution begins. The system receives demand from sales orders, replenishment requests, transfer orders, or returns workflows and translates that demand into workable shipment plans.
Common capabilities include:
Order capture and validation
Shipment grouping and load building
Routing and stop sequencing
Delivery scheduling
Carrier selection
Freight mode choice
Appointment planning
Documentation preparation
This module helps operations teams balance service commitments with transportation efficiency. For example, combining orders into fuller loads may reduce transportation cost per shipment, while dynamic routing may help protect on-time delivery in congested regions.
From a reporting perspective, planners need visibility into:
Orders awaiting allocation
Planned vs actual dispatch time
Route efficiency
Carrier performance
Cost by route, lane, or customer
Unshipped order backlog
With FineBI, these data points can be modeled into trusted planning dashboards. With Dora on top, a planner or operations manager can ask in natural language for a breakdown of delayed dispatches by warehouse, carrier, and order priority, then receive a chart-based answer based on governed KPI logic.
Inventory, warehouse, and fulfillment coordination
Logistics performance is tightly linked to inventory and warehouse operations. Even the best transport plan fails if stock is not available, locations are inaccurate, or picking is delayed.
This part of the logistics management system typically supports:
Stock visibility by site and status
Inbound receiving
Putaway workflows
Replenishment rules
Picking and packing
Wave or batch processing
Dock operations
Returns handling
Fulfillment status tracking
The operational goal is to keep goods flowing through storage and fulfillment with speed and accuracy. The management goal is to understand where delays or waste occur. For example:
Is order cycle time rising because picking labor is constrained?
Is backorder rate tied to replenishment lag?
Is dock-to-stock time creating downstream shipment delays?
Are returns overwhelming warehouse capacity in peak periods?
This is why warehouse and inventory data must be visible in logistics reporting, not trapped inside isolated systems. FineBI can integrate ERP, WMS, and related sources to create a shared semantic view of fulfillment performance. Dora can then help frontline users and managers retrieve trusted stock and throughput metrics through chat, without forcing them to search across multiple dashboards.
Tracking, exceptions, and customer communication
A logistics management system also needs to support visibility after dispatch. Once a shipment is moving, operations teams need timely status, exception management, proof of delivery, and customer communication.
Core functions usually include:
Shipment tracking by milestone or event
Delay and disruption alerts
Exception classification
Proof of delivery capture
Delivery confirmation
Issue resolution workflow
Returns and reverse logistics monitoring
Customer-facing status updates
This module improves service reliability because not every logistics problem can be prevented. But many can be detected and managed earlier. A carrier delay, customs hold, failed delivery, damaged item, or route disruption becomes less harmful when teams see it quickly and act with clear ownership.
This is also one of the strongest enterprise AI scenarios. Instead of expecting managers to constantly monitor dashboards, Dora can act as a Risk Alert Officer or Daily Briefing Secretary, watching trusted FineBI metrics and exception views, then pushing summaries or alerts to the right people. That makes the system more operational, not just more analytical.
Reporting, analytics, and system integrations
Reporting is what turns logistics data into management control. Without a strong reporting layer, teams can execute tasks but struggle to improve the network.
A mature logistics reporting capability should connect data from:
Root-cause analysis by region, site, customer, SKU, or lane
FineBI is the BI foundation in this scenario. It helps enterprises build governed dashboards, reusable metrics, and trusted semantic assets across logistics data sources. Dora extends that foundation into Agentic BI: users can ask questions in chat, retrieve dashboards and metrics, generate chart-based answers, and receive scheduled summaries or anomaly alerts tied to operational responsibility.
Key functions and business benefits for operations teams
A logistics management system creates value when it improves both execution quality and decision quality. For operations teams, the main business benefits usually include the following.
Improve delivery speed and accuracy
Better order planning, route control, inventory coordination, and exception management reduce delays and errors.
Strengthen cost control
Teams can analyze transportation cost per shipment, warehouse productivity, asset utilization, and cost-to-serve patterns with more precision.
Increase service consistency
Standard workflows, KPI tracking, and exception follow-up help create a more reliable customer experience across locations and carriers.
Expand visibility across inbound, outbound, and reverse logistics
Operations leaders can monitor supplier receipts, warehouse flow, outbound delivery, and returns in one reporting framework.
Support compliance and audit readiness
Document control, proof of delivery, status history, and governed reporting help with internal reviews, customer requirements, and regulatory checks.
Improve decision speed
A shared analytics layer lets teams identify issues earlier and respond using timely, trusted data rather than manual spreadsheet collection.
This matters for different personas in different ways:
For executives: the focus is service, cost, working capital, and network efficiency.
For IT teams: the focus is integration, semantic consistency, permissions, and governed analytics at scale.
For business users: the focus is faster answers, lower reporting friction, and clearer exception ownership.
That is why the combination of BI and AI matters. Dashboards alone show what happened. FineBI + Dora helps teams move toward a workflow where users can ask, analyze, summarize, alert, and follow up inside a governed AI workflow.
KPIs that measure logistics performance effectively
A logistics management system should not overwhelm teams with too many metrics. It should provide a focused KPI structure that links execution data to business outcomes. Below are the most useful KPI categories for enterprise logistics reporting.
Cost and efficiency metrics
These metrics help teams understand whether logistics resources are being used effectively and whether process design is economically sound.
Transportation cost per shipment: Total transportation cost divided by number of shipments. Business value: Shows freight efficiency and helps compare carriers, lanes, and routing strategies. AI use:Dora can retrieve this metric through chat, compare it across regions or carriers, and include the variance in scheduled cost briefings.
Cost per order: Total logistics-related cost divided by fulfilled orders. Business value: Useful for cost-to-serve analysis and budgeting. AI use:Dora can summarize which customer segments, warehouses, or order profiles are driving the highest cost per order.
Asset utilization: Share of available truck, dock, equipment, or storage capacity that is actually used. Business value: Helps reduce waste, empty miles, and underused resources. AI use:Dora can flag low utilization patterns and generate a chart-based answer showing where capacity is underused.
Labor productivity: Output per labor hour, such as lines picked, orders packed, or receipts processed. Business value: Indicates warehouse efficiency and staffing effectiveness. AI use:Dora can pull productivity trends for specific shifts or locations and summarize where operational follow-up is needed.
Service and delivery metrics
These are the metrics most closely tied to customer experience and service reliability.
On-time delivery: Percentage of shipments delivered within the promised or scheduled window. Business value: Core indicator of service performance and customer satisfaction. AI use:Dora can monitor threshold breaches, compare carrier performance, and push exception summaries before service review meetings.
Order accuracy: Percentage of orders delivered without item, quantity, labeling, or documentation errors. Business value: Reduces complaints, returns, rework, and service recovery cost. AI use:Dora can retrieve error trends by warehouse or SKU family and support preliminary root-cause exploration.
Fill rate: Percentage of customer demand fulfilled from available stock without delay. Business value: Measures how well inventory and fulfillment support service expectations. AI use:Dora can explain low fill rate periods by linking inventory position, replenishment delay, and order mix through trusted FineBI assets.
Lead time: Time from order receipt to delivery or from shipment release to customer receipt. Business value: Useful for process improvement, customer commitment setting, and network planning. AI use:Dora can compare lead time trends by route, warehouse, or customer segment in chat-based analysis.
Perfect order rate: Percentage of orders delivered on time, complete, damage-free, and with correct documentation. Business value: A high-level service quality KPI that captures multiple execution dimensions. AI use:Dora can build a dashboard-style analysis view showing which component is driving perfect order decline.
Inventory and capacity metrics
These metrics show how well logistics supports inventory flow and infrastructure use.
Inventory turnover: How often inventory is sold or used over a period. Business value: Indicates stock efficiency and working capital health. AI use:Dora can retrieve turnover by category or site and include it in periodic operations summaries.
Days on hand: Estimated number of days inventory can support demand at current usage levels. Business value: Helps balance stock availability with carrying cost. AI use:Dora can alert managers when stock days exceed or fall below target thresholds.
Dock-to-stock time: Time from receipt at dock to inventory availability in storage or systems. Business value: Highlights inbound efficiency and how quickly goods become usable. AI use:Dora can identify sites with rising dock-to-stock time and summarize likely process bottlenecks.
Warehouse capacity use: Share of usable warehouse space or storage positions currently occupied. Business value: Supports storage planning, labor allocation, and expansion decisions. AI use:Dora can push alerts when capacity use approaches predefined thresholds.
Backorder rate: Percentage of orders or lines not fulfilled as requested due to stock or execution constraints. Business value: Direct measure of service disruption and planning gaps. AI use:Dora can detect rising backorder patterns and notify owners with relevant warehouse and SKU context.
How to turn KPI data into action
Tracking KPIs is only the first step. Enterprise value comes from using those metrics to drive action.
A strong KPI management process should do four things:
Identify trends
Look at movement over time, not only the latest number.
Set thresholds
Define what counts as acceptable, risky, or critical performance.
Investigate root causes
Connect KPI shifts to warehouse, carrier, customer, route, labor, or inventory drivers.
Align metrics with business goals
Different businesses will prioritize cost, speed, capacity, service level, or working capital differently.
This is another area where FineBI + Dora helps. FineBI provides the governed dashboard and semantic layer for KPI definitions, filters, and drill paths. Dora helps users move from static monitoring to guided action by retrieving metrics in chat, summarizing anomalies, and pushing follow-up insights to owners.
Enterprise reporting and decision-making in practice
The reporting layer is what makes a logistics management system useful beyond daily transaction processing. It gives leadership teams, operations managers, and analysts a shared view of performance.
What strong logistics reporting should include
Strong logistics reporting should cover multiple decision levels.
When built well in FineBI, these views give enterprises a reliable control layer. They also become the trusted asset base Dora can reference when generating summaries, chart-based answers, and scenario-specific analysis in chat.
Common reporting challenges and how to solve them
Many logistics organizations struggle not because they lack systems, but because they lack consistency across systems.
Common challenges include:
Siloed data
ERP, WMS, TMS, and carrier data may not align by order number, shipment ID, or location hierarchy.
Inconsistent KPI definitions
Different teams may define on-time delivery, fill rate, or cost per order differently.
Delayed updates
Reports built through manual extraction often arrive too late for operational action.
Limited integration
Teams may have dashboards for one function but no end-to-end visibility across logistics flow.
Poor ownership
Reports exist, but no one is accountable for monitoring thresholds or acting on exceptions.
The solution is not only better visualization. It requires:
integrated data connections
semantic standardization
governed KPI definitions
permission-aware reporting
clear responsibility rules
periodic review workflows
FineBI supports this by building trusted semantic assets and reusable dashboards. Dora improves landing capability by turning those assets into practical AI workflows: users can ask questions naturally, retrieve governed metrics, receive scheduled briefings, and get alerts that respect access boundaries.
How leaders use reports to improve performance
Leaders use logistics reports in several high-value decision scenarios:
Budgeting: identifying cost drivers by route, customer, mode, or region
Carrier negotiations: comparing service and cost performance across providers
Network planning: evaluating warehouse loading, route patterns, and capacity needs
Continuous improvement: spotting recurring bottlenecks in inbound, fulfillment, and outbound flows
Service recovery: reviewing exceptions and improving escalation processes
Working capital optimization: balancing inventory levels with service commitments
For executives, this is where AI must be practical. Dora is not an AI experiment. It is a landed digital employee for recurring data work such as logistics briefing, order risk follow-up, carrier review preparation, monthly report generation, and exception summary delivery.
How an AI Data Agent Handles This Scenario
For logistics management system reporting, the most useful Dora role is often a mix of Data Analyst, Daily Briefing Secretary, and Risk Alert Officer depending on the workflow.
Here is a scenario-specific chat request:
“Show me this week’s logistics performance by warehouse and carrier, including on-time delivery, backorder rate, transportation cost per shipment, and the top exceptions that need action.”
[Insert AI Agent Demo Here: Show Dora chat answering a scenario-specific business question, generating a chart/table, and citing the FineBI dashboard or data source used]
In a governed enterprise setup, Dora handles this scenario through a controlled workflow rather than raw prompt guessing.
Relevant Dora digital employee
For this use case, the best fit is usually the Data Analystdigital employee supported by the Daily Briefing Secretary and Risk Alert Officer for periodic summaries and anomaly monitoring.
Data Analystdigital employee: handles natural-language data query, dashboard retrieval, KPI comparison, and preliminary attribution.
Daily Briefing Secretary: sends scheduled daily or weekly logistics performance summaries to managers.
Risk Alert Officer: monitors threshold breaches such as late deliveries, capacity spikes, or abnormal backorder rates and pushes alerts to responsible users.
A 6-step AI workflow for logistics analysis
Retrieve trusted FineBI dashboard or analysis-subject data Dora starts by calling the relevant FineBI logistics dashboards, datasets, or semantic models for shipment performance, warehouse operations, and cost tracking.
Understand KPI definitions, filters, business terms, and semantic rules Dora uses the governed semantic layer to interpret terms like on-time delivery, perfect order, backorder rate, carrier, site, route, and reporting period correctly.
Generate chart-based answers or a dashboard-style analysis view through chat
Instead of returning only text, Dora can provide a structured answer with trend charts, breakdown tables, and exception lists grounded in FineBI assets.
Detect abnormal changes or threshold breaches
If transportation cost per shipment spikes or a warehouse drops below service target, Dora can identify the deviation against configured rules.
Push insights, alerts, or suggested actions to responsible users
The right warehouse manager, logistics director, or service owner receives the relevant exception summary rather than a generic report blast.
Produce follow-up summaries for meetings or management review Dora can generate a concise weekly briefing that highlights KPI movement, top risks, likely drivers, and items needing discussion.
Why FineBI matters as the trusted foundation
AI works best in enterprise logistics when it is grounded in governed data. FineBI provides:
trusted dashboards
consistent KPI definitions
semantic business terms
reusable dimensions and filters
cross-system integration
permission governance
That foundation matters because logistics data is complex. The same shipment may appear differently across ERP, WMS, TMS, and carrier feeds. FineBI helps normalize and model those assets. Dora then operates on top of that trusted layer, making AI responses more controllable and auditable.
How Dora improves execution, not just analysis
Dora adds value beyond one-time Q&A. It helps make logistics reporting operational through:
chat-based access for business users who do not want to navigate multiple dashboards
scheduled summaries before morning operations calls or weekly reviews
anomaly alerts when exceptions exceed thresholds
push notifications to the users who own the issue
follow-up support for recurring meeting prep and action review
This is the practical difference between a generic AI experience and Agentic BI. Dora is designed as an enterprise Data Agent layer with governed AI workflows, skills-based execution, and stronger enterprise fit through permissions, semantic rules, KPI governance, and data quality controls.
It also provides better landing capability than feature-only agent comparisons because the workflow starts from trusted BI assets rather than relying on prompt-only interpretation. That helps reduce token waste, improve response speed, and increase workflow stability compared with raw prompt-only agents.
How to evaluate and adopt the right solution
Choosing the right logistics management system is not just about feature checklists. It is about fit across process complexity, data integration, reporting maturity, and user adoption.
A practical evaluation should include the following.
Business size and shipment complexity
A company with a few domestic routes needs something different from an enterprise with multi-site, multi-carrier, inbound and outbound operations.
Integration requirements
Assess whether the solution can connect with ERP, WMS, TMS, finance, customer service, and partner data sources.
Reporting expectations
Define whether you need only operational screens or also executive dashboards, trend analysis, carrier scorecards, and AI-driven summaries.
Usability
Operations users need low-friction workflows, while managers need easy access to performance views and exceptions.
Scalability
The system should support more locations, more shipment volume, and more KPI scenarios without redesigning everything.
Automation support
Look at planning workflows, exception handling, notifications, and repeatable reporting tasks.
Vendor support and implementation capability
A technically strong platform still fails if rollout, governance, and adoption are weak.
Implementation should start with:
clear ownership
process mapping
baseline KPIs
user training
system integration priorities
reporting design standards
For AI-enabled logistics reporting, include additional evaluation questions:
Are KPI definitions standardized enough for AI retrieval?
Is there a trusted semantic layer behind the dashboards?
Can AI outputs respect permissions and data access rules?
Are alerts, summaries, and follow-up workflows clearly owned?
Can you start with one high-value use case before scaling?
Actionable best practices
The most successful logistics analytics programs usually start with a small set of high-value workflows and expand from there.
1. Standardize KPI definitions, synonyms, filters, and metric ownership
If different teams define on-time delivery or backorder rate differently, reporting confusion will spread into AI outputs too. Document KPI logic, business terms, and ownership clearly.
2. Build a semantic layer inside the BI workflow
Do not let every dashboard define logistics metrics separately. FineBI should act as the trusted BI foundation with reusable metric definitions, dimensions, and governed business language that Dora can understand consistently.
3. Treat data quality as part of the AI implementation
AI does not fix poor logistics data. Missing status events, inconsistent shipment IDs, delayed warehouse updates, and inaccurate inventory records will weaken both dashboards and AI assistant outputs. Clean joins, master data, and event quality first.
4. Start with high-value recurring workflows instead of automating everything
A better starting point is one repeatable use case such as weekly carrier performance review, daily warehouse exception briefing, or backorder risk monitoring. This improves adoption and proves business value faster.
5. Define alert thresholds, responsibility rules, and escalation paths
AI-based alerts only work when someone owns the next step. Set thresholds for cost spikes, service drops, capacity constraints, and exception volume, then map who gets notified and how follow-up is handled.
6. Preserve permission governance so AI outputs respect FineBI access boundaries
Enterprise AI must follow the same access logic as your BI environment. Dora should retrieve and summarize only the data each user is allowed to see.
7. Use human review for AI-generated reports and gradually expand Skills
Start with human-reviewed logistics summaries, meeting briefs, and exception notes. As workflows stabilize, expand Dora Skills to support more scenarios with stronger control and auditability.
Building this manually is complex. FineBI helps teams build trusted dashboards, metrics, and semantic assets. Dora turns those assets into an AI assistant that can answer questions in chat, generate dashboard-style analysis views, push scheduled summaries, monitor anomalies, and follow up with responsible owners.
For logistics management system reporting, this combination is especially practical:
Dora turns those assets into scenario-specific digital employees for briefing, analysis, alerting, and follow-up
FineBI + Dora is not only a BI upgrade; it is a practical fourth-generation Agentic BI path. FineBI provides governed metrics and visual analysis. Dora provides the AI assistant layer for scenario execution, with more controlled Skills, lower token waste, faster execution paths, and more stable workflows than prompt-only agents.
For IT teams, that means the role shifts from building every report manually to optimizing enterprise data connections, semantic layers, data quality, permission governance, and reusable agent Skills.
For business users, it means timely metrics, chat-based answers, scheduled summaries, and exception pushes without waiting for analysts or searching through dashboards.
For executives, it means scenario-based ROI: better logistics visibility, faster operational follow-up, and more repeatable data work delivered through a practical AI digital employee model.
Get Ready-to-Use Dashboard Templates in Fine Gallery
The strongest Dora pitch is scenario + product + service: FineBI provides the trusted BI foundation, Dora provides the AI digital employee, and implementation service connects data, governance, semantic setup, Skills, and rollout.
A logistics management system is software and reporting infrastructure that helps businesses plan, execute, track, and improve the movement and storage of goods. It connects orders, inventory, transportation, warehouses, and exceptions so teams can make faster operational decisions.
Most systems include order and shipment planning, inventory and warehouse coordination, transportation management, tracking and visibility, returns handling, and analytics. The exact mix depends on whether a company uses one platform or integrates several tools such as TMS, WMS, and ERP.
A transportation management system focuses mainly on carrier selection, routing, freight execution, and shipment tracking. A logistics management system is broader because it also covers inventory, warehouse workflows, fulfillment, returns, and performance reporting.
Common logistics KPIs include on-time delivery, logistics cost, order cycle time, inventory accuracy, fill rate, backorder rate, and exception volume. These metrics help teams measure service performance, efficiency, and risk across the logistics process.
Enterprise reporting turns fragmented operational data into trusted dashboards, alerts, and KPI views that leaders can act on quickly. With tools like FineBI and Dora, teams can also ask follow-up questions in natural language and get faster insight into delays, costs, and exceptions.
Product Trial
FineReport
Pixel-perfect reports · Interactive dashboards · Easy data entry · Digital twins