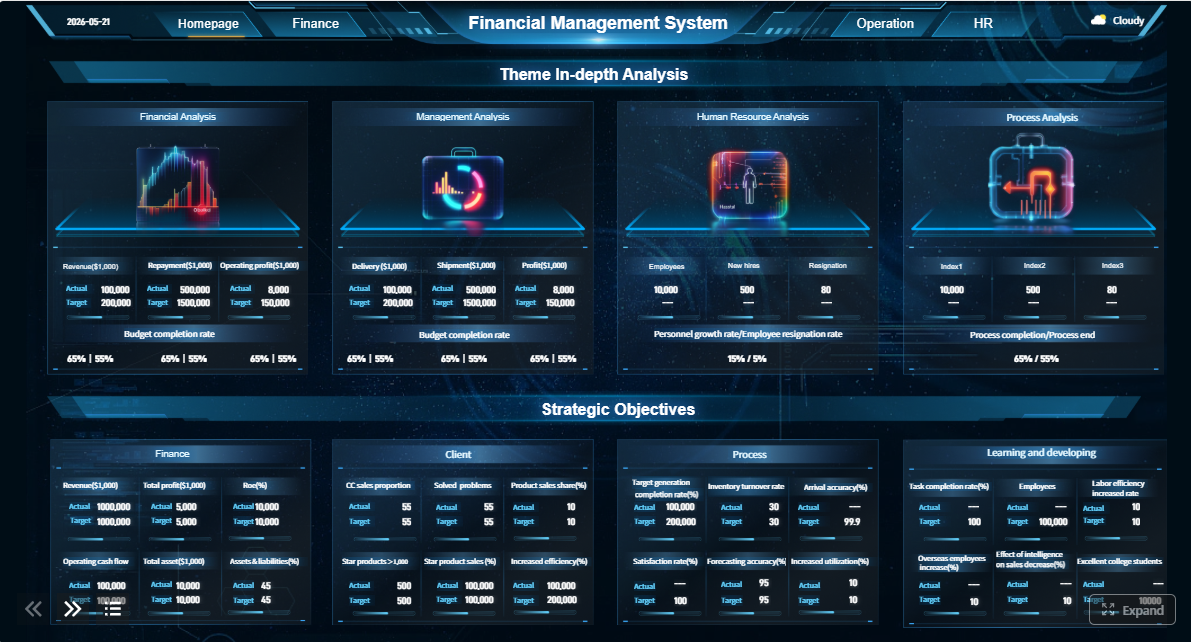
CFOs do not need more finance data. They need a visual financial reporting cockpit that helps executives see performance, understand variance, anticipate cash pressure, and act on margin risk before issues escalate.
A strong executive finance cockpit should do two jobs at once. First, it should provide a trusted reporting and operational view across actuals, plan, forecast, cash, and profitability. Second, it should upgrade report consumption with an AI assistant layer so leaders can ask questions in plain language, receive structured summaries, and push exceptions to owners without waiting for a manual reporting cycle.
With FineReport + Dora, teams can ask for a report summary in chat, generate structured narratives from trusted report assets, receive scheduled briefings, and push exceptions to the right owner.
Click To Try The Dashboard
All reports in this article are built with FineReport
Why visual financial reporting matters in the CFO cockpit
Visual financial reporting matters because executive finance decisions are rarely about a single number. Leaders need to know what changed, why it changed, whether it is temporary or structural, and who must respond.
A well-designed finance cockpit turns financial statements, operational metrics, and forecast signals into a management view that can be read in minutes rather than decoded from spreadsheets over hours.
Show the company’s financial story at a glance
In executive settings, speed and clarity matter. A CFO cockpit should quickly answer:
Are results ahead of or behind plan?
Which drivers explain the gap?
Is liquidity tightening?
Where is margin under pressure?
What needs action this week?
This is where visual financial reporting becomes strategic. Instead of forcing executives to inspect rows of account-level detail, the cockpit uses waterfalls, trend views, alerts, heatmaps, and exception lists to show the financial story in business language.
Reduce time spent decoding spreadsheets
Traditional finance packs often slow decisions because different stakeholders interpret the same numbers differently. A visual cockpit reduces that friction by:
summarizing core KPIs first
linking summary metrics to underlying drivers
separating signal from noise
making unfavorable movements immediately visible
highlighting action items instead of overwhelming leaders with raw detail
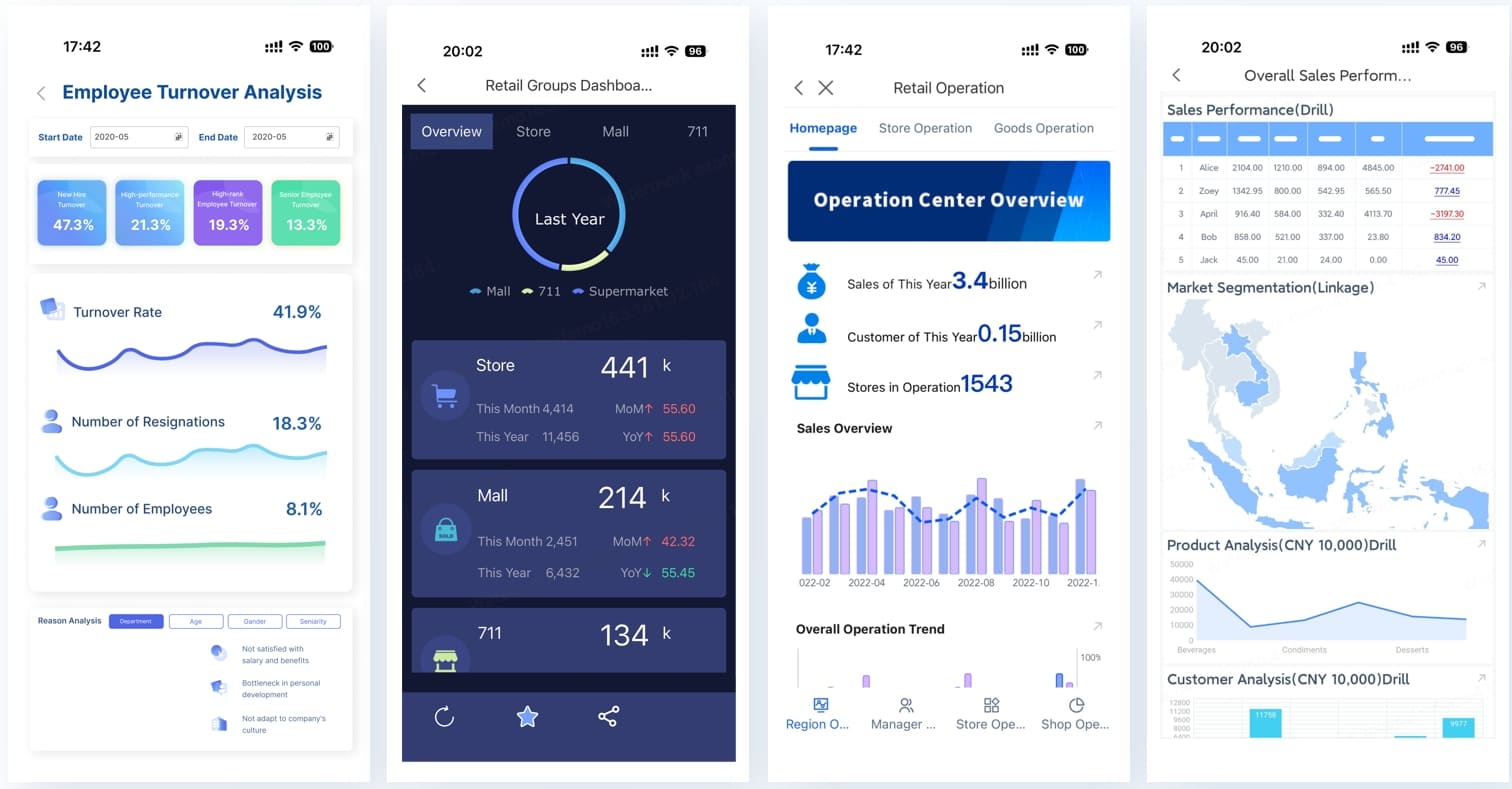
For finance managers and analysts, this also means less time preparing explanatory slides manually. FineReport can standardize the reporting layer, while Dora helps turn that trusted reporting asset into a chat-based AI assistant for report consumption.
Variance, liquidity pressure, and margin exposure can become political if definitions are inconsistent. Executive reporting works only when everyone uses the same KPI logic.
Report Element: Variance to plan Definition: The difference between actual results and budget, plan, or latest forecast. Business value: Helps leadership understand execution performance and planning accuracy. AI use:Dora can summarize the largest favorable and unfavorable variances, explain likely drivers, and include them in a scheduled management briefing.
Report Element: Liquidity pressure Definition: Near-term stress on cash availability caused by inflows, outflows, debt, collections, or working capital constraints. Business value: Supports treasury, operating, and capital allocation decisions before a cash issue becomes urgent. AI use:Dora can monitor thresholds, surface deteriorating trends, and push timely exception alerts to responsible owners.
Report Element: Margin exposure Definition: Risk of profitability decline driven by price, cost, mix, volume, or operational inefficiency. Business value: Helps leaders focus on controllable profit levers rather than only reporting end results. AI use:Dora can generate chart explanations, compare planned versus actual margin, and summarize which segments require follow-up.
Define the decisions your executive finance cockpit must support
The best visual financial reporting starts with decisions, not charts. Before choosing visuals, CFOs should define the recurring decisions the cockpit must support across executive, operating, and board conversations.
Prioritize the questions executives ask most often
Most executive finance cockpits need to answer a small set of recurring high-value questions.
Why are actuals ahead of or behind plan?
This question sits at the center of financial review. Leaders want to know whether performance reflects:
pricing changes
volume shifts
customer mix
cost overruns
timing effects
one-off gains or losses
structural changes in operating performance
A cockpit should make this easy to see through bridge views and segmented drill-down paths.
Where is cash tightening over the next 4 to 13 weeks?
Cash pressure often appears before it is fully visible in monthly statements. A CFO cockpit should show:
current cash position
forecasted inflows and outflows
receivable concentration
payable timing
debt service commitments
covenant headroom
high-risk collection delays
This gives finance and operations a shared view of near-term liquidity risk.
Which products, customers, or business units are driving margin erosion?
Margin issues rarely come from one source. The cockpit should isolate the drivers by segment so management can respond with actions such as repricing, sourcing changes, inventory control, contract review, or production improvement.
Separate strategic, operational, and board-level views
Not every audience needs the same level of detail. One finance data foundation should support different views.
Strategic executive view
This view is typically used by the CFO, CEO, and top leadership team. It should emphasize:
Business unit leaders and functional owners need more actionable detail, such as:
product or customer contribution
plant or region performance
overdue collections
procurement or freight cost shifts
departmental responsibility for unfavorable movement
Board-level view
Board stakeholders usually need a concise narrative focused on:
material variances
risk outlook
liquidity resilience
trend direction
management response plan
FineReport supports this layered reporting model by standardizing the trusted report templates and cockpit views, while Dora can adapt the narrative emphasis by audience through governed AI workflows rather than ad hoc manual rewriting.
Design a visual financial reporting structure that explains variance clearly
A finance cockpit should not just show the numbers. It should explain material movement in a way that reduces interpretation gaps.
Use visual indicators that spotlight material movement
Good finance visuals make exceptions obvious.
Flag favorable and unfavorable changes with clear directional cues
Executives should not have to guess whether movement is good or bad. Use:
consistent color logic
up/down indicators
variance bands
materiality thresholds
period comparisons
annotations for major drivers
The important point is consistency. If red means unfavorable in one view, it should not mean growth in another.
Distinguish one-time effects from recurring operating trends
One of the most common reporting failures is mixing recurring performance with unusual events. A strong cockpit separates:
one-off legal or restructuring costs
temporary demand spikes
project timing shifts
acquisition effects
FX impacts
recurring operating trends
Report Element: One-time adjustment flag Definition: A label or filter identifying non-recurring items that distort period performance. Business value: Prevents leadership from overreacting to temporary noise or underestimating structural weakness. AI use:Dora can reference tagged items in its report summary and clarify whether variance is operational or non-recurring.
Choose the right chart for the finance question
Visual financial reporting becomes more effective when chart choice follows analytical purpose.
Use waterfalls for bridge analysis
Waterfalls are ideal for showing how a starting figure becomes an ending figure through multiple drivers. In a CFO cockpit, this is especially useful for:
revenue bridge
EBITDA bridge
gross margin bridge
cash movement bridge
Report Element: Variance bridge Definition: A step-by-step visual that explains movement from plan to actual or prior period to current period. Business value: Makes performance drivers transparent and easier to discuss in executive reviews. AI use:Dora can summarize each step in the bridge and explain which drivers are material.
Trend lines help leaders see whether an issue is isolated or persistent. This is essential for:
cash trend deterioration
margin compression
expense run-rate acceleration
collections performance
forecast accuracy drift
Use heatmaps for concentration risk
Heatmaps work well when finance needs to show where risk is concentrated, such as:
customer margin exposure
overdue receivables by aging and region
product lines with sustained underperformance
plants with cost spikes
business units with weak working capital conversion
Avoid decorative charts
Finance visuals should be functional. Avoid chart styles that distort scale, hide variance, or make period comparison harder. Executive reporting should prioritize:
comparability
causality
threshold clarity
segment visibility
decision usefulness
Build a one-page executive summary
Every finance cockpit should begin with a one-page summary that answers the leadership team’s first questions before they drill deeper.
Start with headline KPIs
A strong summary often includes:
revenue versus plan
EBITDA or operating profit versus plan
gross margin percentage
operating cash flow
current cash balance
4- to 13-week liquidity outlook
DSO, DPO, and inventory days
top exception items
Link KPIs to the drivers behind change
The summary should connect headline numbers to their causes. For example:
revenue shortfall driven by volume decline in two regions
margin erosion driven by freight inflation and price discounting
cash tightening driven by overdue receivables and capex timing
Make exceptions and decision points more prominent than raw detail
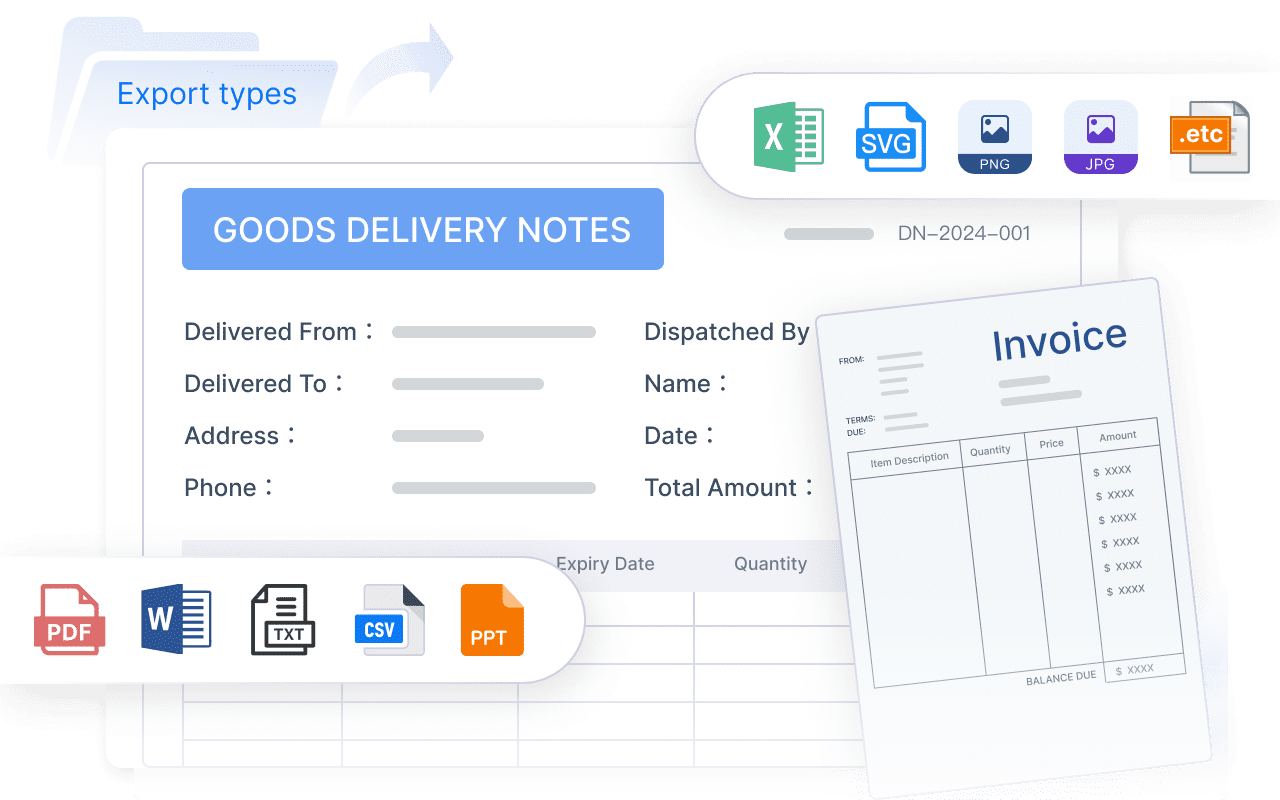
The best executive summaries are not mini ledgers. They are management tools. FineReport can provide a formatted management report and cockpit that combines KPI tiles, bridge visuals, risk lists, and drill paths. Dora then adds a second layer: it can convert that trusted report into a structured report summary, a board-prep narrative, or a follow-up list in chat.
Make cash pressure visible before it becomes a crisis
Cash management is one of the strongest use cases for visual financial reporting because delayed visibility creates real business risk.
Track short-term liquidity with forward-looking views
A CFO cockpit should move beyond historical reporting and show emerging pressure in time for action.
Combine current cash position with forecast drivers
Key inputs include:
bank balances
expected customer receipts
receivable aging and collection probability
payroll cycles
supplier payment timing
tax payments
debt service
planned capex
one-time cash outflows
Report Element: Short-term liquidity forecast Definition: A rolling 4- to 13-week view of expected cash inflows, outflows, and ending liquidity position. Business value: Supports weekly cash control and early intervention before a shortfall becomes critical. AI use:Dora can summarize the outlook, explain which inflows or outflows changed materially, and push weekly briefings to finance and operating leaders.
Highlight early warning signals
Early warning signals should be visible in the cockpit, not buried in commentary. Examples include:
shrinking covenant headroom
large overdue receivables
concentration in a few customers
supplier payment compression
inventory buildup
forecast slippage in collections
delayed cost reduction actions
Report Element: Cash risk alert list Definition: A prioritized list of near-term liquidity threats and threshold breaches. Business value: Helps management focus on the most urgent threats first. AI use:Dora, acting as a Risk Alert Officer, can monitor these exceptions and push alerts with responsible owners and suggested next steps.
Cash visibility matters only if it changes behavior. A strong cockpit links cash outcomes to operational levers.
Show how decisions affect liquidity
Executives should be able to connect cash risk with actions such as:
accelerating collections
rephasing supplier payments
slowing discretionary spend
reducing inventory buys
adjusting promotions or pricing
sequencing capex
reviewing customer credit exposure
Assign owners and timing
The cockpit should not stop at analysis. It should identify:
action owner
due date
expected cash impact
escalation path
status of follow-up
This is a major enterprise AI opportunity. Instead of manually compiling the same update requests each week, Dora can turn the cockpit into a governed AI workflow that retrieves the trusted FineReport view, summarizes the cash situation, flags exceptions, and follows up with owners through scheduled pushes.
Reveal margin risk with driver-based views
Margin risk becomes manageable when it is broken into drivers that business leaders can influence.
Break margin into its core components
An executive cockpit should not report gross margin as a static number alone. It should explain the mechanics behind movement.
Isolate price, volume, mix, labor, material, freight, and overhead effects
A margin bridge should separate the major components of performance:
price realization
sales volume
product or customer mix
direct labor
material cost
freight or logistics
manufacturing overhead
commercial discounts
warranty or quality cost
Report Element: Margin driver bridge Definition: A visual explanation of why margin changed between plan, prior period, and current actuals. Business value: Directs leadership to the controllable profit levers behind profitability shifts. AI use:Dora can generate chart-based answers that describe which drivers explain the majority of margin erosion and whether the issue appears temporary or structural.
Compare planned margin, actual margin, and run-rate margin
This comparison matters because a business can recover from a one-off shock, but it needs a different response if the current run rate implies structural weakness.
Report Element: Run-rate margin view Definition: A forward-looking estimate of profitability based on current operating conditions and recent trends. Business value: Helps leadership judge whether recovery is likely without intervention. AI use:Dora can include run-rate interpretation in a management narrative and highlight where action is required.
Segment risk where action is possible
Not all margin pressure deserves the same level of response. Leaders need to see where action will matter most.
Surface margin exposure by segment
Useful segmentation dimensions include:
product line
customer cohort
channel
region
plant
order type
sales team
contract type
Focus attention on controllable levers
A good cockpit does more than display end results. It points to controllable response areas such as:
repricing specific accounts
renegotiating freight terms
adjusting product mix targets
revising procurement sources
improving plant efficiency
tightening discount approvals
For finance managers and operations leaders, this is where FineReport and Dora work especially well together. FineReport supports the governed report and cockpit structure across profitability views. Dora can act as a Data Analystdigital employee or Report Researcher, enabling natural-language query across trusted reporting assets and turning those views into concise management explanations.
How an AI Data Agent Automates Report Consumption
Once the executive finance cockpit exists, the next problem is report consumption. CFOs, CEOs, business unit leaders, and finance managers still spend time asking analysts to summarize what changed, explain exceptions, prepare meeting notes, and follow up on actions.
FineReport remains the trusted reporting foundation. It provides the formatted reports, management reports, and operational cockpits with governed KPI logic, templates, permissions, and business definitions. Dora does not replace that foundation. Dora turns it into a scenario-specific AI assistant that helps users consume, summarize, push, and follow up on the report.
“Summarize this week’s executive finance cockpit, explain the biggest unfavorable variances versus plan, highlight any cash pressure in the next 8 weeks, and list the business units with the highest margin risk that need follow-up.”
That request is much closer to how executives actually work. They do not want to search through multiple views and rewrite findings manually. They want a trusted answer linked back to the report.
A practical 6-step Dora workflow
Retrieve trusted FineReport assets Dora retrieves the relevant FineReportmanagement report, financial cockpit, variance bridge, cash forecast view, and margin risk report.
Understand KPI definitions and business semantics Dora uses the governed semantic layer, KPI definitions, filters, templates, and business terms already embedded in the reporting environment, so terms like plan variance, run-rate margin, or covenant headroom are interpreted consistently.
Generate a structured report summary Dora creates a structured summary in chat, including headline KPIs, major drivers, chart explanations, and a management narrative suitable for executive review.
Detect exceptions and threshold breaches Dora identifies abnormal cash deterioration, overdue receivables, sustained margin erosion, or material unfavorable variance based on configured thresholds and rules.
Push alerts and briefings to the right users
As a Daily Briefing Secretary or Risk Alert Officer, Dora can send scheduled summaries, weekly finance briefings, or exception pushes to CFOs, controllers, treasury leaders, and business owners.
Create follow-up records and review-ready outputs Dora can generate an owner-based follow-up list, status summary, or weekly review pack so teams can track what actions were requested and what remains unresolved.
Why this AI approach lands better in enterprises
Many teams experiment with raw prompt-based AI, but finance reporting needs more control than a generic model interaction can provide. Dora is better suited to enterprise finance operations because it is designed for skills-based execution, trusted report retrieval, governed semantics, and permission-aware workflows.
That matters in finance because leaders need:
consistent KPI logic
access control by role
auditable outputs
trusted report templates
stable workflow behavior
lower token waste than repeatedly sending large raw data contexts into ad hoc prompts
structured report summaries and chart explanations
scheduled daily or weekly finance briefings
exception alerts for cash and margin risk
owner follow-up and review support
For executives, this means the cockpit becomes a living management routine rather than a passive dashboard. For IT and data teams, it means AI adoption can be grounded in report governance, semantic setup, and reusable Skills instead of one-off experiments.
A visual cockpit creates value only when it becomes part of how the business runs.
Establish governance for data, thresholds, and accountability
Finance reporting fails when people do not trust the numbers or do not know who owns the response.
Define metric ownership, refresh cadence, and escalation rules
Every key metric should have a named owner responsible for:
calculation logic
source mapping
refresh timing
exception threshold definition
escalation path
This is especially important for variance, liquidity, and margin metrics, because these measures often cross finance, sales, operations, and procurement boundaries.
Standardize color logic, labels, and calculation methods
Consistency reduces debate and improves adoption. Standardize:
KPI names
calculation formulas
time windows
threshold bands
color conventions
segment definitions
exception labels
FineReport helps enterprises enforce this reporting standardization. Dora then relies on that trusted structure to provide more accurate and controllable AI outputs.
Review, refine, and evolve the dashboard over time
An executive cockpit should change as the business changes.
Retire low-value charts and add new views
If a chart is rarely used or does not influence a decision, remove it. Replace it with views that answer current management questions, such as:
These are strong landing points because the business value is clear and the reporting routine already exists.
2. Standardize KPI definitions, business terms, and report templates first
This is one of the most important prerequisites for both reporting quality and AI success. If plan variance, free cash flow, or run-rate margin are calculated differently across teams, the cockpit will not be trusted and AI summaries will not be reliable.
3. Build the semantic layer inside the reporting workflow
AI works better when the enterprise already has governed business meaning attached to reports and metrics. FineReport provides the structured reporting foundation, while Dora can use that trusted semantic layer for natural-language query, chart explanation, and scheduled summaries.
4. Define exception rules, alert thresholds, and owner routing for Dora
AI value grows when Dora is connected to action, not just answers. Configure:
materiality thresholds
cash risk rules
overdue collection alerts
margin deterioration triggers
owner assignment logic
escalation timing
This allows Dora to function as a repeatable digital employee rather than a one-off assistant.
5. Preserve permissions and use human review for management narratives
Finance reporting often contains sensitive information by entity, region, customer, or transaction class. Keep FineReport permissions in place so Dora respects access boundaries. Use human review for AI-generated management narratives in the early phase, then gradually expand Skills and automation as confidence grows.
Building this manually is complex. FineReport helps teams standardize trusted reports, operational cockpits, templates, and reporting workflows. Dora turns those assets into an AI assistant that can answer report questions in chat, generate structured summaries, push scheduled briefings, monitor exceptions, and follow up with responsible owners.
For CFO organizations, that means one solution stack can support:
FineReport + Dora is not only a reporting upgrade; it is a practical fourth-generation Agentic BI path. FineReport provides governed reports and operational cockpits. Dora provides the AI assistant layer for scenario execution, with more controlled Skills, lower token waste, faster execution paths, and more stable workflows than prompt-only agents.
Get Ready-to-Use Dashboard Templates in Fine Gallery
The strongest Dora pitch is scenario + product + service: FineReport provides the trusted reporting foundation, Dora provides the AI digital employee, and implementation service connects data, governance, semantic setup, Skills, report templates, permissions, and rollout.
For executives, this is concrete ROI: Dora is not an AI experiment. It is a landed digital employee for recurring finance reporting work such as management report summaries, weekly cash reviews, margin exception alerts, and owner follow-up.
For IT teams, the role shifts from manually rebuilding every output to strengthening enterprise data connections, semantic layers, report governance, permissions, and reusable AI Skills.
For business users, the value is lower friction: timely report summaries, chat-based answers, scheduled briefings, and exception pushes without waiting for analysts to manually prepare every explanation.
If your finance team wants visual financial reporting that does more than display numbers, the next step is to build a cockpit that combines trusted reporting with governed AI execution. That is how finance moves from manually preparing reports to letting AI help query, summarize, alert, and follow up.
Visual financial reporting turns finance data into dashboards and cockpit views that show performance, variance, cash pressure, and margin risk in a format executives can understand quickly. It helps leaders move from reviewing numbers to making decisions.
A strong finance cockpit should combine actuals, budget, forecast, cash, profitability, key KPIs, trend charts, variance bridges, alerts, and exception tracking. The goal is to show what changed, why it changed, and who needs to act.
Use visual bridges, segment views, and drill-down paths to connect high-level gaps to drivers such as price, volume, mix, timing, or cost. This makes it easier for executives to see whether a variance is temporary or structural.
It gives leaders a near-term view of liquidity by showing cash position, forecast inflows and outflows, receivables risk, payable timing, and debt commitments in one place. That visibility helps teams respond before cash pressure becomes urgent.
FineReport provides the trusted reporting layer for dashboards and finance cockpits, while Dora adds an AI assistant for summaries, plain-language questions, scheduled briefings, and exception routing. Together they help teams consume reports faster and act on issues sooner.
Product Trial
FineReport
Pixel-perfect reports · Interactive dashboards · Easy data entry · Digital twins