A quarterly financial report gives finance teams and business leaders a structured view of company performance over a three-month period. It is the reporting layer that helps organizations monitor revenue, cost, profitability, cash, balance sheet health, and operating trends before year-end results arrive.
For finance teams, the value is practical: quarterly reporting turns the close process into decision support. For executives, it creates a timely management view of what is improving, what is slipping, and where action is required. With FineReport + Dora, teams can ask for a report summary in chat, generate structured narratives from trusted report assets, receive scheduled briefings, and push exceptions to the right owner.
Click To Try The Dashboard
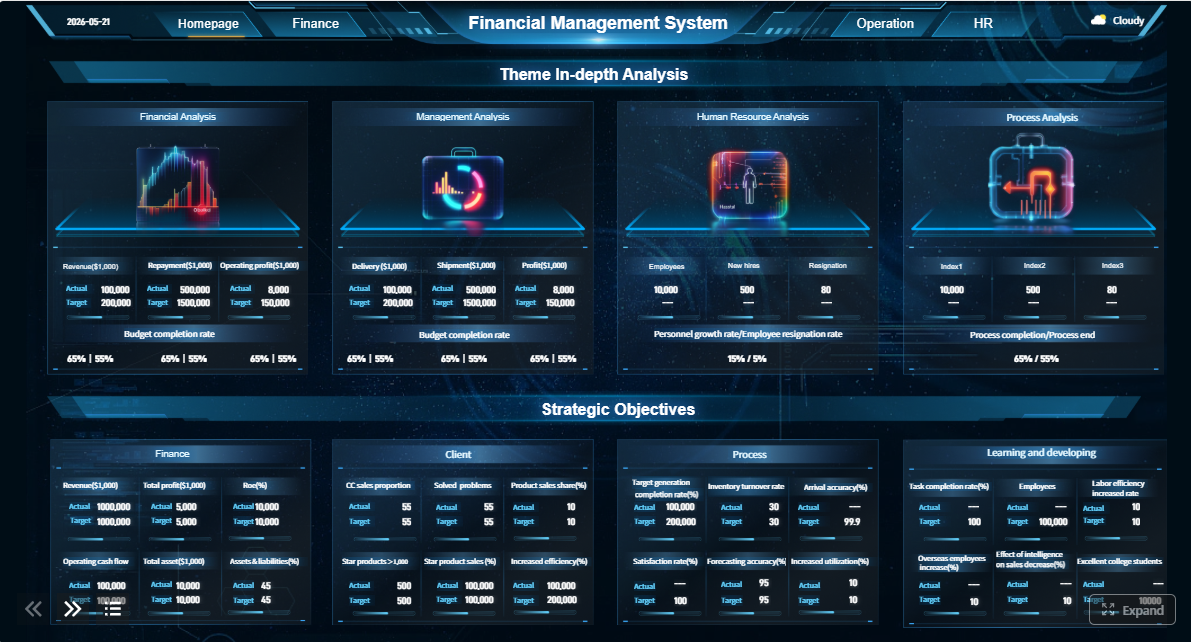
All reports in this article are built with FineReport
What a Quarterly Financial Report Is and Why It Matters
A quarterly financial report is a financial reporting package that summarizes company performance and financial position for a three-month period. In plain language, it answers a simple question: How did the business perform this quarter, what changed, and what needs attention next?
It typically combines formal financial statements, KPI dashboards, variance analysis, and management commentary. Depending on the organization, it may be prepared for internal management, boards, lenders, investors, or regulatory filing purposes.
Who uses a quarterly financial report
A quarterly financial report serves different audiences across the enterprise:
Finance teams use it to validate results, explain variances, and guide planning.
Executives use it to review profitability, liquidity, and business momentum.
Investors and lenders use it to assess performance, risk, and financial stability.
Department leaders use it to understand whether spending, productivity, and targets align with plan.
Operations managers use it to connect financial outcomes to execution issues such as pricing, inventory, labor, and collections.
Why quarterly reporting matters more than annual reporting alone
Annual reporting is necessary, but it is too slow for active business management. Waiting until year-end can hide deteriorating margins, rising receivables, weak cash conversion, or spending overruns that should have been addressed earlier.
A quarterly financial report supports faster decisions because it helps teams:
identify changes in revenue and margin trends sooner
compare actuals against budget and forecast while there is still time to adjust
monitor liquidity and debt pressure before they become urgent issues
prepare management, board, and lender discussions with better evidence
hold departments accountable on a recurring cadence
For executives, this is where quarterly reporting becomes a concrete ROI tool. It is not just a compliance artifact. It is the operating rhythm that supports budget control, investment prioritization, and risk response.
For IT and reporting teams, the challenge is different. The problem is not creating one report once. It is maintaining trusted definitions, distributing the latest version, and helping users consume the information quickly. That is where a governed reporting foundation plus an AI assistant becomes valuable.
A strong quarterly financial report is not just a stack of statements. It is a structured package that combines numerical accuracy with business interpretation.
Income statement
The income statement shows financial performance during the quarter. It usually includes:
Finance teams use the income statement to understand whether the company is growing profitably or simply increasing sales with weaker margins.
Key review questions include:
How did current-quarter revenue compare with the same quarter last year?
Were gross margins stable, improving, or under pressure?
Which operating expense categories exceeded budget?
Did net income track with management expectations?
In practice, the income statement becomes most useful when paired with variance views:
Quarter vs. prior quarter
Quarter vs. same quarter last year
Actual vs. budget
Actual vs. latest forecast
Quarter and year-to-date views
Report Element: Revenue and profit summary Definition: A structured view of sales, direct costs, operating costs, and profit outcomes for the quarter. Business value: Helps management evaluate growth quality, pricing power, and cost control. AI use:Dora can summarize the quarter’s earnings picture, explain major margin changes, and include this section in a scheduled management briefing.
Balance sheet
The balance sheet shows the company’s financial position at the end of the quarter. It focuses on:
assets
liabilities
equity
This section helps finance leaders assess whether profit performance is supported by a healthy financial structure. A company may show accounting profit while facing working capital pressure, rising leverage, or poor liquidity.
Common balance sheet focus areas include:
cash and cash equivalents
accounts receivable
inventory
prepaid and other current assets
accounts payable
short-term and long-term debt
accrued liabilities
retained earnings and equity changes
Management often pays close attention to:
Working capital
Debt levels
Current ratio
Liquidity trend
Receivable and inventory build-up
Report Element: Quarter-end financial position Definition: A view of what the company owns, owes, and retains at the end of the reporting period. Business value: Supports liquidity management, debt oversight, and capital allocation decisions. AI use:Dora can explain shifts in working capital, highlight unusual movements in debt or receivables, and link them back to source reports in FineReport.
The cash flow statement shows how cash moved during the quarter across three areas:
Operating cash flow
Investing cash flow
Financing cash flow
This section is critical because reported profit and actual cash movement are not the same. A company can be profitable on paper but still experience cash strain due to receivables growth, inventory increases, capital expenditure, or debt servicing.
Finance teams use cash flow analysis to answer questions such as:
Is the business generating cash from operations?
Are investments being funded sustainably?
Has financing activity increased because of weaker internal cash generation?
Are there signs of future liquidity pressure?
Report Element: Cash movement analysis Definition: A breakdown of where cash came from and where it was used during the quarter. Business value: Helps leaders judge short-term resilience and funding capacity. AI use:Dora can generate a structured explanation of why operating cash flow differs from net income and flag cash conversion issues for follow-up.
Notes, commentary, and management discussion
Numbers without context often create confusion. The notes and commentary section explains what changed and why.
Typical items include:
one-time gains or losses
accounting adjustments
restructuring or impairment effects
seasonal impacts
major contract wins or losses
supply chain or labor issues
litigation or compliance risks
debt covenant concerns
forward-looking priorities
This is also the section that makes quarterly reporting more accessible to non-financial readers. Executives, department leaders, and boards often rely on management commentary to understand whether the reported numbers reflect structural change or temporary noise.
Report Element: Management discussion and narrative Definition: Written explanation of major financial changes, unusual events, risks, and business priorities. Business value: Improves interpretation accuracy and decision quality. AI use:Dora can turn approved financial and operational data into a structured report summary, chart explanation, and management narrative draft for review.
A useful quarterly financial report goes beyond the three statements. It should include KPIs that help readers quickly assess performance, liquidity, efficiency, and emerging risk.
Profitability and margin metrics
Profitability metrics show whether revenue is translating into healthy earnings.
Gross margin
Definition:Gross profit divided by revenue. Business value: Indicates pricing strength, product mix, and direct cost control. AI use:Dora can explain quarter-over-quarter or year-over-year margin compression and point users to relevant product, customer, or cost reports.
Operating margin
Definition: Operating income divided by revenue. Business value: Shows whether the company is managing overhead and operating leverage effectively. AI use:Dora can summarize which expense categories drove margin variance and include them in a finance review briefing.
EBITDA
Definition: Earnings before interest, taxes, depreciation, and amortization. Business value: Commonly used to evaluate operating performance and lender-facing performance trends. AI use:Dora can retrieve the approved calculation logic from the trusted semantic layer and answer chat-based questions consistently.
Net profit margin
Definition: Net income divided by revenue. Business value: Reflects bottom-line earnings quality after all expenses and financing effects. AI use:Dora can produce a chart-based answer showing whether the decline came from gross profit pressure, operating expenses, interest burden, or tax effects.
Liquidity and cash flow metrics
Liquidity metrics help finance teams judge whether the business can meet near-term obligations and continue operating smoothly.
Operating cash flow
Definition: Cash generated from core business operations. Business value: Shows whether the company’s activities are producing usable cash. AI use:Dora can summarize operating cash drivers and highlight mismatches between profit growth and cash generation.
Free cash flow
Definition: Operating cash flow minus capital expenditures. Business value: Indicates how much cash remains for debt service, reinvestment, or reserves. AI use:Dora can include free cash flow trends in board-ready briefings and flag negative movements.
Current ratio
Definition: Current assets divided by current liabilities. Business value: Measures short-term liquidity coverage. AI use:Dora can explain if the ratio changed because of inventory build, receivables increase, payable reduction, or debt reclassification.
Cash runway
Definition: Estimated time available before cash reserves are exhausted, where relevant. Business value: Useful for cash-sensitive or growth-stage businesses. AI use:Dora can push scheduled liquidity summaries and threshold-based warnings to finance leadership.
These metrics connect financial outcomes to operational discipline.
Revenue growth
Definition: Change in revenue compared with prior period or prior year. Business value: Indicates business momentum and market performance. AI use:Dora can answer natural-language questions about which segment or department contributed most to growth.
Accounts receivable turnover
Definition: Revenue or credit sales relative to average receivables. Business value: Shows collection efficiency and working capital discipline. AI use:Dora can highlight deteriorating collection patterns and trigger follow-up to owners.
Inventory turnover
Definition: Cost of goods sold relative to average inventory. Business value: Measures inventory efficiency and helps identify slow-moving stock risk. AI use:Dora can combine inventory and margin signals to surface operational issues in a finance summary.
Days sales outstanding
Definition: Average number of days it takes to collect receivables. Business value: Tracks cash conversion and credit control effectiveness. AI use:Dora can monitor threshold breaches and push exceptions to finance or business teams for action.
Variance and trend analysis
Variance and trend analysis turns static reporting into management insight.
Budget variance
Definition: Difference between actual results and budget. Business value: Supports accountability and course correction. AI use:Dora can generate structured commentary on major favorable and unfavorable variances.
Forecast variance
Definition: Difference between actual results and latest forecast. Business value: Helps evaluate forecast accuracy and business change speed. AI use:Dora can summarize which assumptions were missed and where revised planning is needed.
Year-over-year trend
Definition: Comparison with the same quarter last year. Business value: Adjusts for seasonality and shows true directional change. AI use:Dora can create chart explanations that help executives understand trend lines without reviewing every worksheet.
Multi-quarter trend line
Definition: Performance pattern across several recent quarters. Business value: Helps identify steady improvement, slowdown, or emerging structural issues. AI use:Dora can prepare recurring trend briefings and exception summaries before management meetings.
How Finance Teams Prepare and Use a Quarterly Financial Report
The quality of a quarterly financial report depends on both accounting discipline and reporting workflow design.
Preparation workflow
Finance teams usually follow a sequence like this:
gather trial balance and subledger data
reconcile key accounts
close the books for the quarter
validate supporting schedules
review unusual transactions and one-time items
align with operations, sales, HR, and leadership on assumptions
finalize management adjustments and presentation views
This process is often harder than it looks because data may come from multiple systems, business units, and spreadsheet models. Even when the numbers are right, teams still need to package them in a way that leaders can use quickly.
Review and reporting process
Once the quarter is closed, finance usually builds a reporting package that includes:
compliance with reporting requirements where applicable
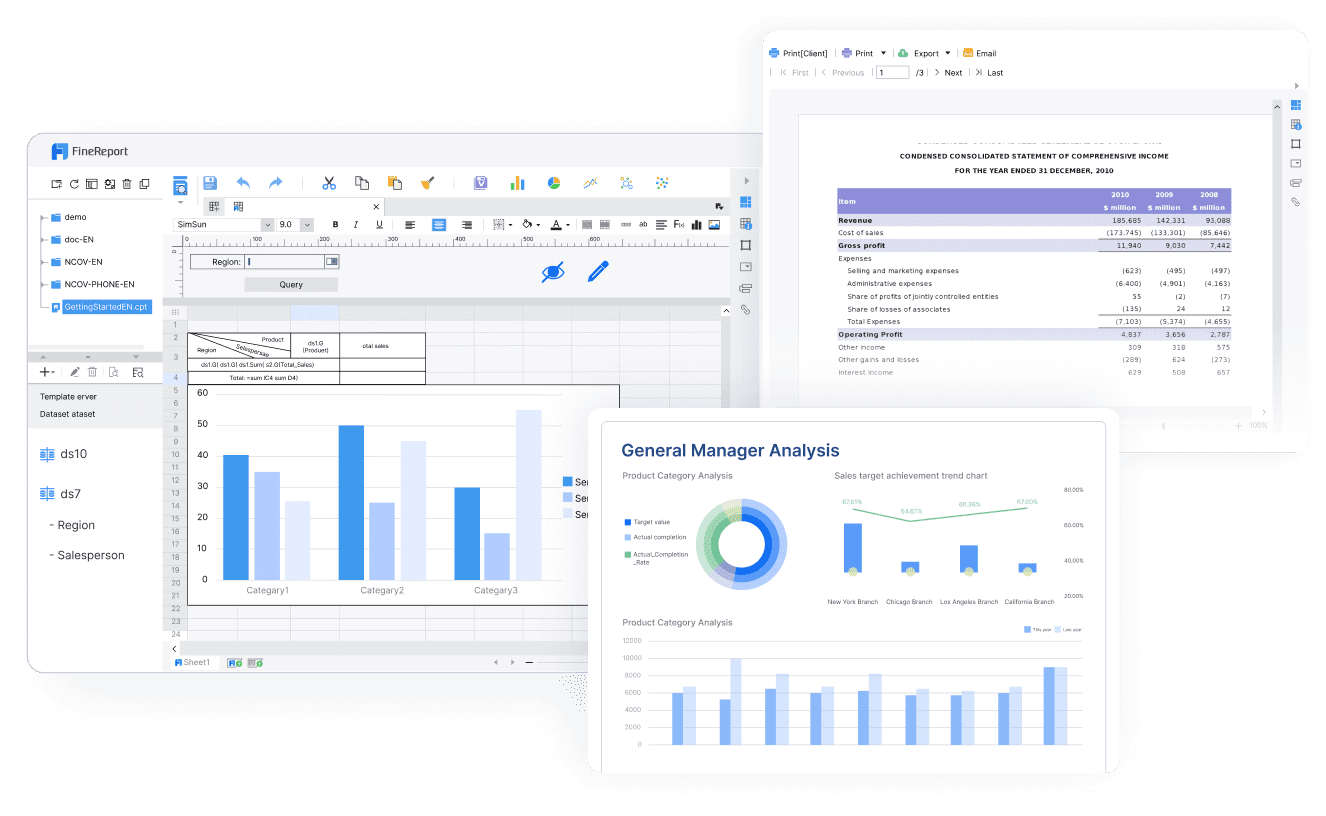
This is why the reporting foundation matters. FineReport helps teams standardize quarterly financial report templates, statement layouts, management packs, and operational cockpits so reporting becomes repeatable instead of manually rebuilt each quarter.
Decision-making use cases
A quarterly financial report is ultimately used to support action. Typical use cases include:
adjusting departmental budgets
tightening discretionary spending
managing collections and cash
re-prioritizing capital expenditures
reviewing pricing or cost initiatives
preparing board updates
supporting lender conversations
assigning accountability for underperformance
For business users, the biggest friction is often not lack of data, but slow access to interpretation. They may receive the report but still need analysts to explain what changed. That creates bottlenecks. A governed AI assistant layer helps close that gap.
A quarterly financial report does not deliver value just because it exists. Value comes when finance leaders, executives, and department owners can consume it quickly, understand it correctly, and act on it consistently.
This is where Dora, FanRuan’s enterprise Data Agent platform, adds a practical AI layer on top of trusted reporting assets. FineReport remains the reporting foundation. It provides the formatted financial statements, KPI dashboards, management packs, and semantic structure. Dora turns that foundation into a scenario-specific AI assistant or AI digital employee for recurring financial reporting workflows.
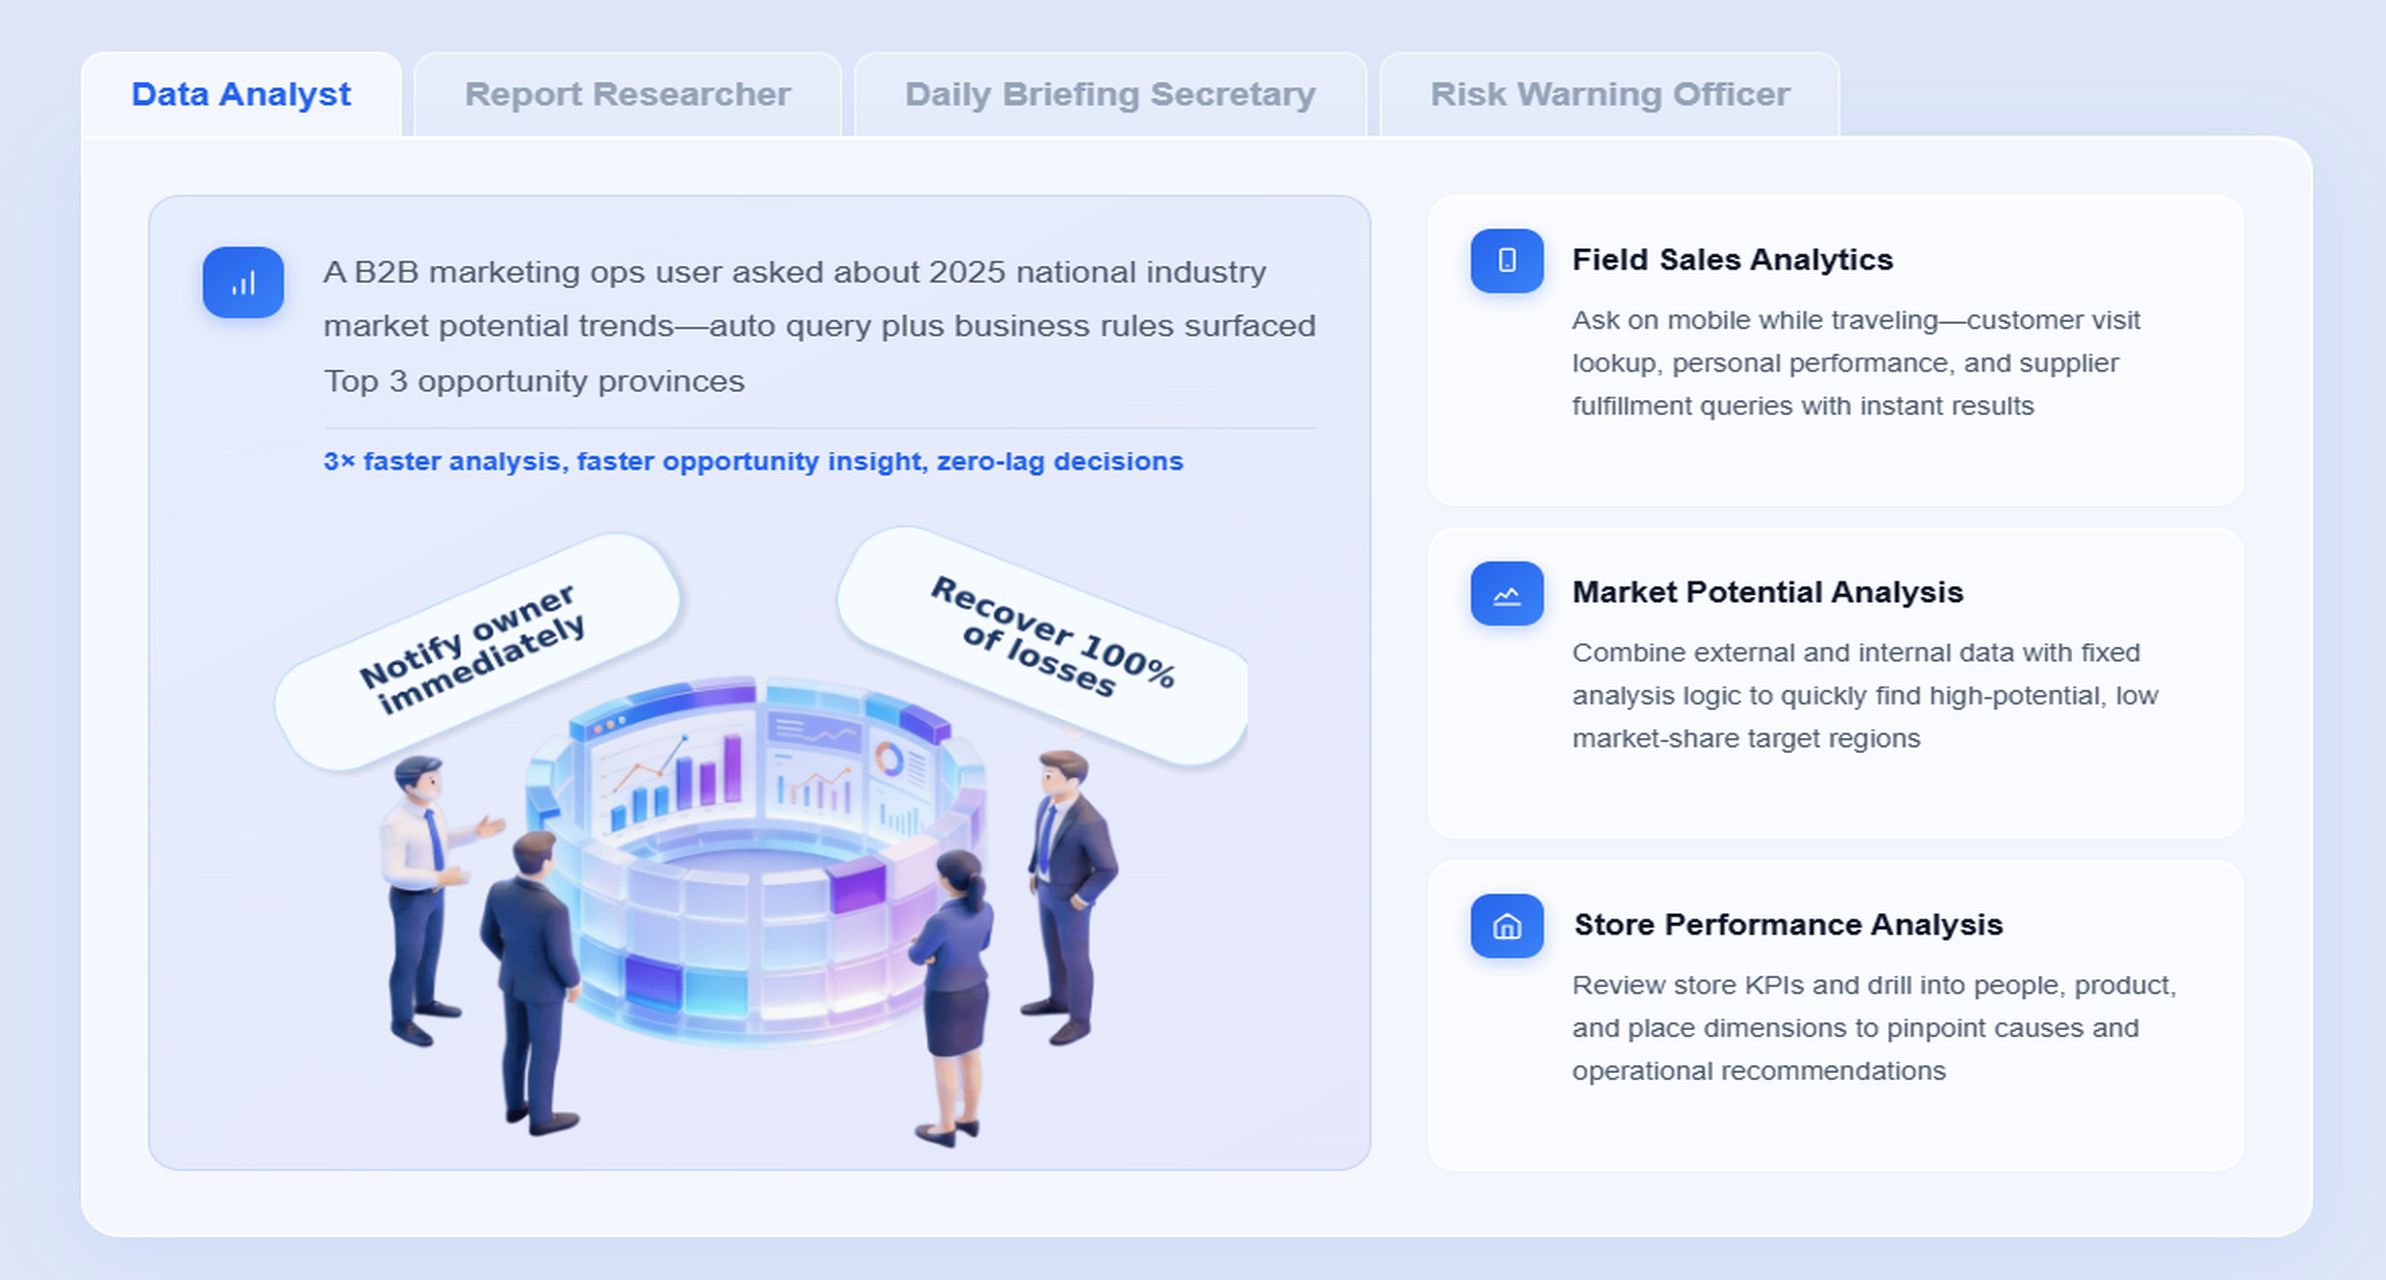
For quarterly reporting, the most relevant Dora digital employees are:
Report Researcher for structured report summaries and chart explanations
Daily Briefing Secretary for scheduled finance briefings and meeting prep
Risk Alert Officer for liquidity, variance, and threshold-based exception monitoring
A concrete chat-style example
A finance director could ask:
“Summarize this quarter’s financial report, highlight the biggest gross margin and cash flow variances versus budget, and list the departments that need follow-up.”
Instead of searching through multiple reports and manually drafting commentary, Dora can respond with a structured answer grounded in approved FineReport assets.
A practical AI workflow for quarterly financial reporting
Retrieve trusted FineReport report or financial cockpit data Dora accesses approved quarterly statements, KPI dashboards, variance tables, and supporting finance reports built in FineReport.
Understand KPI definitions, report templates, filters, and business terms Dora uses the governed semantic layer to interpret terms like gross margin, free cash flow, DSO, budget variance, and business-unit filters correctly.
Generate a structured report summary through chat
It produces a management-ready summary of revenue, profit, balance sheet, and cash flow performance, plus chart explanations and variance commentary.
Detect exceptions and emerging risk Dora identifies threshold breaches such as margin decline, weak operating cash flow, rising receivables, or current ratio deterioration.
Push alerts and follow-up items to responsible users
Relevant department leaders can receive summaries, exception notices, and suggested next-review actions through scheduled or event-based pushes.
Produce follow-up records and recurring briefings Dora can compile a weekly or post-close finance briefing so leadership reviews key changes without rebuilding the same commentary each cycle.
Why the FineReport foundation matters
Enterprise finance teams cannot rely on raw prompt-only AI for important reporting scenarios. Quarterly financial reporting depends on:
governed KPI definitions
approved statement templates
permission control
trusted data connections
consistent period logic
documented commentary structure
FineReport provides that trusted reporting and semantic foundation. Dora works on top of it, so users can ask natural-language questions over approved financial assets rather than over disconnected spreadsheets or uncontrolled text inputs.
That matters for enterprise landing capability. A generic AI tool may generate text, but it does not automatically understand the company’s approved definition of EBITDA, its quarter-close structure, or who is allowed to see which entity-level report. Dora is designed for governed AI workflow execution, with stronger enterprise fit through permissions, semantic rules, KPI governance, report templates, and data quality discipline.
How Dora improves execution after the report is published
Dora helps finance teams move beyond “report sent” to “report understood and acted on” through:
Natural-language query over trusted reporting assets
Structured report summaries and chart explanations
Scheduled finance briefings for executives
Exception alerts for margin, liquidity, or variance breaches
Push notifications to responsible owners
Follow-up records for recurring review workflows
This makes Dora more than an interface layer. It acts as a scenario-based Agentic BI execution layer. Compared with feature-only agent comparisons or raw prompt-only workflows, Dora is designed for more controllable Skills-based execution, lower token waste, faster execution paths, and more stable workflows in enterprise reporting scenarios.
For executives, the message is simple: this is not an AI experiment. It is a landed digital employee model for recurring reporting work such as quarterly management packs, finance risk summaries, variance follow-up, and cash monitoring.
For IT teams, the role shifts from manually building every output to optimizing data integration, semantic layers, permissions, quality controls, report templates, and reusable agent Skills.
For business users, the benefit is lower operating friction. They get timely report summaries, chat-based answers, scheduled briefings, and exception pushes without waiting for analysts to re-explain the same report.
Reporting Requirements, Common Questions, and Best Practices
Quarterly financial reporting expectations vary by company type and stakeholder needs, but several common principles apply.
Regulatory and stakeholder requirements
Public companies, private businesses, lenders, and internal management often expect different reporting formats and levels of disclosure.
Common differences include:
filing timelines
required statements and note disclosures
degree of comparative presentation
whether the report is externally filed or internally distributed
narrative expectations for risks and unusual items
industry-specific or jurisdiction-specific presentation requirements
Finance teams should confirm the applicable reporting framework and audience expectations early in the process. Internal management reporting may prioritize speed and operational analysis, while external reporting may require more formal disclosure structure.
Common questions finance teams ask
What if numbers change after close?
Post-close changes should be handled through a documented review and adjustment process. The key is to preserve version control, explain changes clearly, and ensure stakeholders know which report version is final.
With FineReport, teams can manage standardized report outputs and update governed reporting packages more consistently. Dora can then summarize the updated version and communicate what changed.
How much detail should a quarterly financial report include?
It should include enough detail to explain material changes without overwhelming readers. Senior executives usually need summarized statements, KPIs, major variances, and concise commentary. Functional leaders may need more drill-down views.
A best practice is to maintain a layered reporting model:
executive summary
core statements and KPIs
variance analysis
supporting detail by function or entity
How should nonrecurring items be explained?
Nonrecurring items should be clearly identified, quantified, and separated from underlying operating trends where appropriate. This helps readers avoid drawing the wrong conclusion about ongoing performance.
Dora can help draft structured explanations, but finance should still review and approve AI-generated narratives, especially for sensitive or external-facing reporting.
This is also essential for AI readiness. Dora performs better when FineReport provides a stable semantic layer and approved reporting logic.
2. Focus commentary on material variances
Do not explain every minor movement. Focus attention on changes that affect decision-making, such as margin deterioration, cash pressure, receivable build-up, debt movement, or missed forecasts.
AI-specific benefit:
Dora can summarize the full report, but highlight only the most material exceptions for management review.
3. Treat data quality as part of the AI implementation
AI does not fix weak finance data. If source mappings, reconciliations, or KPI rules are inconsistent, the AI layer will inherit those issues.
Best practice:
improve data quality and reconciliation discipline before broad AI rollout
validate semantic rules and period logic
ensure finance-approved source reports are the retrieval layer
4. Start with high-value recurring reports
Do not try to automate every finance output first. Start with recurring, high-friction scenarios such as:
quarterly management packs
board finance summaries
budget vs. actual variance briefings
liquidity and receivables alerts
AI-specific benefit:
Dora digital employees are strongest when applied to repeatable reporting workflows with clear templates, responsibilities, and thresholds.
5. Preserve permissions and human review
Quarterly financial reports often include sensitive entity, department, payroll, or cash information. AI outputs must respect the same access controls as the underlying reports.
Best practice:
keep FineReport permissions as the governance boundary
FineReport + Dora for Quarterly Financial Reporting
Building an effective quarterly financial reporting workflow manually is complex. Finance teams need trusted statements, repeatable templates, variance logic, management commentary, permissions, and timely distribution across multiple audiences.
FineReport helps teams standardize trusted reports, operational cockpits, templates, and reporting workflows. Dora turns those assets into an AI assistant that can answer report questions in chat, generate structured summaries, push scheduled briefings, monitor exceptions, and follow up with responsible owners.
For the quarterly financial report scenario, the combined value is clear:
Dora turns that foundation into an enterprise Data Agent
It enables natural-language report consumption, structured summary generation, exception retrieval, scheduled finance briefings, and governed follow-up workflows.
This matters because quarterly reporting is a classic repeatable enterprise scenario. Every quarter, finance teams close, review, explain, distribute, and follow up. FineReport + Dora helps organizations move from manual report preparation and fragmented interpretation to a more governed model where AI helps people query, summarize, report, push, alert, and follow up.
FineReport + Dora is not only a reporting upgrade; it is a practical fourth-generation Agentic BI path. FineReport provides governed reports and operational cockpits. Dora provides the AI assistant layer for scenario execution, with more controlled Skills, lower token waste, faster execution paths, and more stable workflows than prompt-only agents.
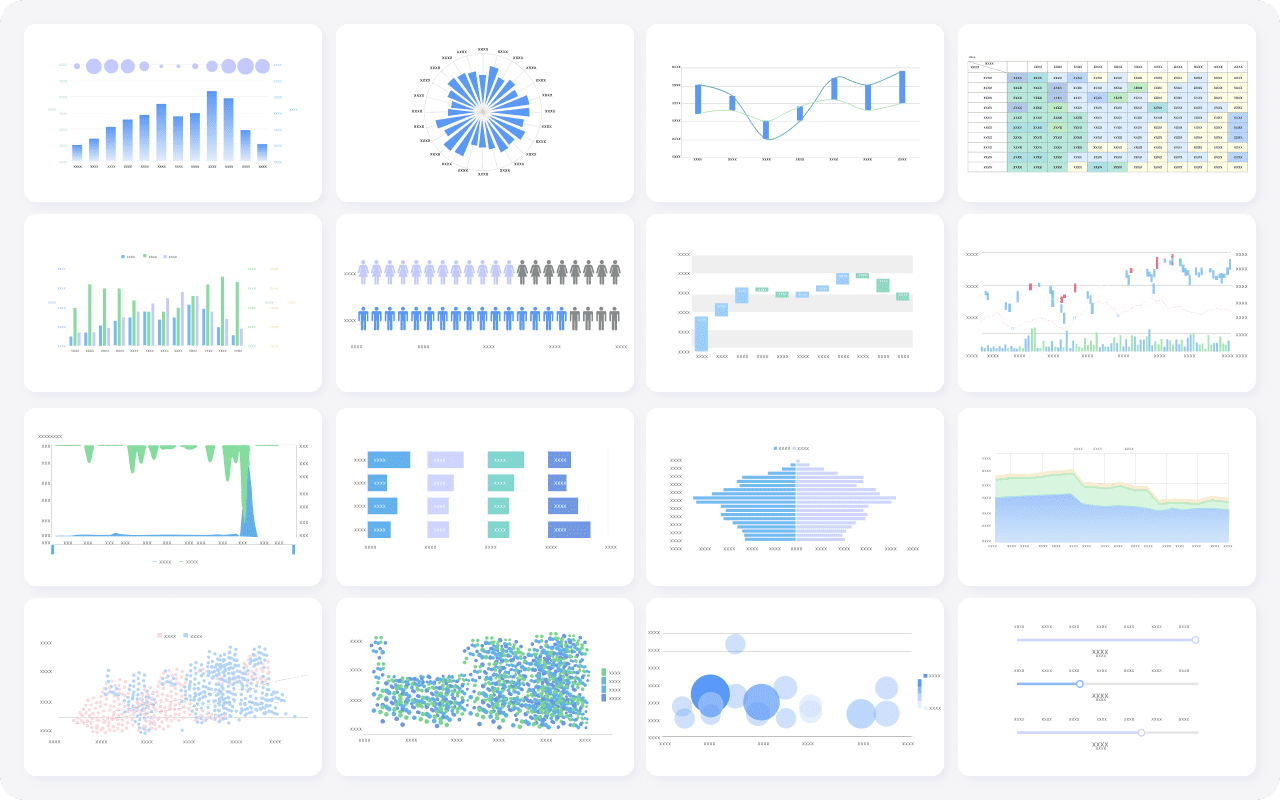
Get Ready-to-Use Dashboard Templates in Fine Gallery
The strongest Dora pitch is scenario + product + service: FineReport provides the trusted reporting foundation, Dora provides the AI digital employee, and implementation service connects data, governance, semantic setup, Skills, report templates, permissions, and rollout.
If your finance team wants quarterly reports that are not just produced, but actually consumed and acted on faster, this is the practical path.
A quarterly financial report usually includes the income statement, balance sheet, cash flow statement, KPI summaries, variance analysis, and management commentary. Together, these sections explain performance over a three-month period and highlight what changed.
It helps finance teams spot revenue, margin, cash, and working capital issues before year-end. This makes quarterly reporting a practical tool for faster decisions, better forecasting, and stronger accountability.
Common KPIs include revenue growth, gross margin, operating profit, net income, cash flow, working capital, current ratio, and accounts receivable trends. The right mix depends on the company’s business model and reporting goals.
A quarterly financial report gives a more frequent view of business performance, usually covering one three-month period plus year-to-date comparisons. An annual report provides a broader year-end picture but is less useful for timely operational decisions.
FineReport can centralize trusted financial data into dashboards and structured reports, while Dora can generate summaries, answer questions in chat, and send scheduled briefings. This helps teams reduce manual reporting work and speed up insight delivery.
Product Trial
FineReport
Pixel-perfect reports · Interactive dashboards · Easy data entry · Digital twins