If you are searching for the best ads reporting tool in 2026, you are probably trying to solve a very practical problem: how to turn scattered campaign data into reports that are easy to understand, quick to update, and useful for decision-making.
For agencies, that usually means white-label client dashboards, scheduled reports, and repeatable templates. For in-house marketing teams, it often means cross-channel visibility, clear ROI tracking, and executive-ready summaries. For freelancers and consultants, the priority is usually speed, affordability, and minimal setup effort.
An effective ads reporting tool should do more than display metrics. It should help you combine data from platforms like Google Ads and Meta Ads, reduce manual spreadsheet work, standardize reporting across accounts, and make performance easier to explain to stakeholders.
AgencyAnalytics is built specifically for agencies that need to manage recurring client reporting at scale.
Strengths
Agency-oriented workflow
Broad marketing integrations
White-label reporting
Reusable templates
Client reporting features designed for recurring delivery
Its value is usually strongest when reporting is tied closely to account management and client communication.
Weaknesses
May feel limiting for teams needing highly custom analytics logic
Better suited to standard reporting workflows than deep BI-style analysis
Less ideal if your reporting process depends on highly bespoke data models
Best-fit use cases
AgencyAnalytics is a strong fit for:
SEO and PPC agencies
Multi-client marketing firms
Teams needing efficient, repeatable white-label reporting
How these ads reporting tools compare on the features that matter most
Integrations and channel coverage
For any ads reporting tool, integrations are the starting point. If the platform cannot reliably connect to your core channels, everything else matters less.
What to look for
Most teams need support for:
Google Ads
Meta Ads
LinkedIn Ads
Microsoft Ads or other PPC platforms
Web analytics and conversion sources
Possibly CRM or ecommerce systems for ROI context
Comparison
DashThis covers common marketing and ad platforms well for standard reporting workflows.
Whatagraph is strong for multi-channel marketing visibility and often appeals to teams that want many marketing sources in one place.
Looker Studio is strong with Google data and can be extended through connectors, but connector quality and maintenance can vary.
AgencyAnalytics offers broad marketing integrations tailored to agency reporting needs.
If your main priority is unified paid media reporting across channels, Whatagraph and AgencyAnalytics are often strong shortlists. If you want maximum custom flexibility and are comfortable managing the setup, Looker Studio can still be attractive.
Dashboard customization and usability
There is always a trade-off between speed and flexibility.
Tools built for speed
DashThis
AgencyAnalytics
These are often easier to launch quickly because they emphasize templates and standard workflows.
Tools built for flexibility
Looker Studio
This is better for custom report design, but it usually requires more work.
Tools balancing visual quality and usability
Whatagraph
This typically appeals to teams that want attractive reporting without building everything manually.
When evaluating dashboard usability, pay attention to:
How quickly a new report can be built
Whether non-technical users can edit reports
Whether branding and layout changes are easy
Whether stakeholders can interpret the report without explanation
Automation, accuracy, and client delivery
A good ads reporting tool should reduce manual work without creating trust issues around data freshness.
Key questions to ask
Can reports be scheduled automatically?
How often does data refresh?
Are live dashboards easy to share?
Can reports be sent to clients or executives without extra formatting?
How much maintenance is needed after initial setup?
Comparison
DashThis performs well for recurring automated client reporting.
Whatagraph is strong for stakeholder-friendly dashboards and scheduled delivery.
Looker Studio can support automated reporting, but data freshness and connector reliability depend on the configuration.
AgencyAnalytics is designed around agency delivery workflows, which is a major advantage for recurring client communication.
For many agencies, the real value of an ads reporting tool is not just dashboard creation. It is the reduction in weekly reporting labor.
Pricing matters, but total reporting cost includes more than subscription fees.
Hidden costs to consider
Setup time
Ongoing maintenance
Connector fees
Extra seats or client accounts
Time spent fixing broken reports
Manual cleanup before stakeholder delivery
General value positioning
Looker Studio is often the lowest-cost entry point, but may require more internal time.
DashThis can provide strong value if quick setup saves hours every month.
Whatagraph may justify a higher cost for teams that prioritize visual communication and broader marketing reporting.
AgencyAnalytics often delivers value to agencies through workflow efficiency rather than raw dashboard flexibility.
The right choice depends on whether your biggest constraint is budget, time, technical capacity, or client reporting scale.
Which tool is best for your team?
Best for agencies
For agencies, AgencyAnalytics is often one of the most practical choices because it aligns closely with client reporting workflows, white-label needs, and repeatable templates.
DashThis is also a strong contender if your priority is simpler, faster client reporting with minimal setup.
Best for in-house marketing teams
For in-house teams, Whatagraph is often a compelling choice when multiple stakeholders need polished, cross-channel reporting.
Looker Studio may also be a strong fit if your team wants more control and already works heavily with Google data.
Best for custom reporting on a budget
Looker Studio is usually the leading option here. It offers strong flexibility and low entry cost, especially for teams with in-house analytical capability.
The trade-off is that lower software cost may come with higher time investment.
Best for fast setup and ease of use
DashThis stands out for teams that want polished recurring reports quickly without a long implementation cycle.
That makes it especially attractive for consultants, freelancers, and agencies that need to move fast.
Practical recommendations before you choose an ads reporting tool
Start with your reporting workflow, not the feature list.
If you send recurring client reports, white-labeling and automation may matter more than advanced customization.
Audit your core data sources first.
Make sure the tool supports your real ad mix, not just your main platform.
Estimate maintenance effort honestly.
A flexible tool can become expensive if your team spends too much time fixing reports.
Test reporting outputs with the actual audience.
Executive teams, clients, and analysts all consume reports differently.
Separate dashboard needs from formal reporting needs.
A live dashboard is useful, but some teams also need more structured, printable, or operational reports.
Tools like DashThis, Whatagraph, Looker Studio, and AgencyAnalytics are widely used for marketing dashboards and recurring performance reporting. But some teams eventually need more than a marketing dashboard builder.
That usually happens when reporting becomes more operational, more standardized across departments, or more dependent on structured layouts and governed workflows.
Examples include:
Marketing data combined with finance or sales reporting
Where FineReport fits for more complex reporting workflows
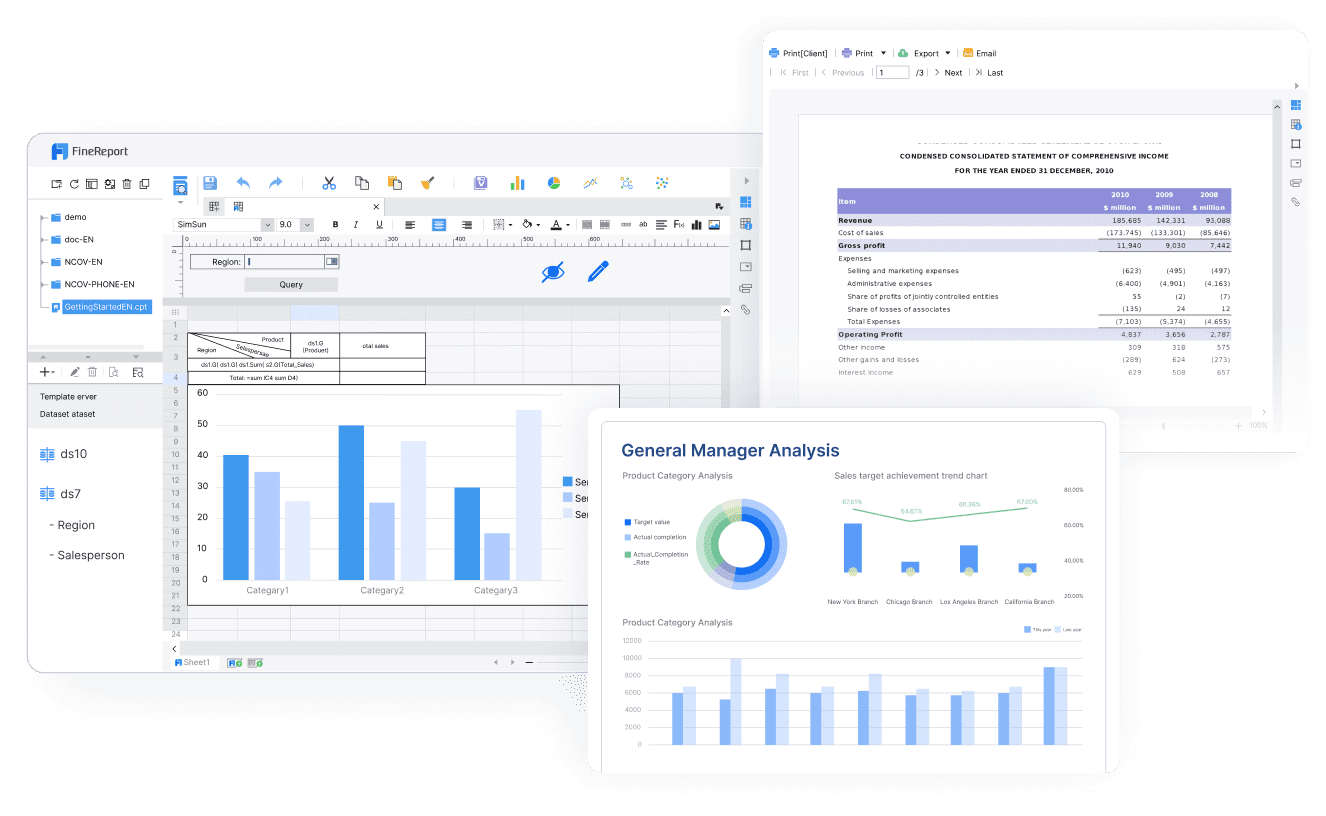
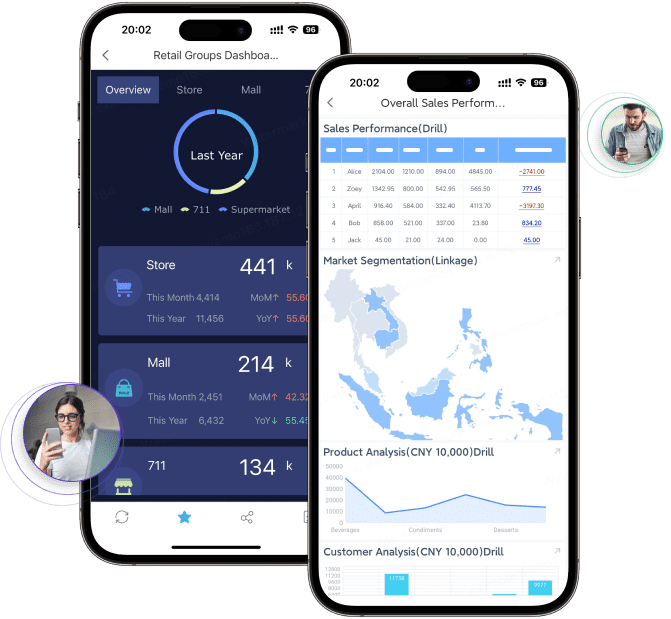
FineReport is not positioned as a lightweight ad dashboard tool in the same way as DashThis or AgencyAnalytics. Instead, it is more relevant for organizations that need broader enterprise reporting capabilities alongside dashboards.
A practical way to think about it is this: if your team has outgrown simple marketing dashboards and now needs more structured reporting workflows, FineReport may be worth evaluating.
Data entry and form-based workflows where reporting connects to business processes
For example, an organization may use a marketing reporting stack for campaign dashboards, but rely on FineReport when those numbers need to be integrated into broader executive, financial, or operational reporting.
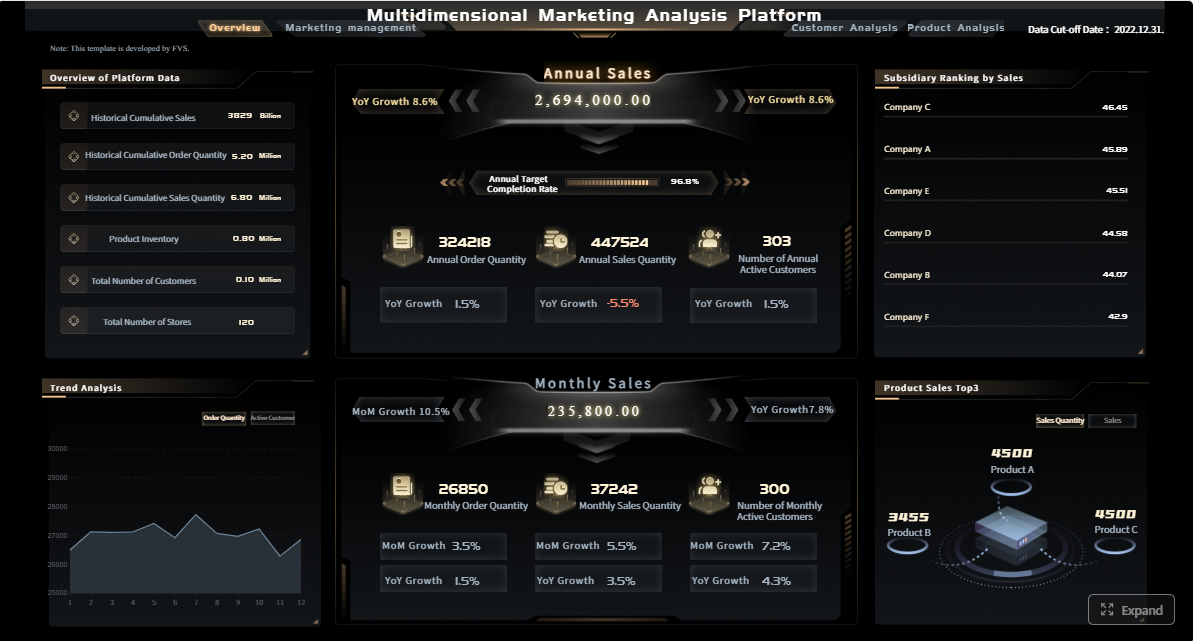
Get Ready-to-Use Dashboard and Report Templates in Fine Gallery
For teams comparing ad reporting tools, the key point is not that FineReport replaces every marketing dashboard product. It is that it can be a practical option when your reporting needs expand beyond campaign visualization into enterprise-grade reporting, scheduled distribution, and structured business reporting.
Final verdict: choosing the right reporting platform in 2026
The best ads reporting tool in 2026 depends less on headline features and more on how your team actually works.
Simple decision framework
Choose based on these priorities:
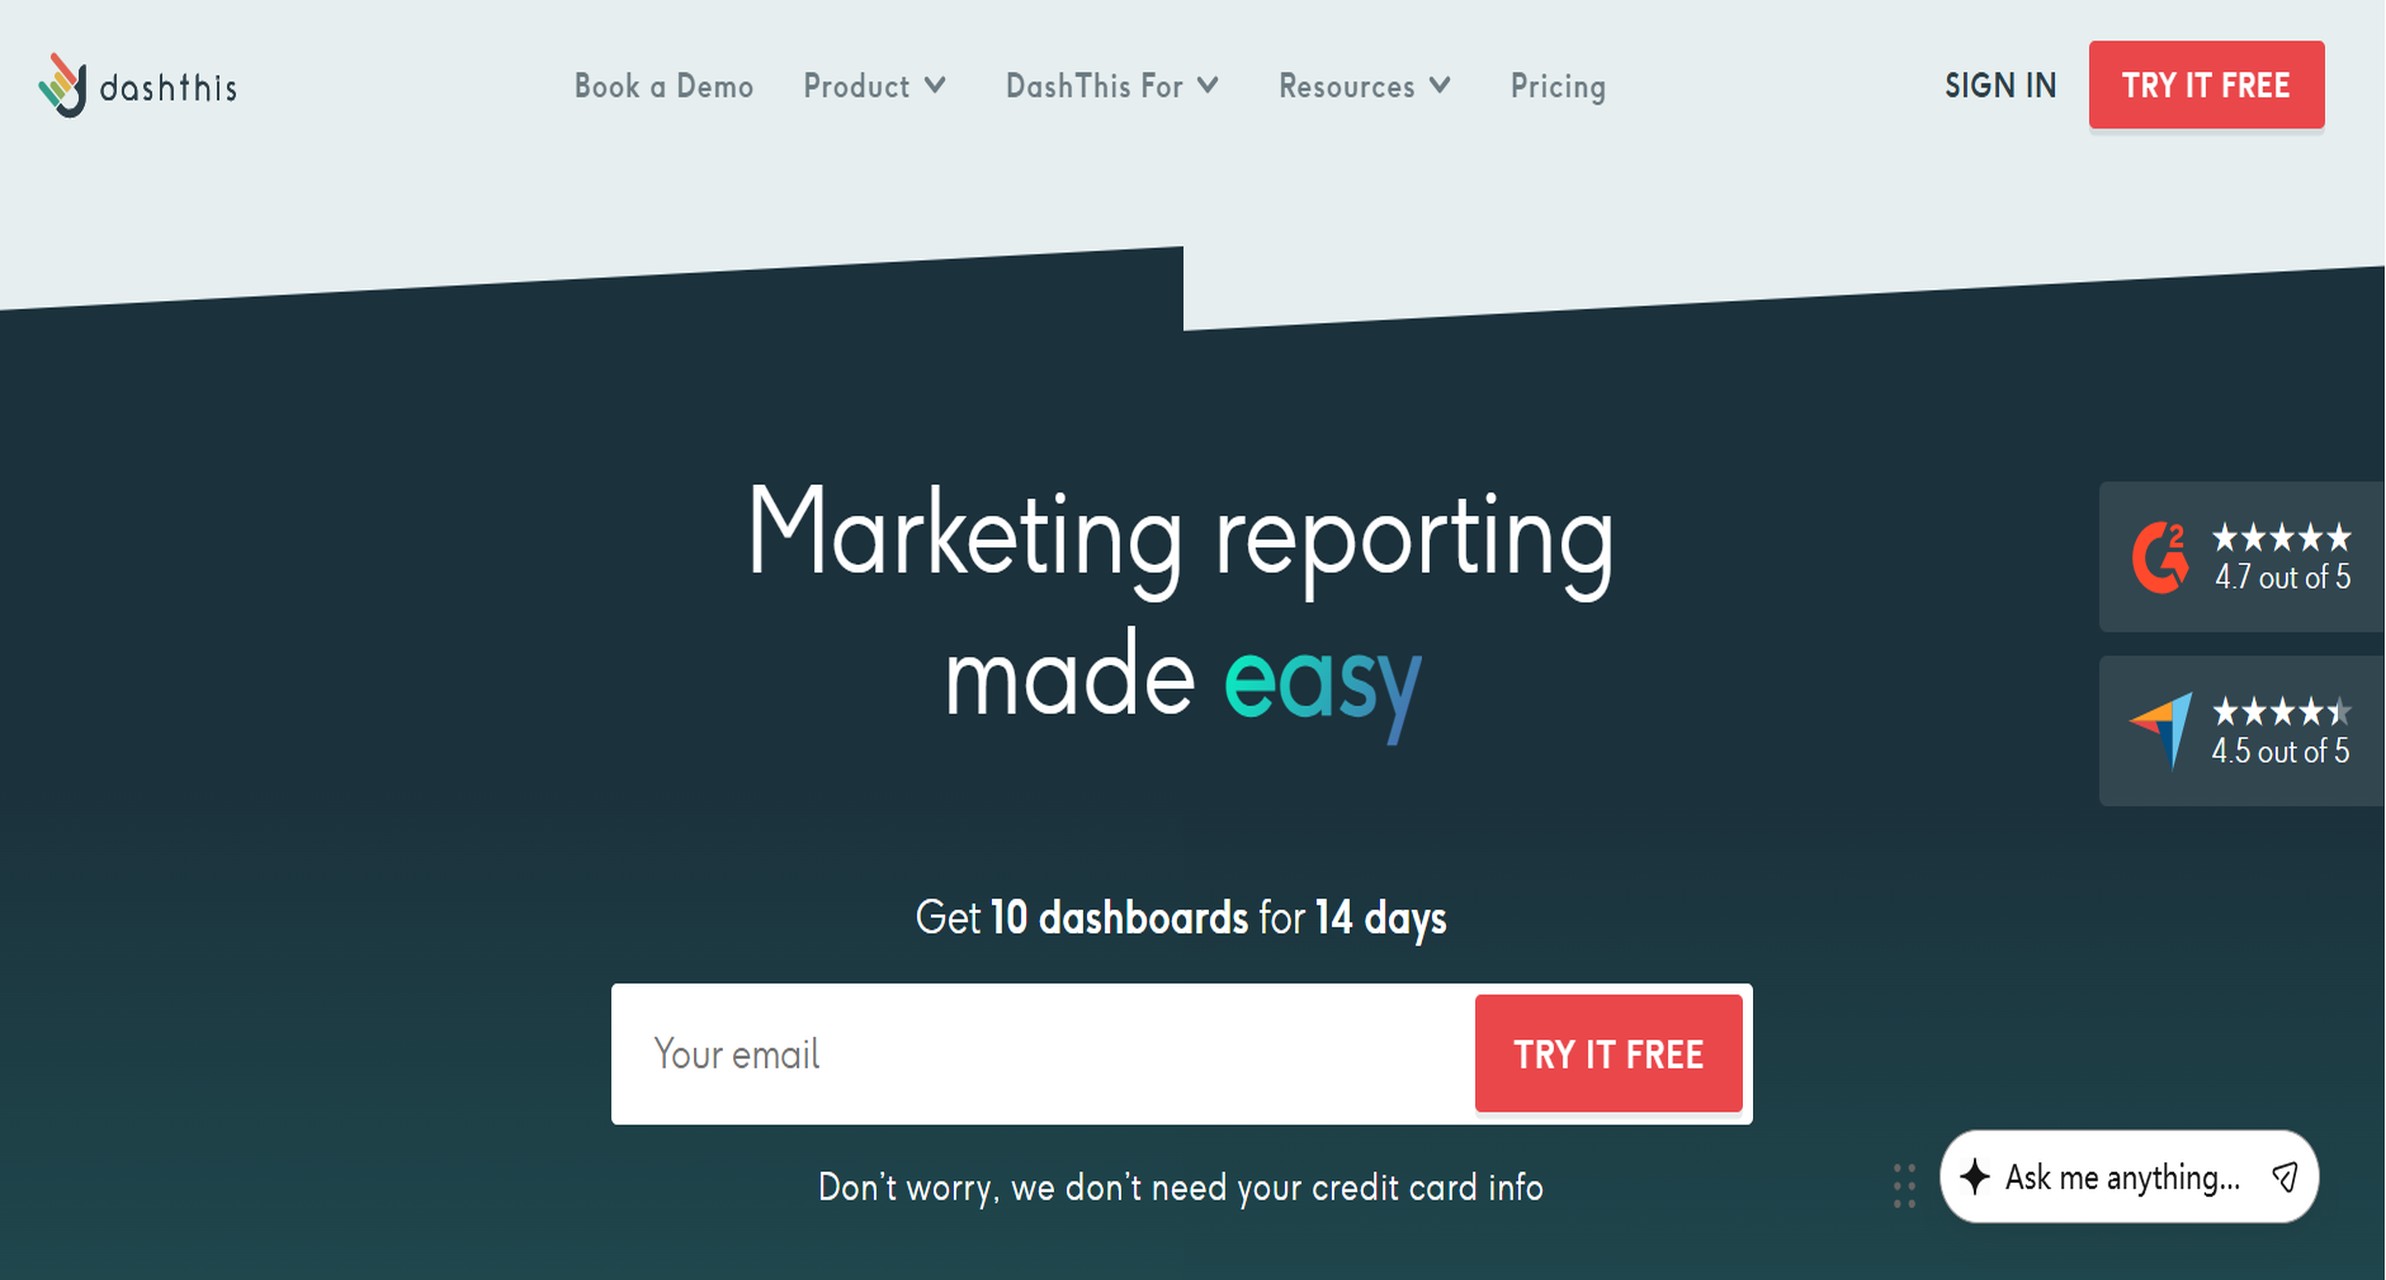
Choose DashThis if you want fast setup and simple recurring client reporting.
Choose Whatagraph if you want polished visual reporting for multiple stakeholders.
Choose Looker Studio if you want budget-friendly flexibility and can manage the setup.
Choose AgencyAnalytics if you need agency-focused workflows and white-label client reporting at scale.
The smartest approach is to shortlist one or two tools based on:
Budget
Technical skill
Reporting complexity
Number of stakeholders
Need for white-labeling
Need for structured or printable reports
In other words, do not choose based on features alone. Choose based on the reporting workflow you need to support every week, every month, and as your business grows.
It depends on your workflow, but agencies often prefer AgencyAnalytics for agency-focused operations, DashThis for fast repeatable reports, and Whatagraph for more polished client presentations. The best choice is usually the one that balances white-labeling, automation, and multi-client management.
Yes, Looker Studio can be a strong option for small teams that want flexibility and a low entry cost. It is especially useful if your reporting is centered on Google data and you are comfortable setting up custom dashboards.
A good ads reporting tool should combine data from multiple ad platforms, automate report updates, and present KPIs like spend, conversions, CPA, and ROAS clearly. Customization, scheduled delivery, and easy sharing are also important for most teams.
Yes, many ads reporting tools are built to pull data from Google Ads and Meta Ads into one unified view. This helps teams compare channel performance, reduce manual spreadsheet work, and create clearer executive or client reports.
Choose DashThis for simplicity, Whatagraph for presentation quality, Looker Studio for budget-friendly flexibility, and AgencyAnalytics for agency workflows. Your decision should come down to reporting scale, customization needs, and how much setup your team can handle.
Product Trial
FineReport
Pixel-perfect reports · Interactive dashboards · Easy data entry · Digital twins


 DashThis is often favored by agencies that want to launch client reporting quickly without building everything from scratch.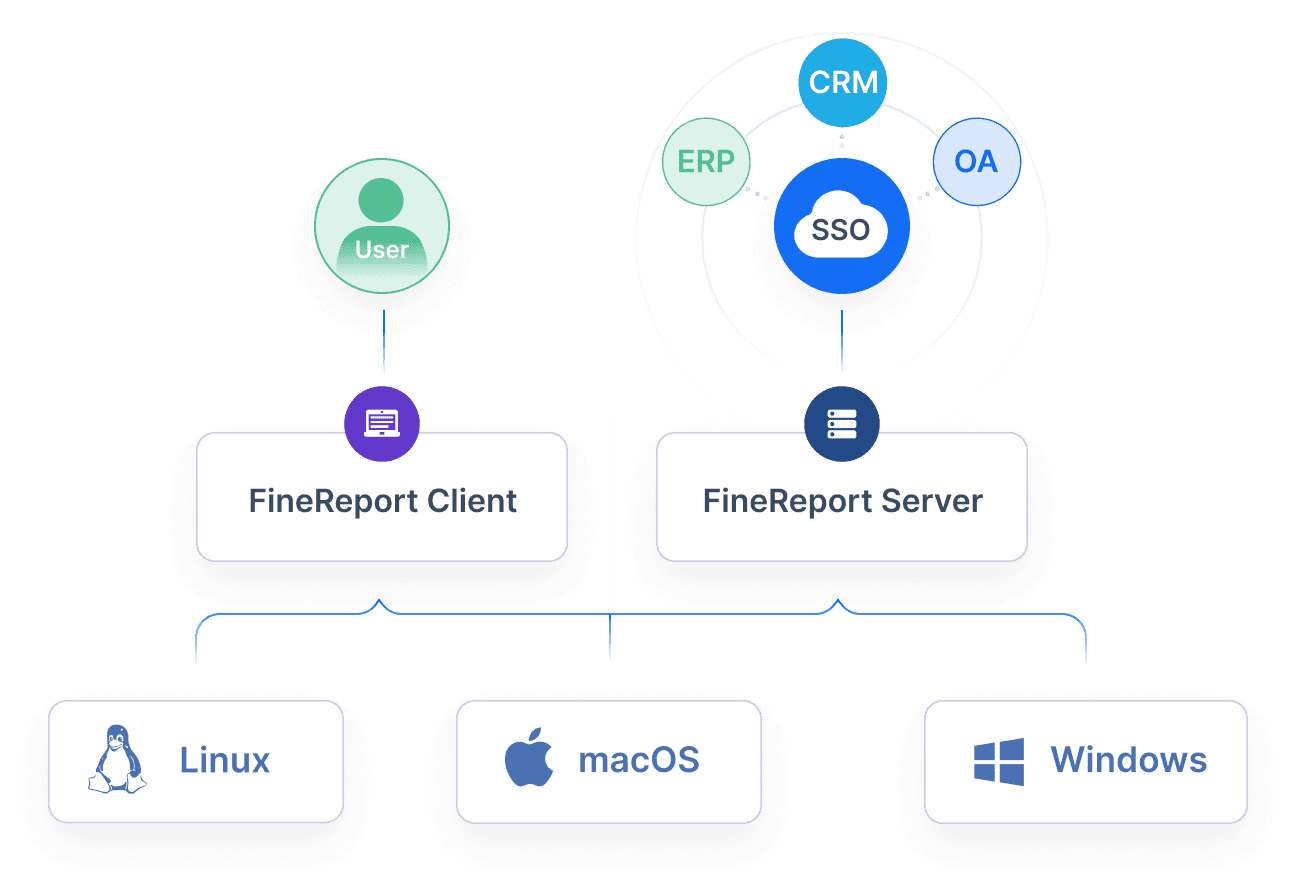
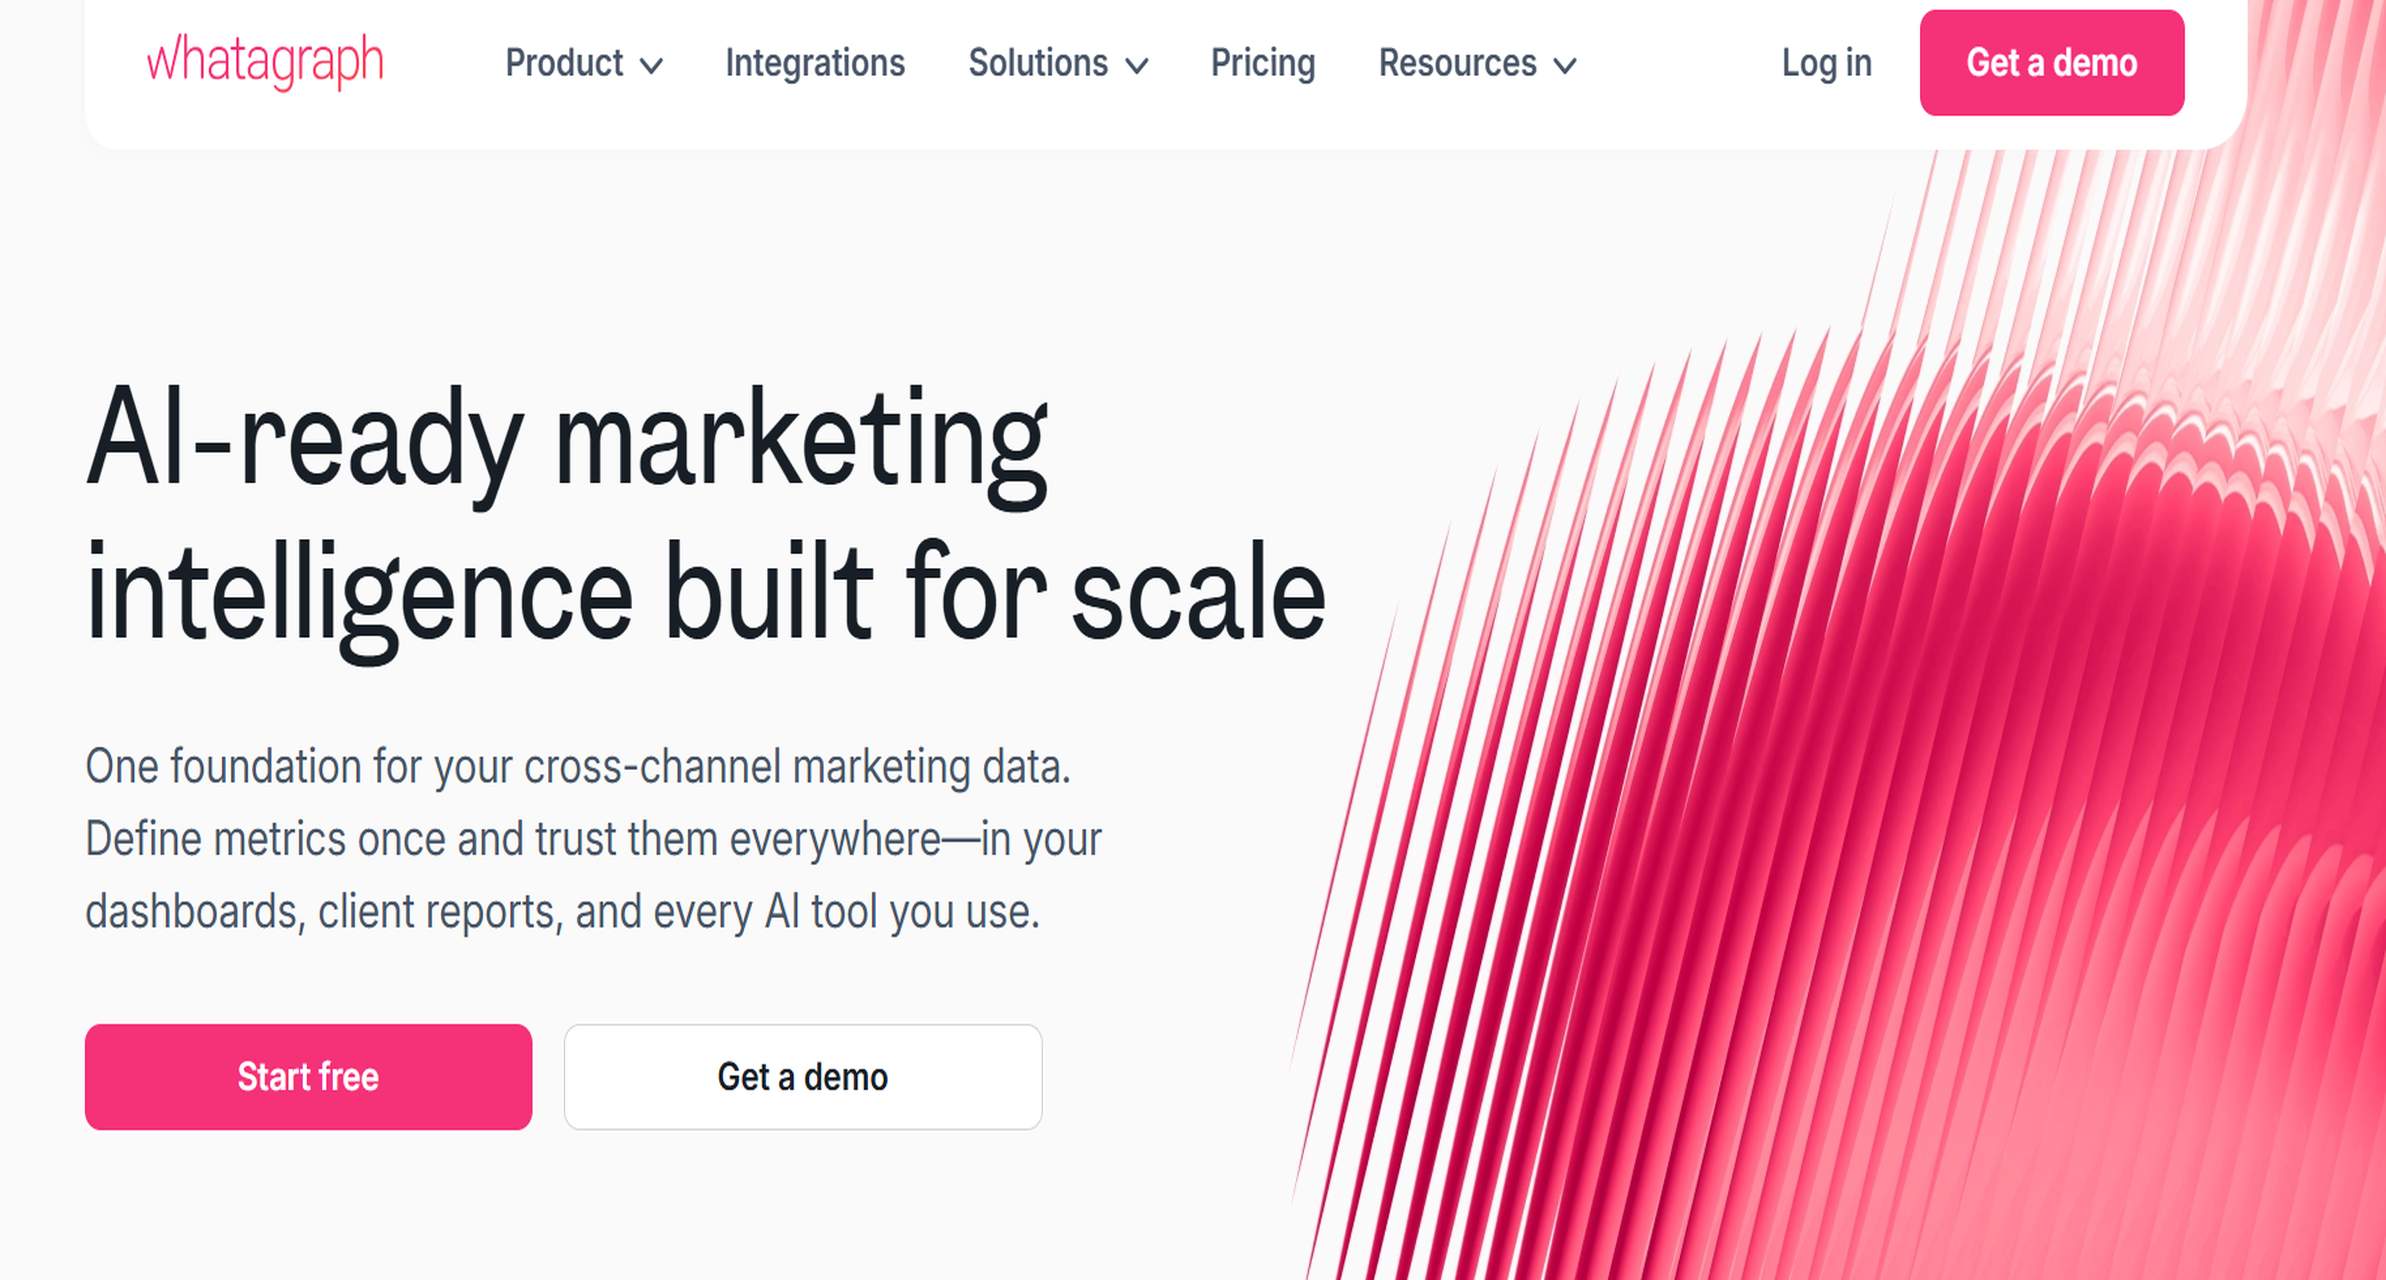 Whatagraph is widely associated with visually polished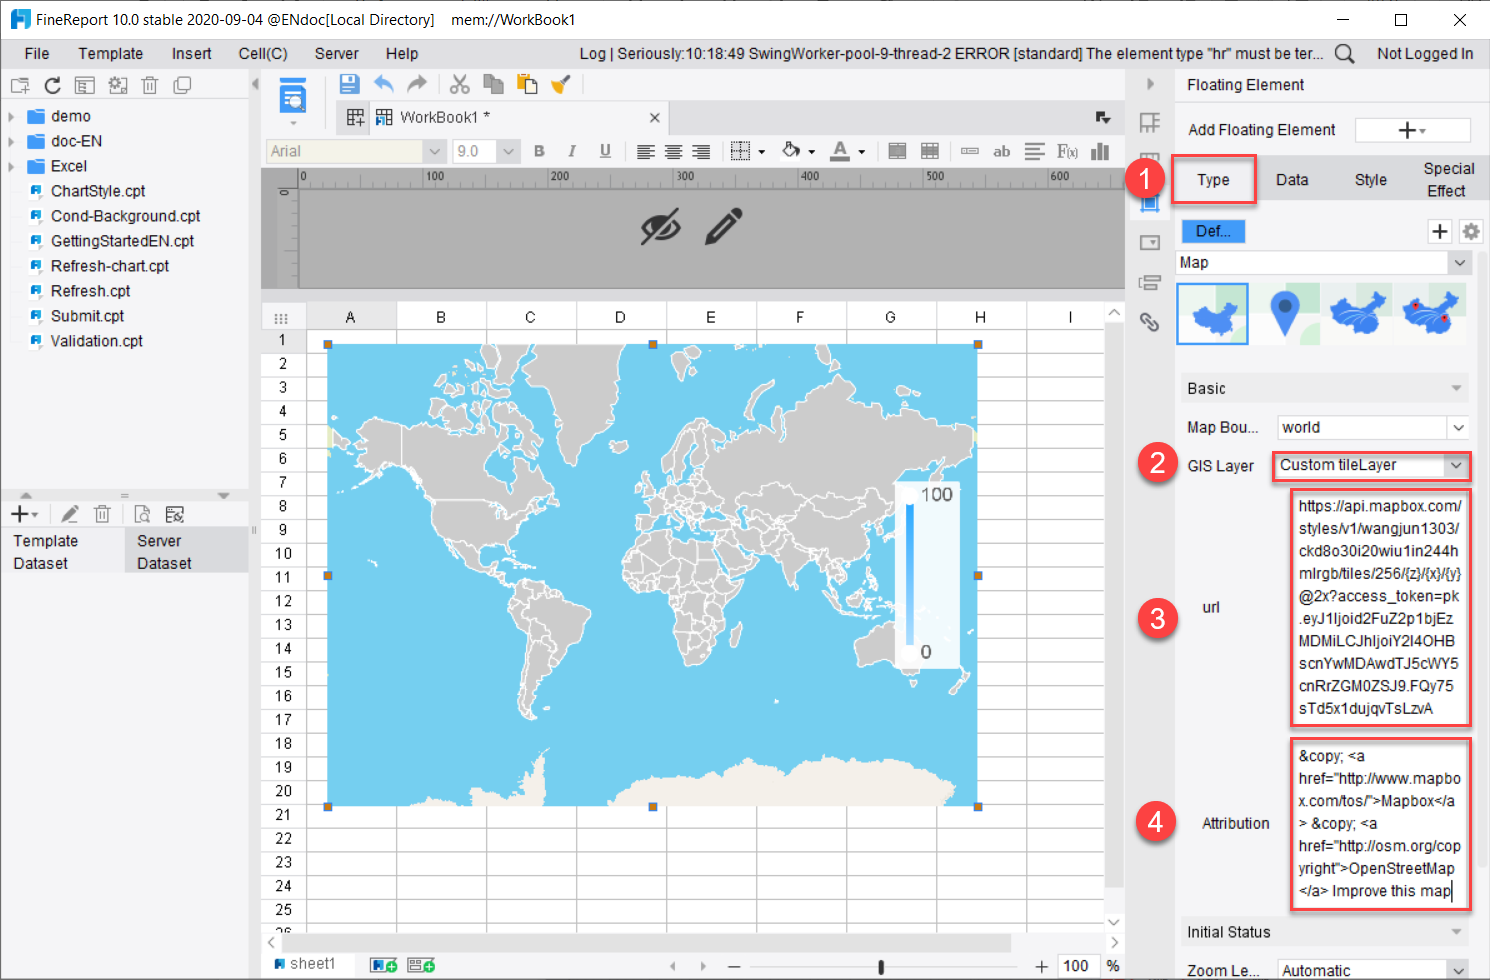
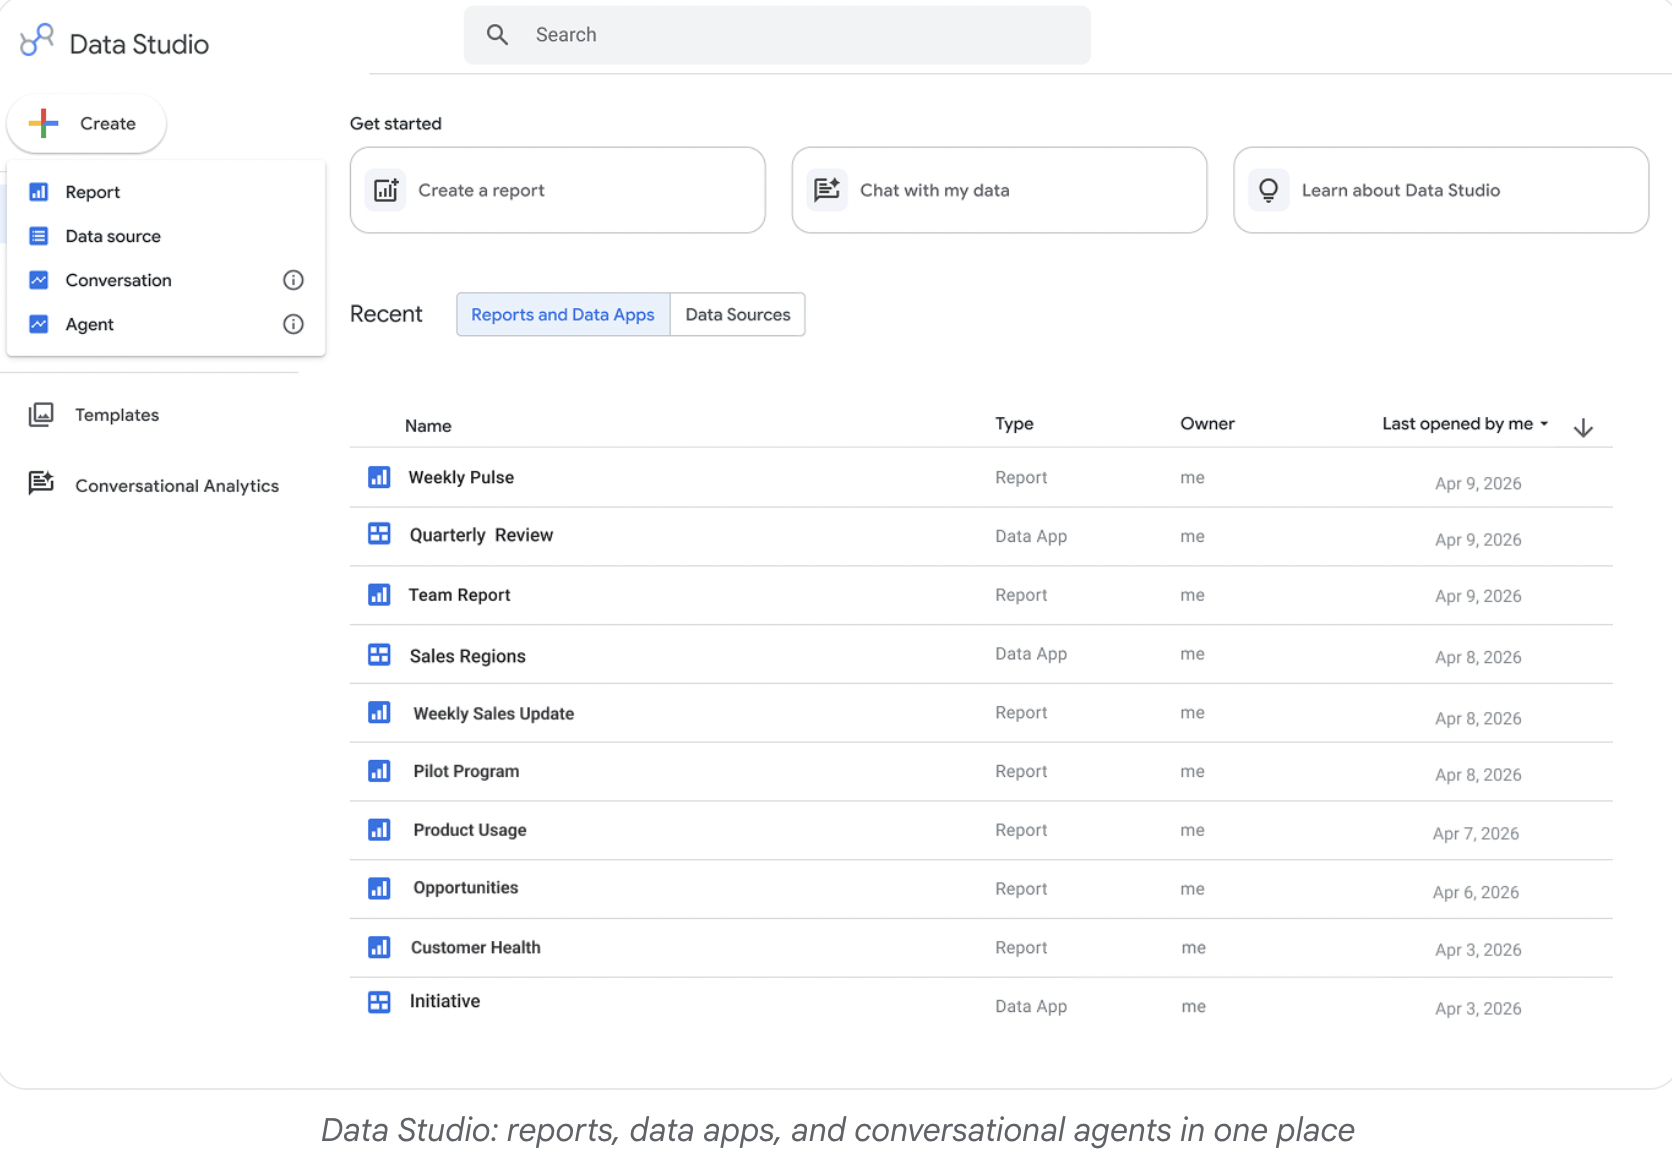 Looker Studio remains a popular option because it offers flexibility and strong alignment with Google-based reporting workflows.
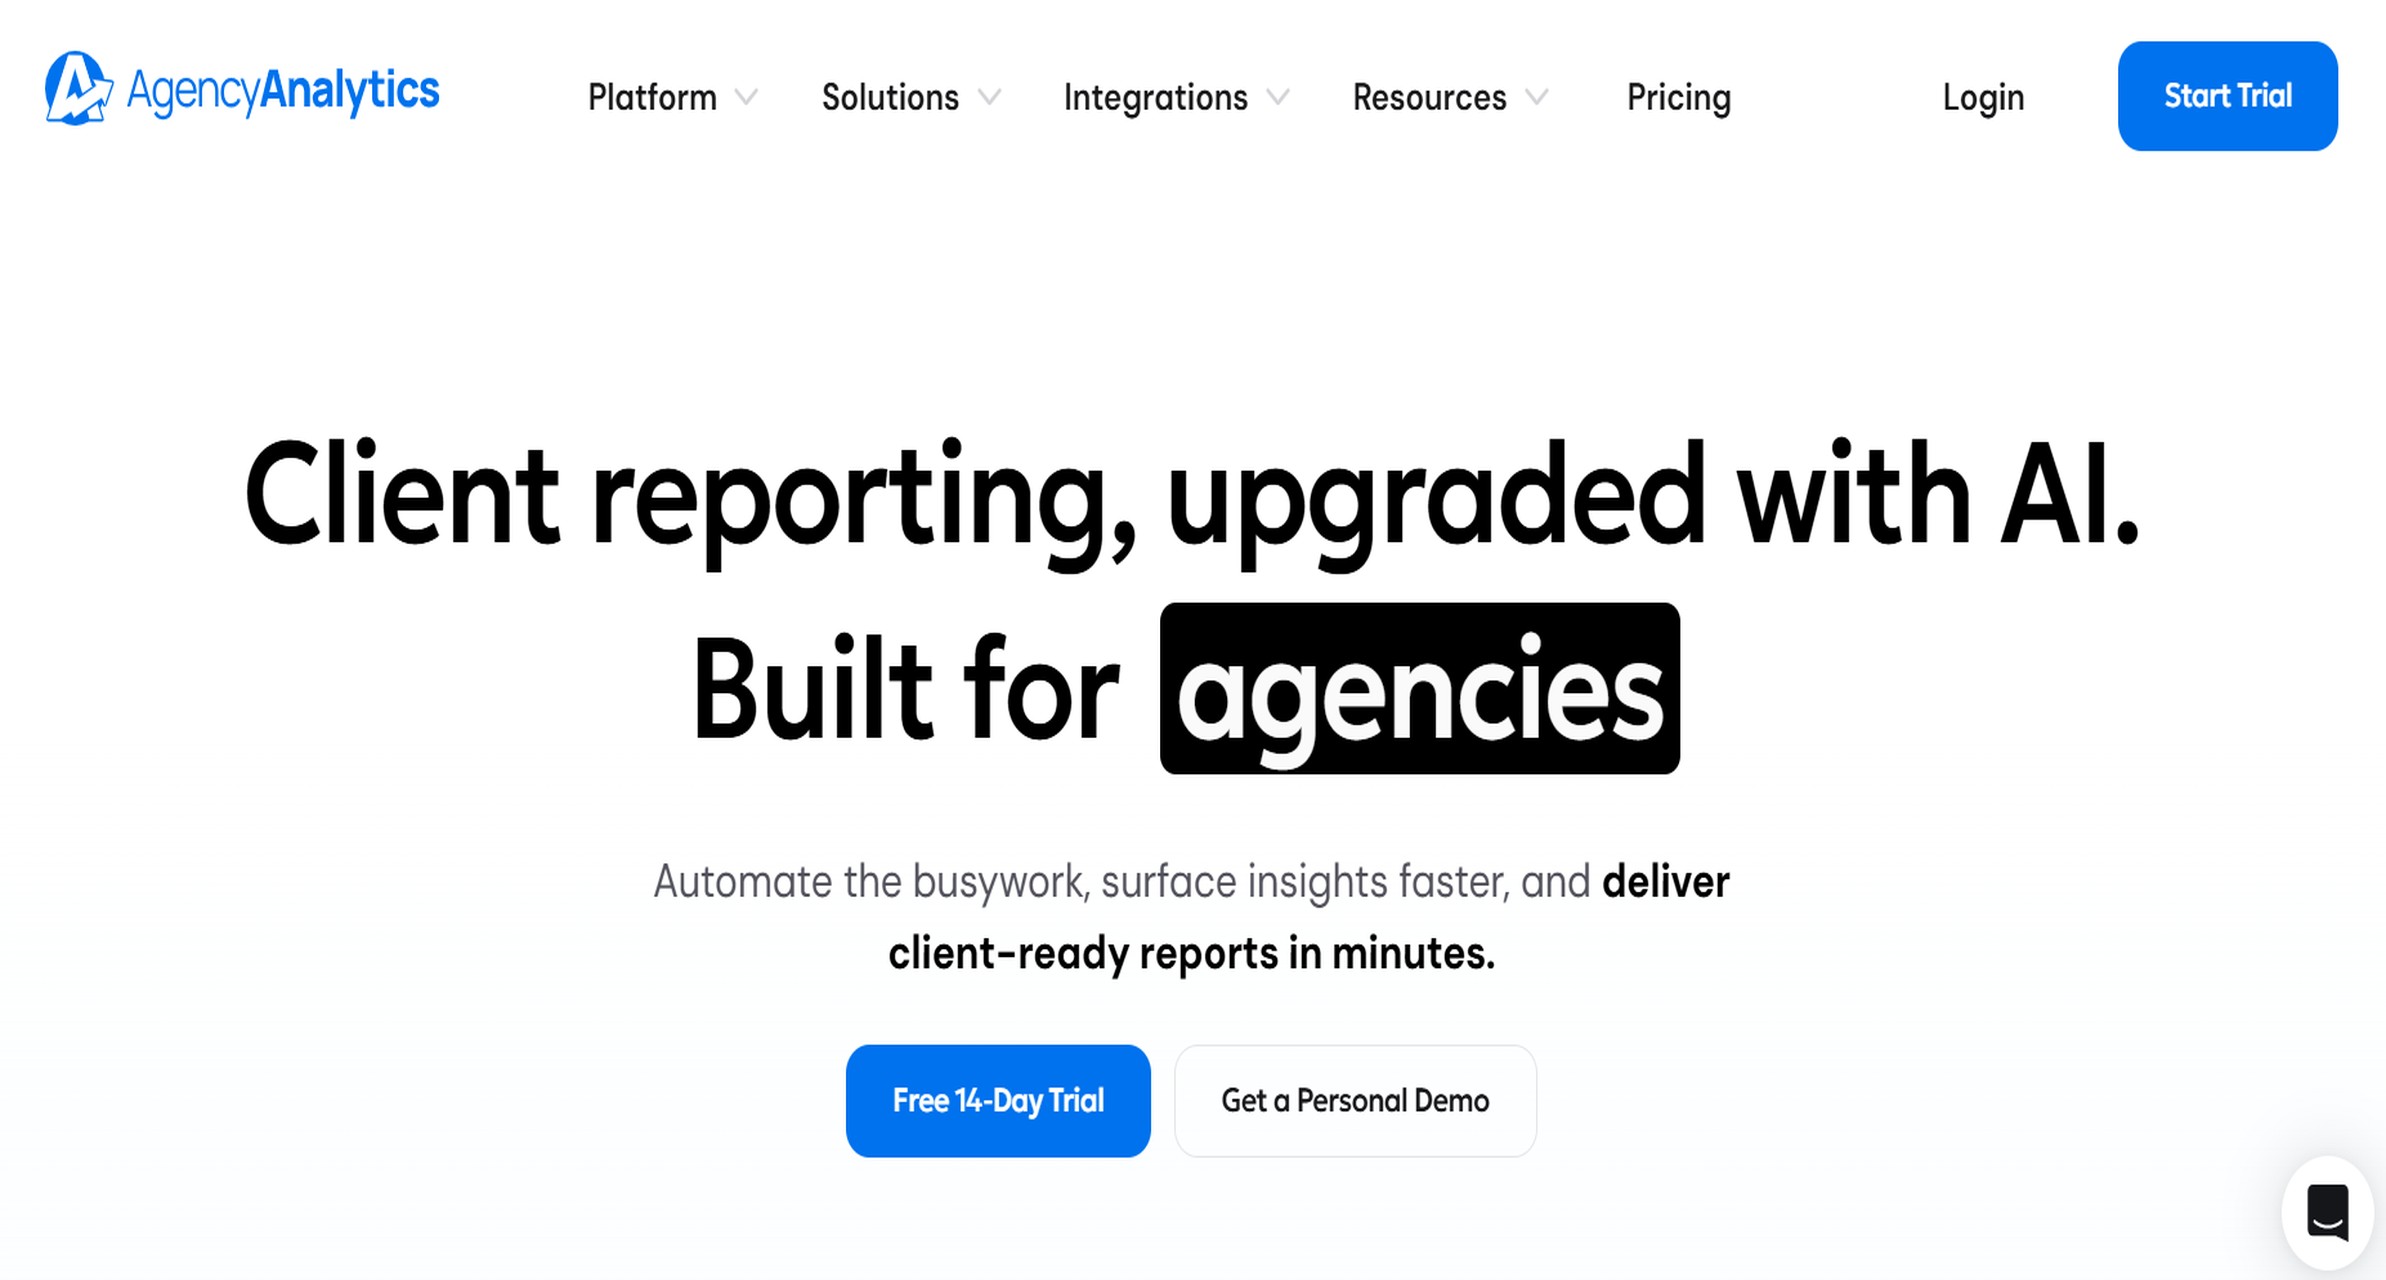 AgencyAnalytics is built specifically for agencies that need to manage recurring client reporting at scale.