FineReport is an enterprise-grade business reporting software platform for building pixel-perfect reports, dashboards, and automated data workflows at scale.
What to look for in business reporting software in 2026
Choosing the right business reporting software in 2026 is less about finding a tool that can build charts and more about finding one that can support how your business actually operates. Reporting needs now span operational teams, finance, executives, and external stakeholders, so the best platforms combine usability, governance, automation, and scalability.
Core reporting capabilities: dashboards, scheduled reports, ad hoc analysis, and drill-down views
At a minimum, modern business reporting software should support four essential use cases:
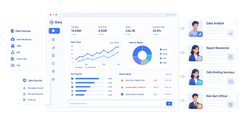
Dashboards for live KPI monitoring
Scheduled reports for recurring stakeholder updates
Drill-down views for moving from summary metrics to root-cause detail
If your team regularly sends weekly sales packs, monthly board reports, or departmental performance summaries, scheduled distribution matters just as much as visual quality. If business users need to investigate trends without waiting on analysts, self-service exploration and drill-through become critical.
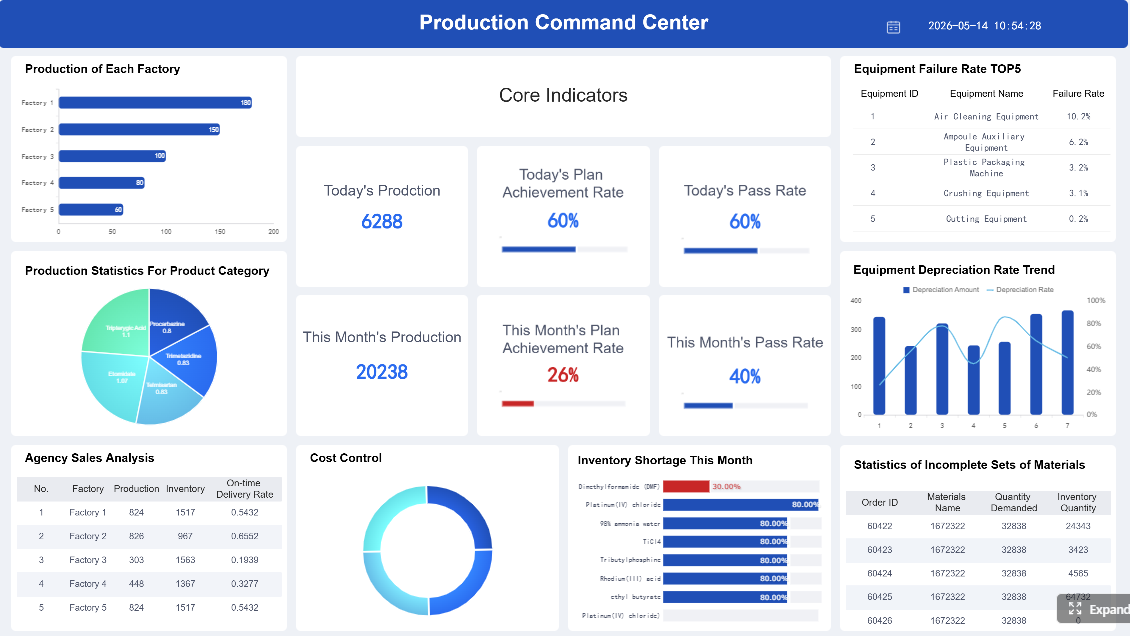
Look closely at whether a tool handles both interactive dashboards and formatted reporting well. Some platforms excel at data exploration but struggle with print-ready management reporting. Others are strong in fixed-format reports but weak in dynamic analysis. FineReport stands out here because it supports both highly formatted reports and dashboard-style reporting, which is valuable for organizations that need operational detail and executive presentation in one platform.
Click To Try The Dashboard
Data integration options, real-time syncing, and ease of connecting multiple sources
In 2026, teams also expect near real-time refreshes or event-driven syncing, especially for sales, operations, customer support, and e-commerce reporting. If your reports rely on manual CSV exports, the reporting process will break as data volume and stakeholder expectations grow.
Evaluate how easily each platform supports multi-source reporting. Some tools work best when data is already centralized in a warehouse. Others are better for direct connections to operational systems. FineReport is especially relevant for businesses with mixed environments because it can integrate across varied enterprise data sources while still supporting complex report design.
Governance, permissions, collaboration features, and auditability for growing teams
As reporting becomes more democratized, governance becomes more important. A business reporting software platform should give you control over:
User roles and permissions
Row-level or department-level access
Report versioning
Approval workflows
Audit trails
Secure sharing and embedding
This matters most when finance, operations, and leadership all use the same reporting environment. Without strong governance, you risk conflicting metrics, accidental edits, and unclear ownership.
Collaboration features also matter. Shared comments, subscriptions, alerting, and role-based distribution help reports become operational tools instead of static outputs. For larger organizations, FineReport is a strong option because it supports structured permission control and enterprise reporting governance, which is often where lightweight BI tools start to show limitations.
Pricing, implementation effort, and long-term scalability
The cheapest tool is not always the lowest-cost option over time. Compare platforms across three layers:
Licensing model
Implementation effort
Admin and maintenance burden
Some reporting tools are affordable upfront but require technical resources for data modeling, dashboard maintenance, and user support. Others take longer to implement but deliver better long-term control and scale.
Ask these practical questions before choosing:
How many users need to view reports versus build them?
Will reporting stay within one team or expand company-wide?
Will compliance and governance requirements increase over time?
If you expect reporting complexity to grow, it is smart to choose a platform that can scale from departmental reporting to enterprise deployment. FineReport is often a good fit in that scenario because it is designed for long-term reporting infrastructure rather than only lightweight dashboarding.
The 10 best business reporting software tools compared
Tableau
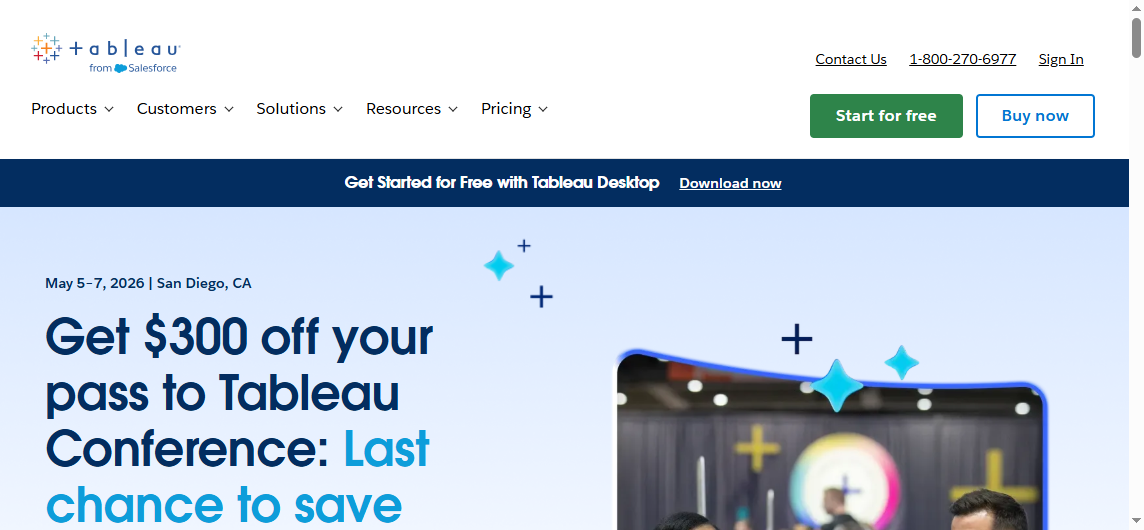
One-sentence overview: Tableau is a leading business reporting software platform known for advanced visual analytics, interactive dashboards, and strong exploratory analysis capabilities.
Cons: Can become expensive at scale, steeper learning curve for advanced authoring, less ideal for highly formatted pixel-perfect reporting
Best For (Target user/scenario): Enterprise teams, analysts, and organizations with data-heavy reporting workflows that prioritize visual exploration.
Tableau remains one of the most recognized names in business reporting software because it is especially strong when users need to explore large datasets interactively. It is often the right choice for analytics teams that want to move beyond static reports into deeper visual discovery.
Its biggest strength is how well it supports multi-dimensional analysis. Users can slice metrics, build dashboards for different stakeholders, and create engaging executive views without sacrificing analytic depth. However, organizations that need formal operational reports or print-perfect layouts may need an additional reporting layer.
For companies focused on visual analytics first, Tableau is still one of the strongest tools in 2026.
Microsoft Power BI
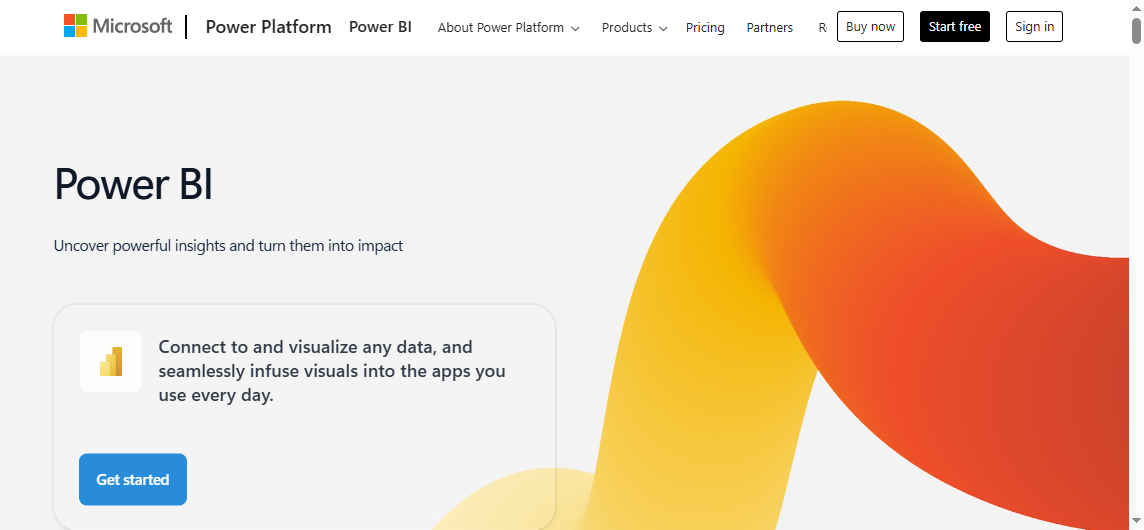
One-sentence overview: Microsoft Power BI is a widely adopted business reporting software tool that combines accessible dashboarding, strong Microsoft integration, and scalable enterprise BI capabilities.
Key Features:
Native integration with Excel, Teams, Azure, Dynamics, and Microsoft 365
Governance and security features for enterprise use
Pros & Cons:
Pros: Strong value for Microsoft-centric organizations, broad functionality, good balance of self-service and enterprise BI, familiar ecosystem
Cons: DAX and modeling can be complex, report performance depends on setup quality, licensing can become confusing across tiers
Best For (Target user/scenario): Organizations invested in the Microsoft ecosystem that need operational reporting, KPI tracking, and executive dashboards.
Power BI is one of the most practical choices for businesses already using Microsoft products. Its integration with Excel, Teams, and the broader Microsoft stack makes adoption easier, especially for companies trying to standardize reporting across departments.
It performs well for operational dashboards, recurring management reporting, and executive KPI tracking. It also supports self-service use, though advanced model design usually still requires technical skill. For many mid-sized and enterprise organizations, it offers a strong balance between affordability and capability.
The main trade-off is complexity under the surface. Basic reports are easy to create, but large-scale semantic models, security design, and performance tuning can require experienced BI resources.
Metabase
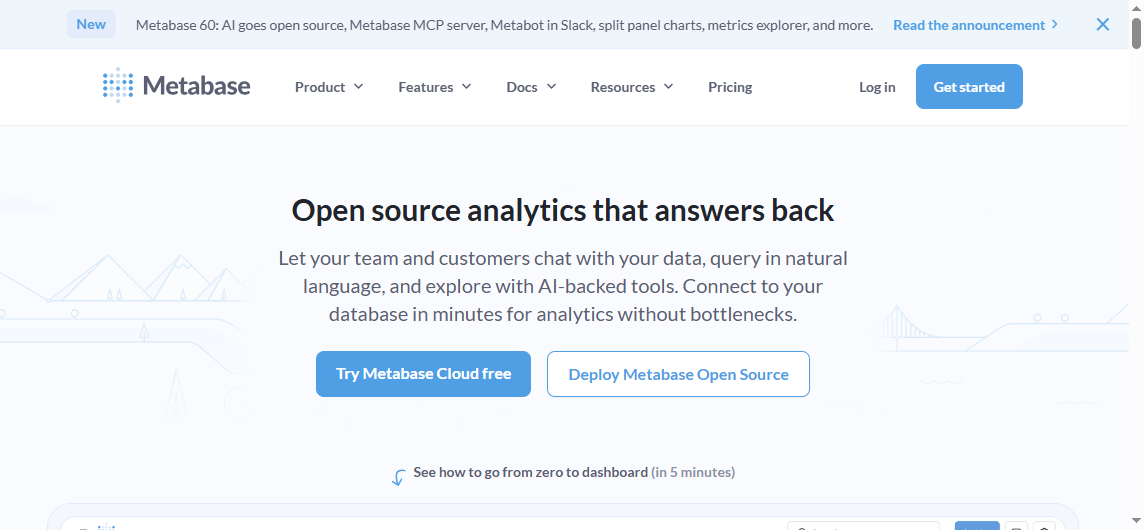
One-sentence overview: Metabase is a flexible and approachable business reporting software option that makes self-service analytics and dashboarding accessible for teams without heavy BI overhead.
Pros: Easy to deploy, approachable interface, flexible deployment, good fit for technical and semi-technical teams, cost-effective
Cons: Less polished for formal enterprise reporting, fewer advanced visualization options than top-tier BI suites, governance depth may be lighter than enterprise-focused platforms
Best For (Target user/scenario): Startups, product teams, and internal analytics environments that want simple self-service reporting.
Metabase has become a popular option for organizations that want business reporting software without the weight of a traditional BI rollout. It is especially useful when teams need to connect quickly to operational databases and start answering questions fast.
Its no-code interface helps non-technical users build basic reports, while analysts can use SQL when needed. That combination makes it appealing for startups and internal data teams that want speed and flexibility.
Where it falls short is in highly polished executive presentation or deeply controlled enterprise reporting environments. If you need formal board packs, advanced governance, or highly formatted operational reports, other platforms may fit better.
Fathom
One-sentence overview: Fathom is a finance-oriented business reporting software platform built for management reporting, forecasting, and multi-entity performance analysis.
Consolidated reporting for groups and multi-entity businesses
Scheduled report delivery
Pros & Cons:
Pros: Strong finance reporting focus, easy-to-understand management reports, useful for forecasting, strong fit for accountants and CFOs
Cons: More specialized than general BI tools, less suitable for broad cross-functional analytics, not ideal as a company-wide exploratory analytics platform
Best For (Target user/scenario): CFOs, finance leaders, accounting firms, and businesses focused on financial performance reporting.
Fathom is not trying to be a general-purpose analytics suite. Its value comes from doing finance reporting well. For businesses that care most about board reporting, financial visibility, cash flow planning, and multi-entity comparisons, it is a focused and effective option.
The reporting experience is generally more structured than broad BI platforms, which can be an advantage for finance teams that want consistency over flexibility. It is particularly useful when accounting data is central to decision-making.
If your reporting needs extend deeply into operations, marketing, product, or customer analytics, Fathom may need to sit alongside a broader BI platform rather than replace one.
Side-by-side comparison of the remaining top tools
Below are six more business reporting software tools worth serious consideration in 2026.
Looker Studio
One-sentence overview: Looker Studio is a lightweight reporting tool for building dashboards connected to Google services and common marketing data sources.
Key Features:
Native Google ecosystem connectivity
Shareable dashboards
Basic visualizations and filters
Marketing reporting templates
Pros & Cons:
Pros: Easy to access, good for lightweight dashboarding, useful for Google Analytics and ad reporting
Cons: Less robust for enterprise governance, limited for complex modeling, not ideal for heavy operational reporting
Best For (Target user/scenario): Marketing teams and smaller organizations using Google products.
Qlik Sense
One-sentence overview: Qlik Sense is an analytics and reporting platform known for associative exploration and flexible data discovery.
Pros: Excellent for formal documents and operational statements, strong layout control, reliable for fixed-format reporting
Cons: Less modern for self-service analytics, weaker dashboard experience, narrower use case than newer BI platforms
Best For (Target user/scenario): Enterprises that need print-ready invoices, statements, forms, and operational reports.
Klipfolio
One-sentence overview: Klipfolio is a lightweight KPI dashboarding platform built for fast metrics tracking and automated business snapshots.
Key Features:
KPI dashboards
Metric automation
Data connectors
Scheduled snapshots and sharing
Pros & Cons:
Pros: Fast setup, useful for KPI visibility, good for recurring business snapshots
Cons: Less comprehensive than full BI suites, limited for deeper analysis, not ideal for complex enterprise reporting
Best For (Target user/scenario): Smaller teams that need quick dashboard deployment and automated KPI monitoring.
Best use cases by business type and reporting needs
Best reporting software for small business
Small businesses usually need three things from business reporting software:
Affordable pricing
Fast implementation
Useful dashboards without major technical overhead
For this segment, Zoho Analytics, Metabase, Looker Studio, and Klipfolio are often strong fits. They are easier to deploy and better aligned with teams that do not have dedicated BI engineers.
Small businesses should prioritize simplicity when:
Reports are mainly for sales, marketing, and operations monitoring
However, simplicity has trade-offs. If reporting needs are likely to expand into formal management packs, multi-department governance, or complex operational reporting, choosing a more scalable platform early can prevent migration pain later. FineReport can be a smart step-up option for growing businesses that want more structure and report customization without jumping straight into the most expensive enterprise BI ecosystems.
Best options for finance, operations, and executive reporting
Different reporting functions need different strengths.
For finance reporting, Fathom is one of the strongest specialized tools because it supports management reports, forecasting, and consolidated views. SAP Crystal Reports can also be relevant where fixed-format financial documents matter.
For operations reporting, Power BI and FineReport are strong choices. Power BI works especially well for KPI tracking and cross-functional dashboards, while FineReport is valuable when operational teams need detailed, structured reports with automation and broad enterprise data connectivity.
For executive reporting, Tableau, Power BI, Domo, and FineReport are strong contenders:
The right choice depends on reporting maturity. If your team has strong analysts, Tableau or Qlik Sense may unlock deeper exploration. If your business users need guided reporting with strong control, Power BI or FineReport may be more practical.
Power BI, Fathom, Domo, Klipfolio, and FineReport are all strong in recurring report delivery, though their strengths differ.
Power BI is strong for shared dashboards and recurring business reporting in Microsoft environments.
Fathom is highly effective for scheduled finance and management reports.
Domo works well for executive visibility and cloud-based distribution.
Klipfolio is useful for lightweight KPI snapshots.
FineReport is especially strong when businesses need automated generation of formal reports, recurring operational outputs, and large-scale distribution across departments.
Automation saves the most time in repeatable reporting workflows. But manual analysis still matters when teams need investigation, interpretation, or strategic scenario testing. A good reporting stack supports both.
Pros, cons, and how to choose the right tool
Common strengths across modern reporting platforms
This means the buying decision is less about whether a tool can create reports and more about how well it fits your operating model.
Trade-offs in usability, customization, governance, and total cost of ownership
Here are the most common trade-offs:
Usability vs power: Simpler tools are easier to adopt but may hit limits quickly.
Customization vs speed: Highly customizable platforms usually take longer to implement.
Self-service vs governance: Democratized reporting can create inconsistency without strong controls.
Lower entry cost vs long-term cost: Cheap tools can become expensive when admin effort, add-ons, or migration costs are included.
This is why many organizations outgrow lightweight dashboard tools. As reporting spreads across teams, they need stronger permissions, better auditability, and more structured output formats. FineReport is worth considering in that context because it addresses the gap between simple dashboards and enterprise-grade reporting operations.
A simple decision framework based on company size, tech stack, and reporting complexity
Use this framework to narrow your choice:
Choose Tableau if:
You prioritize advanced visual analytics
You have analysts who need deep exploration
Executive storytelling is a top priority
Choose Power BI if:
You are heavily invested in Microsoft
You need broad business reporting at a practical price
You want a balance of self-service and enterprise controls
Choose Metabase if:
You want fast deployment
Your team is startup-oriented or technically flexible
The best business reporting software is the one that matches both your current workflows and your next stage of growth. If your reporting needs are broad, recurring, and increasingly cross-functional, do not just choose the easiest tool to start with. Choose the one that can still support your business when reporting becomes a core operating system.
For many growing and enterprise teams, that makes FineReport a particularly strong option in 2026 because it combines dashboarding, automated reporting, enterprise control, and highly formatted report design in a single reporting platform.
FAQs
The best choice depends on your reporting needs, team size, and data environment. Tools like Tableau and Power BI are strong for interactive analytics, while FineReport is a better fit for organizations that need both pixel-perfect reports and dashboards in one platform.
Focus on reporting format, data integrations, governance, automation, and scalability. You should also consider whether your users mainly need self-service dashboards, formal scheduled reports, or a mix of both.
The most important features usually include dashboards, scheduled reporting, ad hoc analysis, drill-down capability, multi-source data connectivity, and permission controls. For larger teams, audit trails, collaboration, and secure sharing are also essential.
Yes, most modern platforms can connect to databases, spreadsheets, cloud apps, APIs, and enterprise systems like ERP and CRM tools. The main difference is how easily they handle mixed environments and near real-time refreshes.
FineReport is well suited for enterprise reporting because it supports highly formatted reports, dashboards, automation, and structured permission management. It is especially useful for organizations that need scalable reporting infrastructure across multiple departments.
Product Trial
FineReport
Pixel-perfect reports · Interactive dashboards · Easy data entry · Digital twins