If you are searching for financial report writing software, you are likely not just looking for another dashboard tool. You are trying to find a system that helps your finance team produce reliable monthly reports, board packs, management statements, variance reviews, and audit-supporting outputs without rebuilding everything in spreadsheets every cycle.
For mid-sized teams, that usually means balancing two priorities at once: flexibility for finance and control for the business. You need tools that can support consolidation, traceability, permissions, repeatable formats, and exports that still look right when shared with leadership, auditors, or department heads.
Reporting depth is what separates basic analytics from real financial reporting software. A dashboard may show KPIs, but finance teams often need much more than that:
Structured income statements, balance sheets, and cash flow reports
Multi-entity or multi-department views
Drill-down from summary numbers to details
Versioning and approval support
Scheduled report distribution
Printable, board-ready formatting
That is the lens for this comparison. Instead of ranking tools by popularity alone, this guide compares seven software categories and platforms based on the things finance teams actually feel during close and reporting cycles: report customization, data connectivity, collaboration, governance, and implementation effort.
Highly formatted scheduled reports in Microsoft environments
Limited
Strong
Strong
Limited
Strong
Strong in Microsoft stack
Lower for business users
IT-led reporting teams
AI-assisted reporting platforms
Narrative generation and audit-supporting workflows
Moderate
Moderate
Moderate
Limited
Moderate
Moderate to strong
Moderate
Teams prioritizing documentation and review speed
This table is intentionally balanced. Different tools serve different reporting styles. A finance team building recurring statement packages has different needs from an analyst building interactive dashboards.
Best financial report writing software for mid-sized teams: what matters most
Mid-sized finance teams sit in an awkward but important stage of growth. They are usually too complex for manual spreadsheet-only reporting, but they may not have the budget, internal systems team, or change-management capacity of a large enterprise.
That makes software selection more practical than theoretical.
A useful financial report writing software platform for this team size should help with five things:
Consolidation: Pull data from accounting systems, ERP platforms, spreadsheets, and sometimes operational systems into one reporting process.
Audit trails: Track who changed what, when, and why, especially during close and review cycles.
Permissions: Limit access by role, entity, department, or report type.
Flexible exports: Support Excel, PDF, and printable outputs that preserve structure and formatting.
Repeatable report production: Allow recurring monthly, quarterly, and annual reports without rebuilding layouts each time.
Why reporting depth matters more than basic dashboarding
Basic dashboarding is useful for monitoring trends, but finance reporting often requires more discipline than a set of charts can provide.
A CFO package, for example, may include:
A summary P&L
Department-level variance tables
Cash position details
Commentary sections
Drill-down schedules
Approval or review steps before release
That is not just visualization. That is a controlled reporting workflow.
The same is true for:
Monthly closes, where speed and consistency matter
Board packs, where formatting and narrative coherence matter
That matters when leaders ask, “What changed?” and finance needs to answer quickly.
3. Multi-entity support
Mid-sized businesses often manage:
Multiple subsidiaries
Departments or cost centers
Regions
Business units
Intercompany structures
Not every reporting tool handles that elegantly. Some are good for one ledger view but become difficult when consolidations or parallel entity reporting is required.
4. Excel compatibility
Excel remains deeply embedded in finance. Even when teams want to reduce spreadsheet dependence, they still often need:
Familiar editing logic
Data exports to Excel
Excel-based review steps
Hybrid workflows during transition
The best choice is not always the one that removes Excel entirely. Often it is the one that places Excel in the right role.
5. Scheduled distribution
Recurring report distribution is one of the clearest markers of mature reporting software.
Add columns or segments when reporting needs change
Refresh recurring reports without heavy redevelopment
Test report outputs during close cycles
The more a tool depends on specialist development for everyday report maintenance, the less agile finance becomes.
Reporting depth tiers at a glance
Not all financial report writing software fits the same reporting style. Most options fall into one of four broad groups.
Add-ins
These tools extend Excel-based workflows with better connectivity, versioning, and automation. They are often attractive for finance teams that want rapid adoption and familiar interfaces.
These tools provide a dedicated reporting environment outside core spreadsheets and often outside the ERP as well. They may support dashboards, formatted reports, workflows, and broader enterprise reporting.
These stay close to system-of-record data and can simplify trust, controls, and operational alignment.
Best suited for:
Transaction-linked reporting
Standard finance packages
Teams heavily standardized on one ERP
Approval-led workflows
Advanced query-based tools
These are stronger when data structures are complex, sources are mixed, and reporting logic needs more customization.
Best suited for:
Multi-entity reporting
Custom financial logic
Operational-financial blended reports
Detailed drill-down and parameter-based reporting
The 7 tools compared
1. Spreadsheet-based add-ins for finance-led reporting
Spreadsheet-based add-ins remain one of the most common starting points for mid-sized finance teams.
Examples in this category often include Excel-centered financial reporting and planning tools such as Vena, Datarails, or similar platforms that preserve the spreadsheet experience while adding structure around it.
They are usually best for teams that want:
Familiar workflows
Fast adoption
Flexible formatting
Low training overhead
Strengths
Finance users can work in a familiar environment
Formatting is often easier for statement-style reports
Quick edits are possible during close
Transition from legacy spreadsheet processes is smoother
Trade-offs
Governance can weaken if spreadsheet logic spreads too widely
Collaboration may still depend on workbook discipline
Cross-functional reporting can become harder as scope grows
Audit and version controls vary significantly by platform
Best fit
This category fits teams where finance wants to move faster without immediately replacing spreadsheet-based reporting behavior.
2. ERP-native reporting suites for operational alignment
ERP-native reporting tools are often attractive to finance leaders who want tighter alignment with transaction-level data and built-in system controls.
Examples may include reporting suites embedded in or closely tied to platforms like NetSuite, Sage Intacct, Microsoft Dynamics, or other ERP ecosystems.
They are usually strongest when the team values:
Source-of-truth consistency
Less manual handoff between systems
Better alignment with approvals and accounting processes
Strengths
Stronger connection to underlying transactions
Better data governance within the ERP environment
Easier consistency across finance and operations
Reduced risk of reporting from stale exports
Trade-offs
Custom formatting may be less flexible than dedicated report tools
Reporting design can be constrained by the ERP’s framework
Cross-system reporting may require additional tooling
Executive pack design may still need external formatting steps
Best fit
This category works well for teams that are deeply committed to one ERP and mostly need standardized operational and finance reporting tied to that environment.
3. Query-driven tools for complex financial analysis
Query-driven reporting tools are often a better match when reporting complexity outgrows both spreadsheets and basic ERP reports.
This category is useful for finance teams handling:
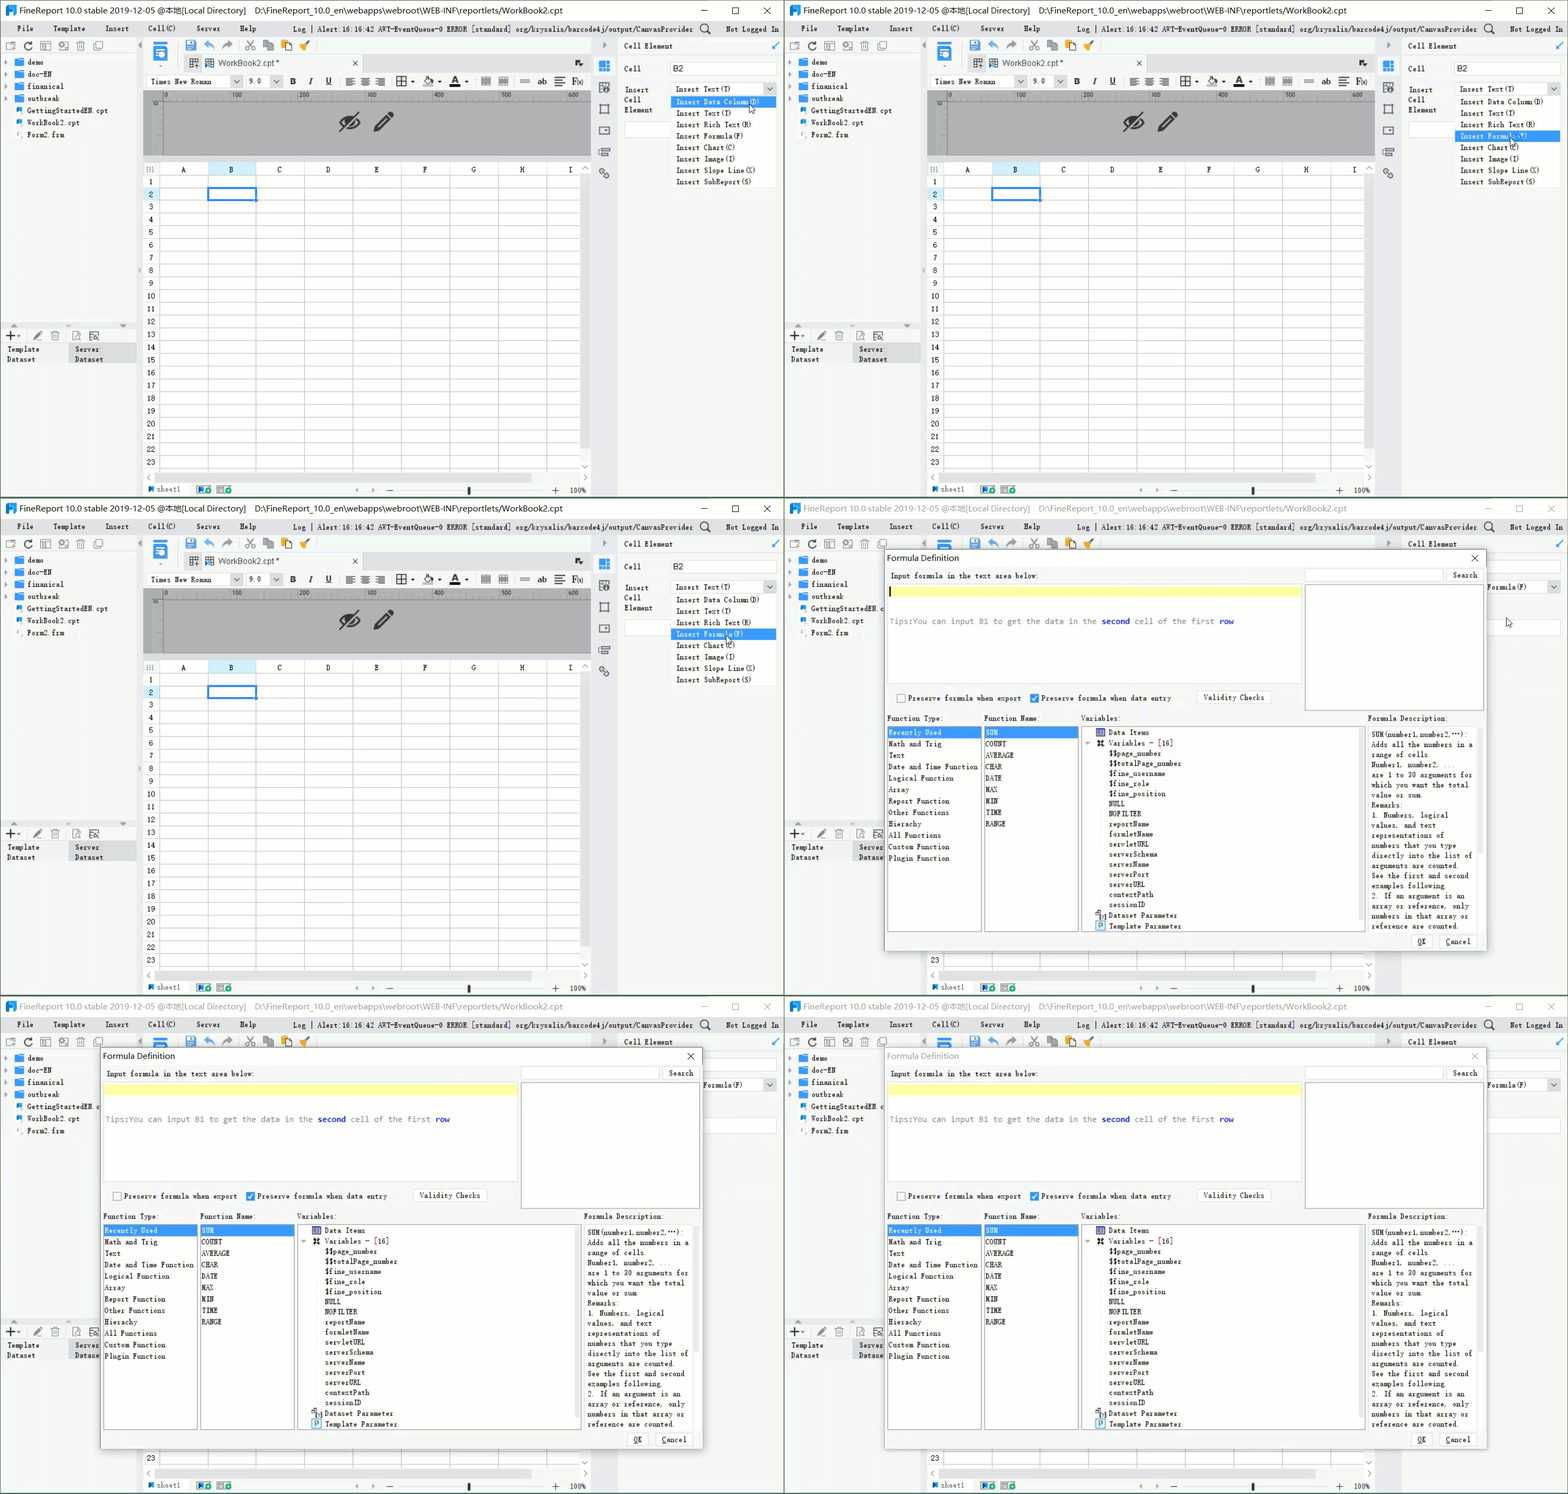
FineReport fits naturally into this category because it supports structured report design, parameter queries, dashboard and report integration, scheduled distribution, and enterprise reporting workflows.
Often stronger for parameter-based report access and distribution
Trade-offs
Setup can take more planning than spreadsheet add-ins
Teams may need support defining data models and report standards
User learning curve is typically higher than plain Excel workflows
Best fit
This category is often the right choice for mid-sized teams with growing complexity that need more than ad hoc analysis but are not ready to accept reporting limitations from simpler tools.
4. AI-assisted reporting platforms for audit-ready output
AI-assisted reporting platforms are gaining attention because they can help finance teams move faster on draft creation, consistency checks, supporting narratives, and review preparation.
These platforms are not a substitute for finance judgment. But they can be useful for reducing repetitive writing work and surfacing anomalies that deserve attention.
Strengths
Faster first drafts for commentary and summaries
Help identifying unusual changes or gaps
Support for documentation and review preparation
Useful in audit-supporting workflows where consistency matters
Trade-offs
Financial outputs still require formal review
Governance policies must define acceptable AI use
Narrative speed does not automatically mean reporting accuracy
AI support is more useful when the underlying report structure is already strong
Best fit
These tools suit teams that already have a defined reporting process and want to improve efficiency around explanation, review, and documentation.
5. Power BI for finance dashboards and interactive management reporting
Power BI is widely used for business intelligence and is often shortlisted by finance teams because it supports interactive dashboards, strong Microsoft ecosystem alignment, and broad data connectivity.
Strengths
Strong dashboarding and visualization
Good fit for management insight and KPI monitoring
Broad adoption and ecosystem support
Useful for self-service analysis across departments
Trade-offs for financial report writing software use
Pixel-perfect finance outputs are not its primary strength
Formal reporting workflows may need supporting tools or services
Excel-like finance editing behavior is limited compared with spreadsheet-centric tools
Best fit
Power BI is a strong option when finance needs interactive visibility, management dashboards, and broader business reporting alongside standard reporting outputs.
6. Tableau for executive analytics and visual storytelling
Tableau is often chosen for data exploration, visual analysis, and executive-facing dashboards. Finance teams with analytics-heavy needs may find it valuable for spotting trends and communicating performance visually.
Paginated or print-perfect reporting may require additional tooling
Finance workflows centered on recurring statement packages may need more structure than Tableau alone provides
Best fit
Tableau is often best for teams prioritizing analysis and presentation over controlled, finance-led report production.
7. SSRS and developer-led report tools for scheduled formatted reporting
SQL Server Reporting Services and similar developer-led reporting tools remain relevant, especially in organizations with Microsoft-heavy environments and internal technical resources.
Strengths
Strong for paginated, repeatable reports
Good scheduled distribution
Useful for operational and formatted reporting
Familiar in many established enterprise environments
Trade-offs
Business-user flexibility is often limited
Report changes may depend on IT or developers
Dashboarding and modern self-service analysis are not the primary strength
Finance teams wanting rapid iteration may feel constrained
Best fit
These tools are useful when structured report delivery matters more than self-service design and when internal technical support is available.
Side-by-side comparison: strengths, trade-offs, and best-fit teams
Where each tool stands out
The right financial report writing software depends on what kind of reporting your team does most often.
Reporting scenario
Strongest tool types
Why
Board reporting
Spreadsheet add-ins, query-driven tools, some CPM platforms
Traceability, consistency, and supporting workflow depth
Fast finance-led iteration
Spreadsheet add-ins, some query-driven tools
Easier changes without full redevelopment
A tool can be strong in one area and weaker in another. That is normal. The goal is to match the software to the reporting burden your team carries every month.
Mid-sized teams almost always face the same set of compromises.
Flexibility vs control
The more freedom users have to design reports, the more governance the organization must enforce. Spreadsheet-heavy tools offer flexibility, but dedicated platforms often provide stronger structure.
Ease of use vs reporting depth
The easiest tools to adopt are not always the deepest. Finance teams may start with familiar environments, then outgrow them as entity complexity and governance demands increase.
Rapid deployment vs long-term scalability
Quick wins matter, especially for lean finance teams. But software that works for ten recurring reports may struggle when the business needs fifty, across regions, entities, and stakeholder groups.
License cost vs implementation cost
A lower subscription cost does not always mean lower total cost. Implementation effort, internal admin time, process redesign, and support requirements can affect long-term value more than the license line item.
How to choose the right option for your finance team
Questions to ask before shortlisting vendors
Before you compare demos, clarify the reporting problem.
What reports must be standardized?
List the outputs that need consistency every cycle, such as:
Monthly management pack
Board deck support schedules
Department P&L reports
Cash flow reporting
Audit support schedules
These should be the core test cases.
Which reports need ad hoc flexibility?
Some reporting should be standardized. Some should remain exploratory. If you blur the two, tools get misjudged. A good dashboard product may still be weak for recurring statement production, and vice versa.
How many entities, departments, and approval layers are involved?
If your business has multiple entities, regional leadership, or layered approvals, governance features matter much more than they do in a single-entity reporting setup.
How much Excel dependence is acceptable?
Be realistic. For many mid-sized finance teams, the question is not whether Excel exists. It is where Excel should remain central and where governance needs to move into a more controlled platform.
How important are AI assistance, audit support, and ERP-native workflows?
These are not universal priorities. They become important when your team spends meaningful time on narrative creation, reconciliation support, or system-of-record alignment.
A practical shortlist approach
The most effective way to choose financial report writing software is to shortlist by reporting depth first, not brand awareness first.
Use this sequence:
Classify your reporting style
Is your team mostly spreadsheet-led, ERP-led, dashboard-led, or complexity-led?
Choose two or three tool types, not seven vendors
Compare categories first to avoid wasting time on poor-fit demos.
Run a sample reporting workflow
Ask vendors to replicate a real month-end or board-report process, including:
Design speed
Data refresh
Review and approval handling
Drill-down
Distribution quality
Export fidelity
Check the maintenance burden
Ask who updates layouts, changes dimensions, manages permissions, and handles new report requests after go-live.
Score long-term fit, not just demo polish
The right tool is the one your finance team can sustain under real reporting pressure.
Practical recommendations for mid-sized finance teams
Here are five practical recommendations based on common reporting transformation projects.
Separate dashboards from governed financial reports
Do not assume one tool should do everything equally well. Dashboards are useful, but finance often needs formal outputs with stricter controls.
Use one or two real monthly reports as the buying test
A vendor demo should prove the tool can handle your actual board pack, variance review, or consolidated statement workflow.
Treat distribution and review as core requirements Report writing is not finished when the report is built. Scheduling, approvals, comments, and secure sharing are part of the workflow.
Be honest about Excel’s role
If your team will continue to live in Excel for part of the process, choose software that works with that reality rather than against it.
Prioritize reporting depth before AI features
AI can speed explanation and quality checks, but it does not replace strong report structure, data trust, or governance.
When FineReport is a good fit for financial report writing software
Tools like Tableau and Power BI are widely used for visualization and BI analysis, but teams with complex reporting workflows may also need a dedicated enterprise reporting platform like FineReport.
For mid-sized finance teams, FineReport is especially relevant when reporting needs go beyond KPI dashboards and into structured operational and financial reporting.
FineReport supports capabilities that matter in this context:
Pixel-perfect report design for formatted financial statements and management packs
Paginated and printable reports for recurring monthly and board-facing outputs
Parameter queries for filtering by period, entity, department, or region
Scheduled distribution to automate report delivery
Dashboard and report integration so summary views can connect with detailed reports
Data entry and form-based workflows when finance processes require controlled input or adjustments
That does not mean FineReport is the right choice for every finance team. If your primary need is lightweight dashboarding or pure Excel continuity, other tools may feel more familiar. But if your reporting process includes deeply formatted reports, recurring distribution, mixed financial and operational data, and controlled workflows, FineReport is a strong platform to evaluate.
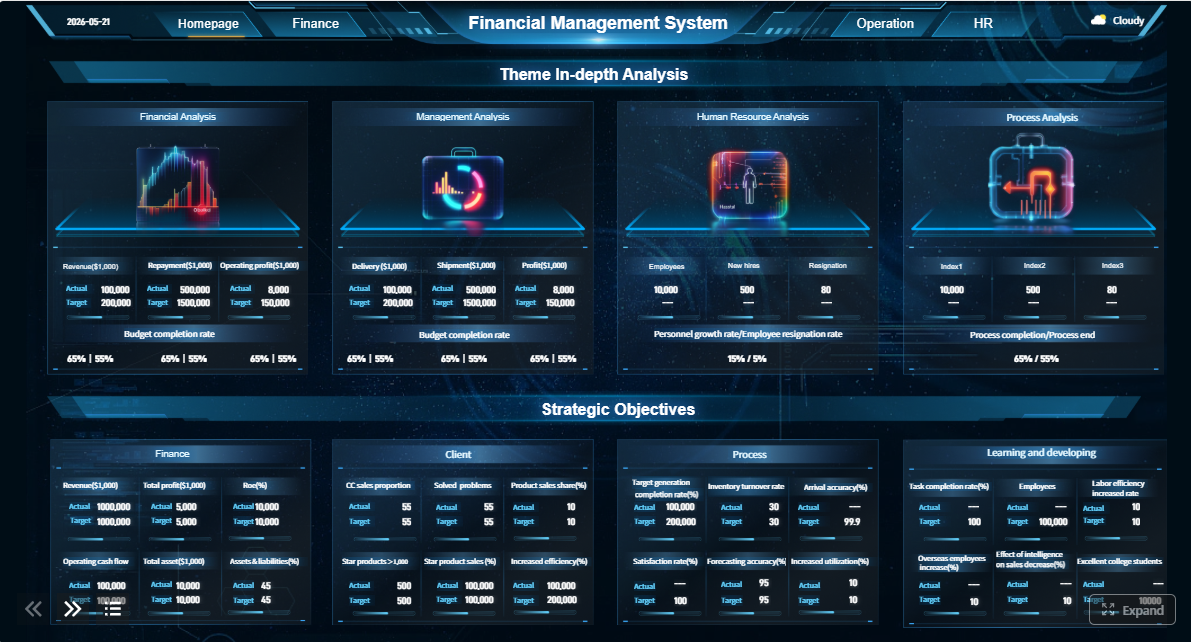
Get Ready-to-Use Dashboard and Report Templates in Fine Gallery
Why FineReport stands out on reporting depth
From a reporting consultant’s perspective, FineReport is most useful when finance teams need one platform to bridge several reporting demands at once:
Executive dashboards for visibility
Print-ready reports for finance distribution
Detailed drill-down reports for investigation
Parameterized queries for self-service access
Structured report templates for recurring periods
That combination is important because many teams do not actually need “more charts.” They need a more reliable way to create, govern, and distribute financial reports that still connect to live business data.
Typical use cases where FineReport fits
FineReport is worth shortlisting when your team needs to support:
Monthly financial packages
Department or entity-based reporting
Board-support schedules
Operational-financial blended reports
Report distribution across managers and executives
Drill-down from summary finance views into underlying details
It can also be useful when finance must collaborate with operations, sales, or manufacturing teams and needs reporting that spans both tabular detail and dashboard summaries.
Final takeaways for comparing reporting depth
The best financial report writing software for a mid-sized team depends less on raw feature count and more on how deeply the tool supports your real reporting workflow.
In general:
Spreadsheet-based add-ins fit teams that value flexibility and fast adoption
ERP-native reporting fits teams that prioritize controls and source-of-truth alignment
Query-driven tools fit teams with more complexity, customization, and recurring structured reporting needs
BI platforms fit teams that prioritize visual analysis and management insight
AI-assisted tools fit teams trying to accelerate documentation and review, not replace finance judgment
For many mid-sized finance teams, the turning point comes when reporting is no longer just about creating numbers. It becomes about writing, reviewing, governing, and distributing those numbers in a way the business can trust.
That is where reporting depth matters most.
If your team needs highly formatted reports, parameterized access, recurring distribution, and integrated dashboards and detailed statements, FineReport is one of the more practical platforms to evaluate alongside spreadsheet, ERP, and BI-oriented options.
Financial report writing software helps finance teams create recurring statements, board packs, variance reports, and audit-ready outputs using connected data instead of rebuilding everything in spreadsheets each cycle.
BI tools are usually stronger for interactive analysis and visual exploration, while financial reporting software is built for governed, repeatable, formatted outputs such as income statements, balance sheets, and scheduled report packages.
The most important features are multi-source data integration, audit trails, permissions, reusable report templates, drill-down capability, and reliable exports to PDF or Excel. These help teams close faster without losing control.
Yes, the right platform can automate data consolidation, standardize report formats, and reduce manual copy-paste work. Many teams still use Excel for analysis, but software can remove much of the repetitive reporting workload.
Teams that need polished, paginated, board-ready reports usually benefit most from tools with strong formatting, scheduling, governance, and drill-down support. Query-driven platforms, ERP-native reporting, and some Excel-based reporting tools are often the best fit depending on complexity.
Product Trial
FineReport
Pixel-perfect reports · Interactive dashboards · Easy data entry · Digital twins