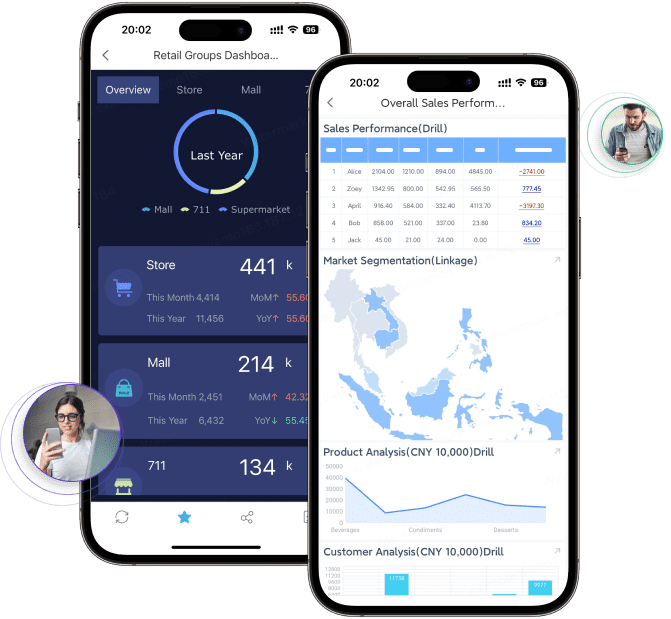
If your company still runs key decisions through excel report templates, you are not alone. Many growing enterprises begin with spreadsheets because they are flexible, familiar, and fast to start. But once reporting spans departments, entities, plants, regions, or product lines, those same templates often become a bottleneck.
The real issue is not Excel itself. The issue is using static files to support dynamic operations. Leaders need a shared reporting and operational cockpit that stays aligned with current business conditions. They also increasingly need an AI assistant layer that helps teams consume reports faster, understand exceptions, and follow up on actions without waiting for manual analysis.
With FineReport + Dora, teams can ask for a report summary in chat, generate structured narratives from trusted report assets, receive scheduled briefings, and push exceptions to the right owner.
Click To Try The Dashboard
All reports in this article are built with FineReport
Why Excel report templates stop working as your business scales
At a small scale, excel report templates solve practical problems. Finance can track budgets, sales can submit weekly updates, and operations can reconcile production or inventory status. But as the business grows, spreadsheet reporting starts creating friction that is hard to ignore.
Identify the warning signs: duplicate files, version confusion, delayed updates, and manual consolidation
Most enterprises hit the same warning signs:
Multiple copies of the same report living in email threads, desktops, and shared folders
Different departments editing different versions of one template
Weekly and monthly reports being delayed because someone is still collecting inputs
Manual consolidation across business units, branches, or production lines
Formula inconsistencies that create disputes about KPI accuracy
Report refresh cycles that lag behind actual operations
These issues are not just administrative annoyances. They weaken trust in reporting.
Explain how reporting friction slows decisions across sales, operations, finance, and management
When spreadsheet reporting becomes fragmented, every team pays the price:
Sales waits for pipeline updates and loses time discussing whose numbers are current.
Operations cannot spot bottlenecks quickly enough because status sheets arrive late.
Finance spends too much effort validating numbers before management review.
Management receives summaries without enough drill-down to act on root causes.
A growing enterprise needs decisions to move faster than reporting friction. If teams must chase files before they can discuss action, the reporting model is already too slow.
Define the gap between static spreadsheets and a real operational cockpit
A spreadsheet template is usually a document. An operational cockpit is a decision system.
The difference is substantial:
A spreadsheet captures data at a point in time.
An operational cockpit organizes KPIs, exceptions, trends, and responsibilities around business action.
A spreadsheet is often maintained by individuals.
A cockpit is shared, governed, and role-based.
A spreadsheet needs manual interpretation.
A cockpit can be enhanced with an enterprise Data Agent that summarizes, alerts, and follows up.
For growing enterprises, the goal is not to abandon Excel overnight. The goal is to move critical reporting from scattered files into a trusted reporting foundation, then upgrade report consumption with AI.
Before adding any new platform, start by understanding what your reporting landscape actually looks like. Most companies discover they have more templates than they thought, and fewer truly decision-critical reports than they assumed.
Separate critical reports from nice-to-have documents
Start by identifying which reports directly influence weekly or monthly decisions.
List recurring weekly and monthly reports that drive real decisions
Examples often include:
Weekly sales forecast report
Monthly profit and loss summary
Production output and downtime report
Inventory aging report
Project progress and resource report
Accounts receivable follow-up report
Management operating review pack
These reports deserve priority because they support repeatable business processes.
Highlight which files are copied, edited, and redistributed most often
Pay special attention to templates that are:
Recreated every reporting cycle
Edited by multiple people
Sent across departments
Used in meetings to explain business performance
Required for follow-up or approvals
Those files are usually the best candidates for standardization and cockpit design.
Map data sources, owners, and update frequency
Once the critical reports are clear, document the mechanics behind them.
Document where data comes from, who updates it, and how often it changes
For each report, define:
Source systems
Data owners
Business owners
Update frequency
Validation process
Final consumers
This mapping helps separate true system data from spreadsheet-only assumptions.
Flag reports that depend on manual exports or fragmented inputs
These are high-risk patterns:
ERP exports pasted into templates
Sales updates collected from regional files
Production sheets merged manually at the end of the shift
Finance adjustments applied outside source systems
KPI definitions changed informally by users
If a report depends heavily on manual collection, it is a strong candidate for migration into FineReport as a governed report or operational cockpit.
Step 2: Standardize your Excel reporting foundation
Not every spreadsheet is bad. Some excel report templates are useful because they reflect stable business logic. The problem is uncontrolled variation.
Before building dashboards or AI workflows, standardize the reporting foundation.
Keep only the templates that support repeatable business processes
Review existing spreadsheet formats and remove redundant layouts
Many companies find several versions of the same report:
one for headquarters,
one for regional teams,
one for each manager,
and another “temporary” version that became permanent.
Rationalize these into a smaller approved set.
Create a short list of approved templates for finance, operations, sales, and project tracking
A practical template portfolio might include:
Finance monthly performance template
Sales forecast and pipeline template
Operations daily or weekly status template
Project tracking template
Exception and risk follow-up template
The point is not to create more templates. It is to define which ones matter and should be governed.
Build consistency before adding more tools
Standardize naming conventions, metrics, and reporting periods
Without common definitions, no system or AI layer will perform well.
Key standardization items include:
KPI names
Time periods
Department and region names
Product category logic
Calculation formulas
Status definitions
Set rules for calculation logic, formatting, and approval workflows
Treat reporting as a process, not a document task. Define:
who prepares each report,
who validates it,
which numbers are official,
when reporting is locked,
and which version is final.
This matters because Dora’s AI assistant capabilities work best when they operate on trusted, governed report assets rather than ad hoc files.
Step 3: Replace template sprawl with connected reporting
After standardization, the next move is to connect reporting to controlled data flows. This is where enterprises start shifting from file-based reporting to a more reliable reporting architecture.
Move from isolated files to shared, controlled data flows
Reduce copy-paste work by linking trusted data sources to core reports
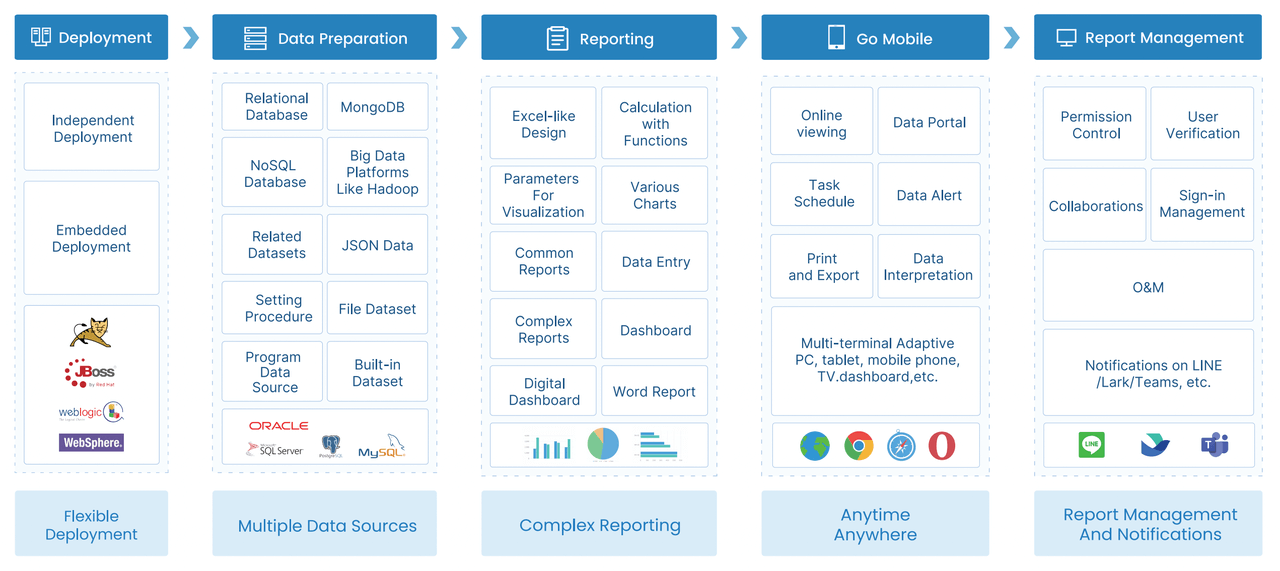
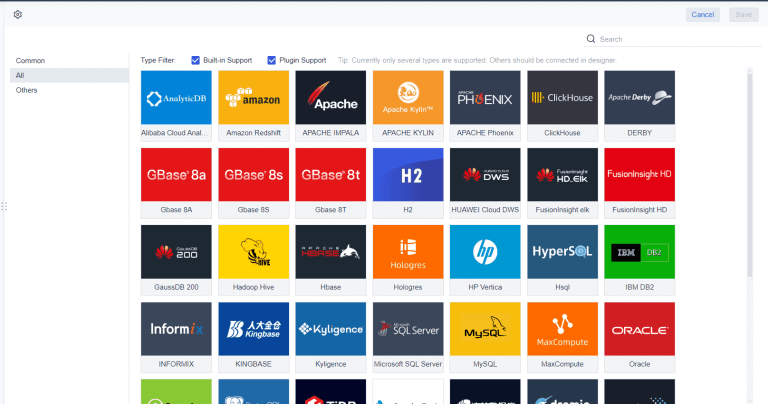
With FineReport, enterprises can connect reporting to trusted systems and build:
This step already delivers value before AI enters the picture.
Decide what should stay in Excel and what should move beyond it
Keep flexible analysis in spreadsheets where teams still need it
Excel still has a place for:
ad hoc modeling
one-off calculations
local planning work
analyst-side scenario testing
A phased upgrade works better than forced replacement.
Move cross-functional dashboards and shared KPIs into a more structured environment
High-value shared reporting should move into FineReport when it needs:
one trusted version
access control
scheduled distribution
multi-level drill-down
recurring business use
management visibility
auditability
This is the foundation for later AI report consumption. Dora performs best when it can retrieve metrics, cockpits, and reports from a governed reporting environment rather than from uncontrolled spreadsheet copies.
Step 4: Design an operational cockpit around decisions
An operational cockpit should not be a crowded screen of charts. It should help each role understand what is happening, what is abnormal, and what needs action next.
Core framework: the report elements that turn excel report templates into a cockpit
A practical cockpit usually combines several report elements. Each one should have a clear purpose, a business owner, and an AI use case.
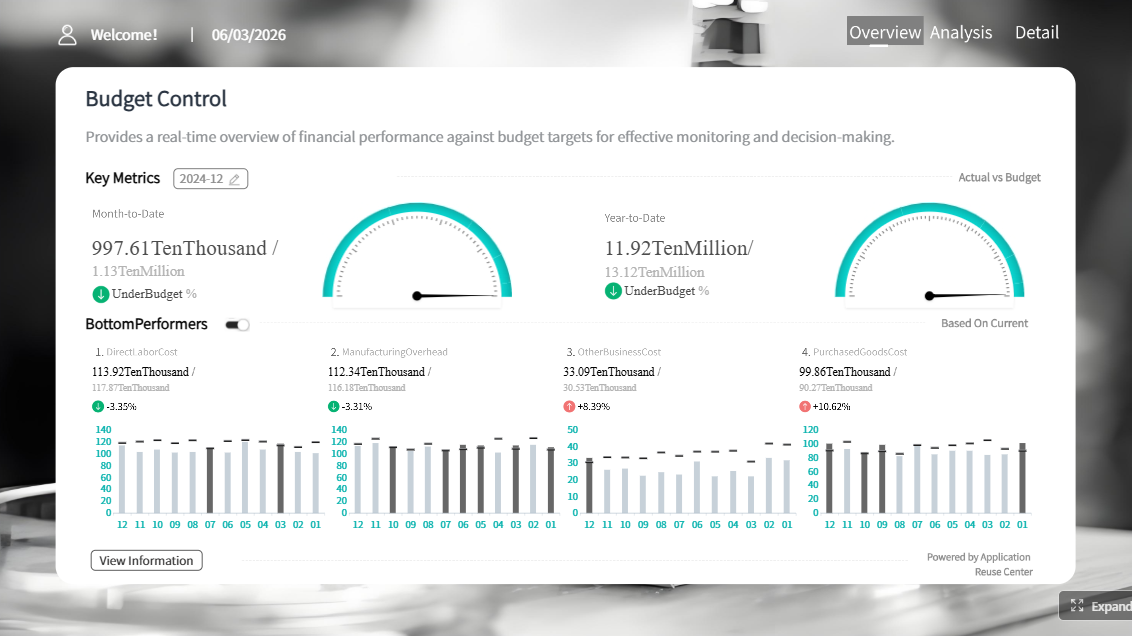
KPI summary panel
Definition: A top-level view of the most important metrics such as revenue, margin, production volume, order fulfillment, project completion, or cash collection.
Business value: Gives executives and managers a fast snapshot of current performance versus target.
AI use:Dora can summarize the KPI panel, explain major changes, and generate a structured report summary for daily or weekly management review.
Trend analysis charts
Definition: Historical views showing movement over time, such as weekly sales trend, monthly cost variance, or production efficiency trend.
Business value: Helps users distinguish isolated noise from persistent performance shifts.
AI use:Dora can generate chart explanations, highlight turning points, and answer natural-language questions about why a trend changed.
Exception and alert list
Definition: A focused list of overdue items, threshold breaches, abnormal fluctuations, delayed projects, stock risks, or quality issues.
Business value: Turns reporting from passive visibility into active management.
AI use:Dora can act as a Risk Alert Officer, monitor governed thresholds, push exception alerts, and route follow-up to the responsible owner.
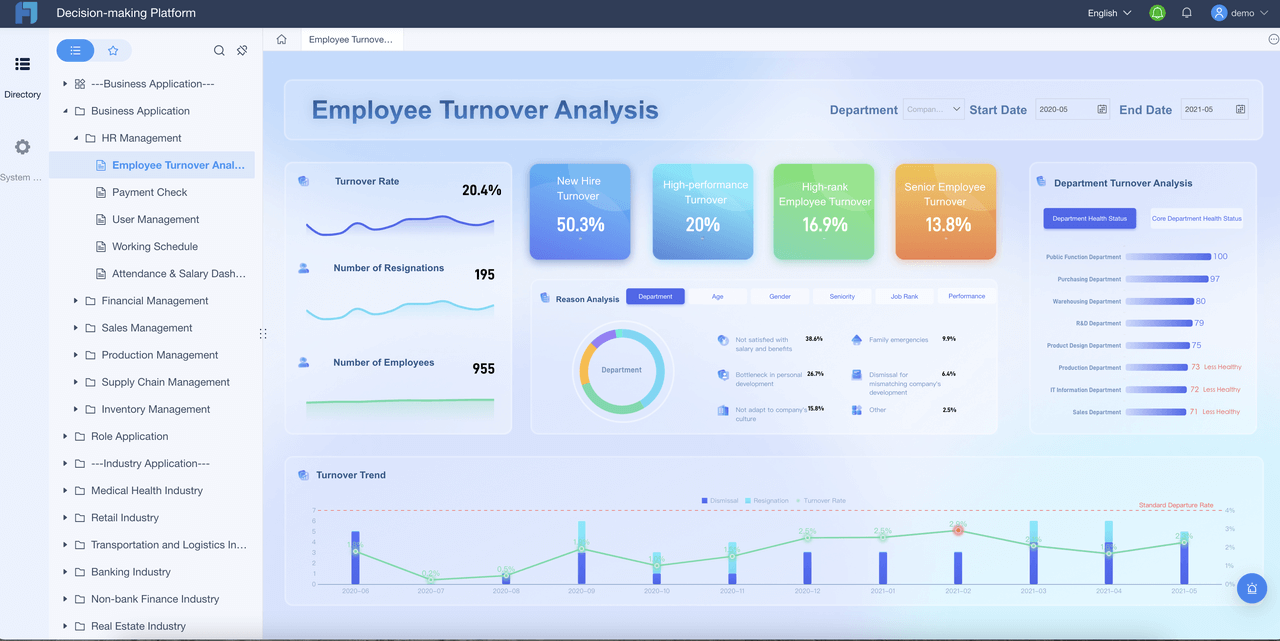
Department or team performance view
Definition: A breakdown of KPI performance by department, region, line, branch, project, or team.
Business value: Supports accountability and makes it easier to identify where action is required.
AI use:Dora can compare business units, summarize which areas are underperforming, and prepare a role-specific briefing for each manager.
Drill-down detail table
Definition: A transactional or detailed record view behind summary indicators.
Business value: Lets teams move from “what happened” to “where exactly is the issue.”
AI use:Dora can retrieve the relevant detailed section from FineReport, explain which records are driving the exception, and prepare a chart-based answer in chat.
Action and follow-up section
Definition: A record of issue ownership, due dates, review notes, and status updates.
Business value: Ensures that insights turn into action, not just presentation material.
AI use:Dora can push reminders, summarize unresolved actions, and create periodic follow-up records for review.
Focus dashboards on actions, not just visibility
Organize views around the decisions leaders need to make every day and every week
A strong cockpit starts with decision scenarios, such as:
Which customer segments need immediate sales attention?
Which production lines are creating the largest delays?
Which projects are drifting from budget or timeline?
Which receivables require escalation this week?
These are action questions, not display questions.
Prioritize KPIs, exceptions, bottlenecks, and upcoming risks
A cockpit should surface:
current status,
variance versus target,
trend direction,
exceptions needing response,
and the next owner of action.
That is where reporting becomes operational control.
Give each team the right level of detail
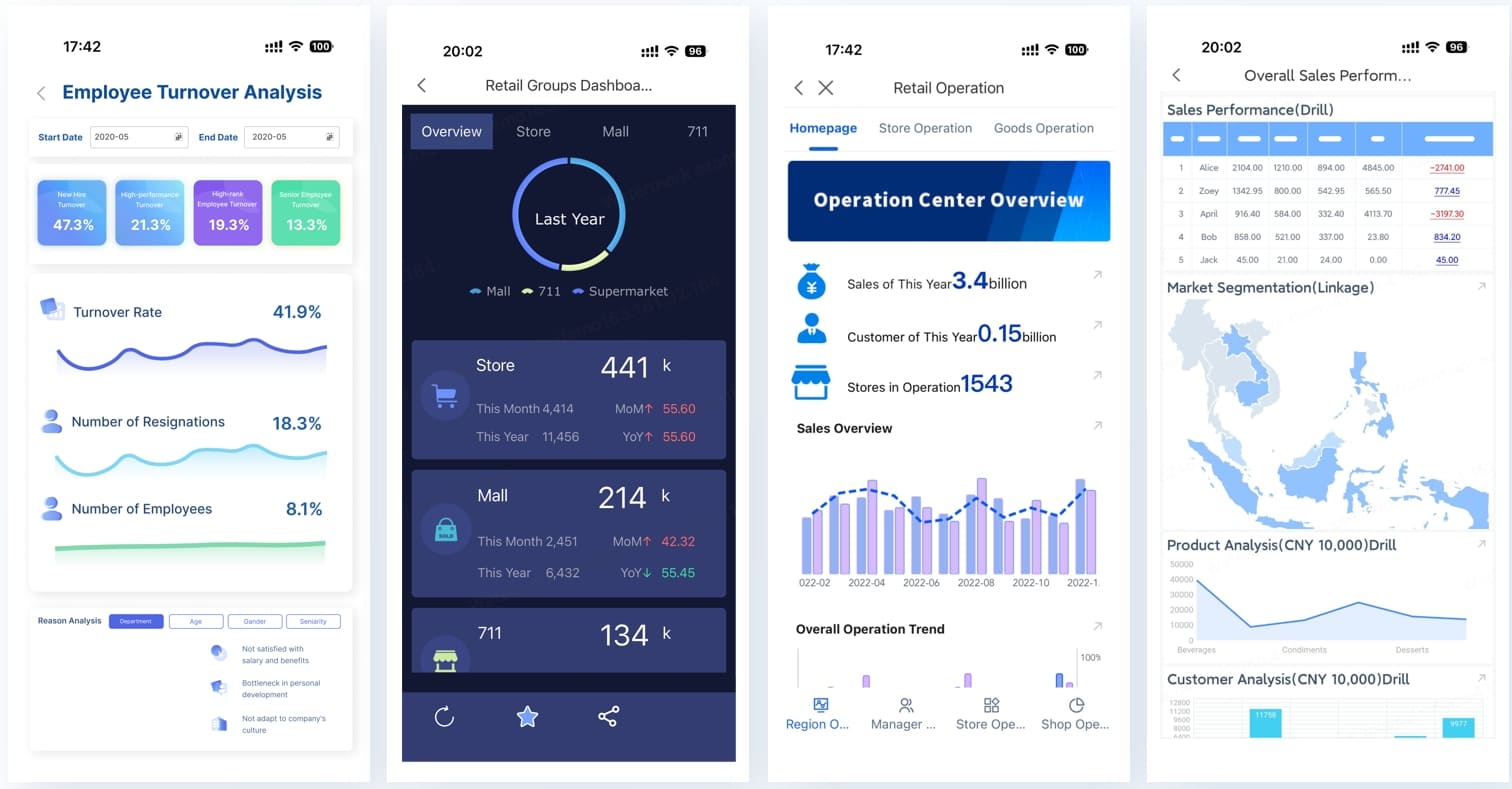
Create tailored views for executives, managers, and operational teams
Different users need different reporting depth:
Executives need summary, trend, and risk visibility.
Managers need team or unit breakdown plus actionable exceptions.
Operational users need record-level details and task follow-up.
FineReport supports this layered reporting approach with governed access and role-based views.
Balance summary indicators with drill-down access to root causes
A good cockpit lets users move from:
KPI summary
to
exception area
to
detailed transaction or case
to
owner and follow-up status
That flow is exactly what makes Dora useful. The AI assistant can interpret the summary, explain the exception, and guide users back to the trusted source report.
Step 5: Roll out the new process with adoption in mind
Technology alone does not fix reporting. Adoption happens when users see that the new workflow is easier, faster, and more trustworthy than the old one.
Start with one high-impact reporting workflow
Pilot the new approach in a process such as sales forecasting, production follow-up, or project control
Choose one recurring workflow with visible pain. Good candidates include:
Once FineReport provides the trusted reporting and operational cockpit foundation, Dora can turn report consumption into a more efficient, scenario-based workflow.
This is not about replacing analysts or managers. It is about reducing the time users spend searching, interpreting, summarizing, and forwarding reports manually.
For this scenario, the most relevant Dora digital employees are:
Daily Briefing Secretary for scheduled management summaries
Retrieve trusted FineReport report or operational cockpit data. Dora accesses the relevant governed report, management cockpit, or exception list built in FineReport.
Understand KPI definitions, report templates, filters, business terms, and semantic rules.
Because FineReport provides the reporting structure and semantic context, Dora can interpret what each metric means and which filters apply.
Generate a structured report summary through chat. Dora creates a readable management narrative, chart explanation, or dashboard-style analysis view based on trusted report outputs.
Detect exceptions, abnormal changes, overdue items, or threshold breaches.
Acting as a Risk Alert Officer or Data Analystdigital employee, Dora can identify issues that deserve management attention.
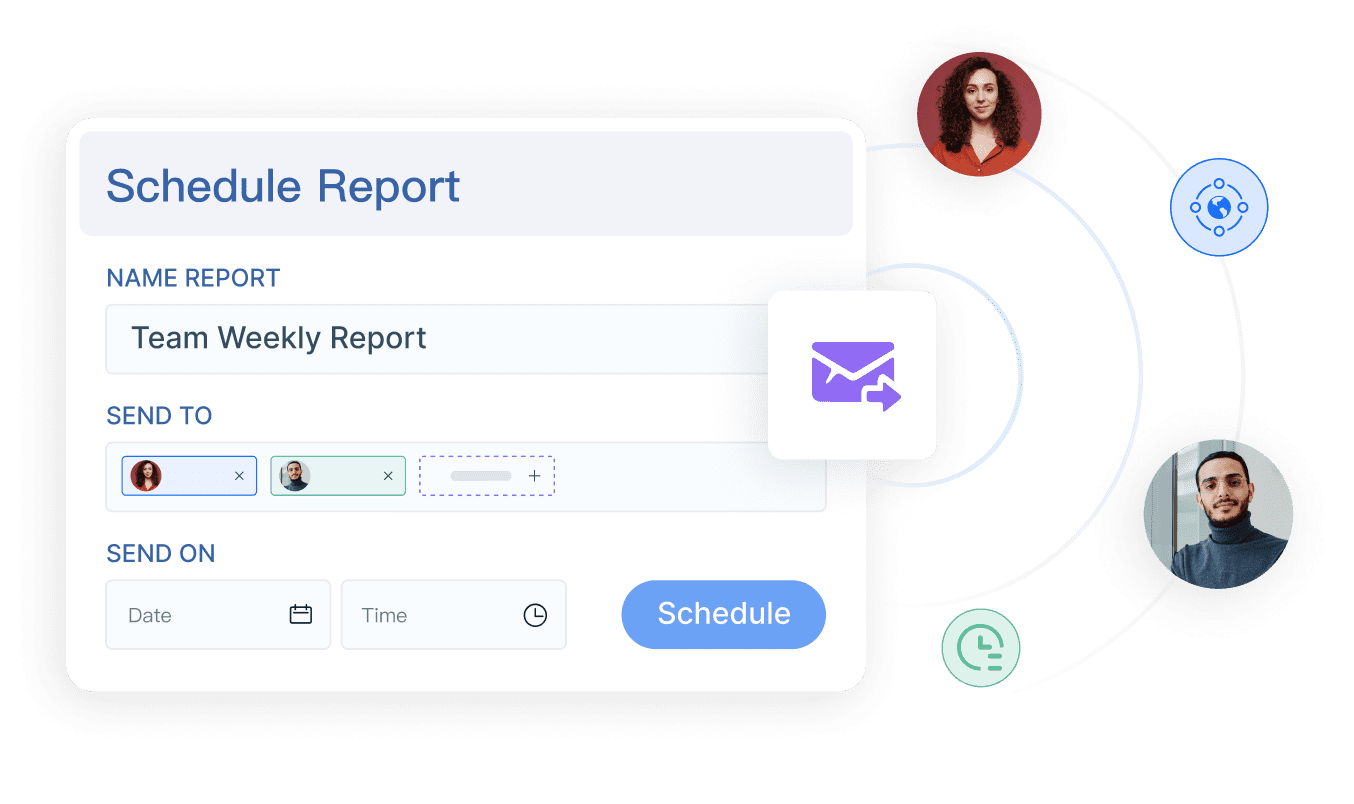
Push report summaries, alerts, or suggested follow-up to responsible users. Dora can support scheduled briefings, periodic report push, and owner notification instead of leaving insights buried inside dashboards.
Produce follow-up records or periodic review summaries. Dora helps teams keep a usable history of what was flagged, who was notified, and what remains unresolved.
Why FineReport is essential to the AI layer
Dora is most effective when it operates on a trusted reporting foundation. FineReport provides:
Without that foundation, AI answers become harder to control. With it, Dora can deliver governed AI workflows instead of loose prompt-based responses.
How Dora improves execution in real enterprise scenarios
For executives, the value is simple: recurring reporting work becomes easier to consume and act on.
For IT teams, the role shifts from manually building every report request to improving:
data connections
semantic layers
KPI definitions
permissions
template standardization
reusable agent Skills
For business users, Dora reduces reporting friction through:
natural-language query over trusted reporting assets
chat-based answers tied to FineReport reports and cockpits
structured report summaries and chart explanations
scheduled daily or weekly briefings
exception alerts and push notifications
follow-up assistance on repeatable workflows
This is why Dora should be positioned as an enterprise Data Agent and fourth-generation Agentic BI, not as a generic chatbot. It is designed for governed scenario execution, stronger enterprise fit, and more stable workflows than prompt-only approaches.
Step 6: Continuously improve the cockpit as the company grows
No cockpit should remain static. Business priorities change, and reporting should evolve with them.
Review KPIs and report relevance every quarter
Remove reports nobody uses
Add views that support new products, regions, plants, or management priorities
Strengthen data quality and workflow automation over time
Improve cross-team alignment on definitions and actions
This is also the stage where Dora’s value can expand. Once one workflow works well, enterprises can add more AI digital employee scenarios such as:
monthly management briefing
finance risk summary
sales pipeline follow-up
quality anomaly alert
project review summary
The strongest AI adoption path is incremental, scenario-led, and governed.
Step 7: Turn the cockpit into an enterprise operating system for decisions
The final upgrade is cultural as much as technical. Once reports are standardized, connected, role-based, and AI-assisted, the cockpit becomes more than a dashboard. It becomes a shared operating layer for execution.
At this stage, teams are no longer asking:
“Which Excel file is the latest?”
“Who changed this formula?”
“Can someone summarize the report before the meeting?”
Instead, they work from one trusted reporting environment and use Dora to accelerate understanding and follow-up.
For a growing enterprise, that is the real move from excel report templates to operational control.
Actionable best practices
1. Standardize report templates, KPI definitions, business terms, and exception rules first
If definitions vary by team, neither dashboards nor AI summaries will be trusted. Build the governance foundation before scaling usage.
2. Start with high-value recurring reports instead of automating every report
Monthly management packs, weekly operations reviews, and recurring risk reports are usually the best first use cases for FineReport + Dora.
3. Preserve permission governance so AI outputs respect FineReport access boundaries
Dora should follow governed access rules. Users should only see the reports, metrics, and details they are allowed to access.
4. Treat data quality as part of the AI implementation
AI does not fix bad source logic. Trusted data connections, semantic setup, and controlled report templates matter as much as the assistant experience.
5. Use human review for AI-generated report narratives and gradually expand Skills
Start with structured summaries and controlled follow-up workflows. Then expand Dora’s Skills as confidence in governance, report quality, and business rules improves.
Building this manually is complex. FineReport helps teams standardize trusted reports, operational cockpits, templates, and reporting workflows. Dora turns those assets into an AI assistant that can answer report questions in chat, generate structured summaries, push scheduled briefings, monitor exceptions, and follow up with responsible owners.
For enterprises trying to move beyond uncontrolled excel report templates, this combination is practical because it connects three layers that often fail when handled separately:
the reporting foundation,
the AI consumption layer,
and the governance and rollout work needed to make the scenario land.
FineReport + Dora is not only a reporting upgrade; it is a practical fourth-generation Agentic BI path.FineReport provides governed reports and operational cockpits. Dora provides the AI assistant layer for scenario execution, with more controlled Skills, lower token waste, faster execution paths, and more stable workflows than prompt-only agents.
Get Ready-to-Use Dashboard Templates in Fine Gallery
The strongest Dora pitch is scenario + product + service: FineReport provides the trusted reporting foundation, Dora provides the AI digital employee, and implementation service connects data, governance, semantic setup, Skills, report templates, permissions, and rollout.
Conclusion: A practical path from spreadsheet reporting to operational control
Growing enterprises do not need to abandon Excel overnight. In many cases, some spreadsheet analysis should remain where it is useful. But critical reporting should no longer depend on uncontrolled files, version confusion, and manual consolidation.
A phased upgrade path works best:
audit current reports,
standardize templates and metrics,
connect trusted data flows,
build an operational cockpit around decisions,
roll out one high-impact workflow,
improve continuously,
and add an AI Data Agent layer for faster report consumption and follow-up.
That is how scattered excel report templates evolve into a reliable decision system.
Excel report templates usually become a problem when teams rely on duplicate files, manual consolidation, and delayed updates to make decisions. If people spend more time checking versions than discussing actions, the reporting model is no longer scaling well.
An Excel report template is a static document used to capture and format data, while an operational cockpit is a shared system for tracking KPIs, trends, and exceptions in near real time. The cockpit is designed to support action, ownership, and consistent decision-making across teams.
Most companies should start by auditing current reports, identifying the few that drive recurring decisions, and mapping their data sources and owners. From there, they can standardize high-value reports first and gradually shift them into a governed dashboard environment.
Prioritize reports that are reused every week or month, edited by multiple departments, and discussed in management reviews. Sales forecasts, profit and loss summaries, production reports, inventory aging, and receivables tracking are common first candidates.
FineReport provides the trusted reporting foundation and cockpit experience, while Dora adds an AI layer for faster understanding and follow-up. Teams can get report summaries, spot exceptions sooner, and route actions to the right owners without waiting for manual analysis.
Product Trial
FineReport
Pixel-perfect reports · Interactive dashboards · Easy data entry · Digital twins