If your team needs reports that must look the same every time, arrive on schedule, print cleanly, and export reliably to PDF or Excel, SQL reporting services still solves a very specific business problem in 2026. For IT managers, report developers, and operations leaders, the pain points are familiar: users asking for board-ready statements, finance requiring exact pagination, compliance teams demanding consistent archived outputs, and administrators needing centralized control over report delivery. This is where SSRS remains useful: not as a trendy BI layer, but as a dependable engine for governed, repeatable, pixel-precise reporting.
SQL reporting services at a glance
SQL Server Reporting Services (SSRS) is Microsoft’s server-based reporting platform for creating, publishing, managing, and distributing structured reports. In plain language, it helps organizations turn database results into formal reports that people can read, print, export, and receive automatically.
That matters most when raw query output is not enough. A SQL result set may answer a question, but business teams often need something more controlled: invoices, monthly operating packs, audit-ready statements, branch summaries, production logs, or customer-facing documents.
In the Microsoft data and analytics ecosystem of 2026, SSRS sits in a narrower but still important role. It is not the primary tool for broad self-service analytics or highly interactive dashboarding. Instead, it is best understood as a paginated reporting and scheduled delivery platform for organizations that value exact layout, repeatable exports, and server-managed distribution.
Who should care?
Report developers who need precise layout control
Data analysts who must deliver consistent recurring reports
IT administrators who manage permissions, schedules, service accounts, and server deployment
Business stakeholders who consume board packs, operational summaries, invoices, statements, and compliance documents
Finance and operations teams that depend on repeatable exports rather than exploratory dashboards
Key Metrics (KPIs) to evaluate a reporting scenario
When deciding whether SSRS is the right fit, these are the most important metrics and decision signals:
Pagination accuracy: Whether the report must preserve exact page breaks and printable formatting
Export fidelity: How consistently the output renders to PDF, Excel, or Word without layout issues
Delivery automation rate: The extent to which reports must be scheduled, subscribed to, and distributed automatically
Parameter reuse: Whether users need the same report filtered by date, region, entity, or department
Security granularity: How precisely access must be controlled by role, folder, or report item
Report volume: The number of recurring operational or compliance reports that must be run and distributed
Governance requirement: The need for central administration, version control, and managed publishing
Interactivity need: Whether users need static, formal reports or dynamic drill-heavy exploration
Template consistency: The importance of standard report structure across teams or entities
Archival reliability: Whether the business needs consistent snapshots for audits, legal review, or historical recordkeeping
What SQL reporting services (SSRS) is and how it works
Core components and architecture
At its core, SSRS works through a report server architecture. The server stores report definitions, connects to data sources, processes queries, renders reports into different output formats, and manages security and scheduling.
The essential components are:
Report Server: The engine that processes reports, runs schedules, manages subscriptions, and serves content
Web Portal: The browser-based interface where users view, organize, and manage reports
Data Sources: Shared or embedded connections to SQL Server and other supported systems
Datasets: Queries or stored procedures that retrieve the report data
The dataset query runs with any passed parameters.
The server processes logic, grouping, formatting, and expressions.
The final report is rendered in the chosen format.
The output is viewed in a browser, emailed, saved to a file share, or exported manually.
Security is typically role-based. Access can be managed at the folder, report, or shared resource level. For enterprise teams, this matters because reporting governance is rarely just about design; it is about who can view, edit, deploy, schedule, or administer.
The types of reports SSRS is best known for
SSRS is best known for paginated reports. These are reports designed with fixed layout in mind, where every row, section, margin, and page break matters.
Common report types include:
Paginated reports: Multi-page structured reports optimized for printing and formal distribution
Operational reports: Daily or weekly summaries used by operations, logistics, service teams, or branch managers
Printable documents: Invoices, statements, labels, purchase summaries, and regulatory forms
Subscription-based reports: Reports automatically delivered on a schedule by email or to shared locations
Typical output formats include:
PDF for print-ready distribution
Excel for downstream review and controlled manipulation
Word for document-style sharing
HTML/web viewing for browser access
CSV/XML for basic export or integration workflows
This is the crucial distinction: SSRS is not mainly about “visual storytelling” in the modern BI sense. It is about controlled document output.
How SSRS compares with Power BI and other reporting tools
This is where many teams get confused. They compare SSRS to Power BI as if they serve the same primary purpose. They do not.
In many enterprises, the real architecture is not either-or. Teams often use one tool for interactive analysis and another for formal reporting output.
This is also where platforms such as FineReport enter the conversation. If your organization wants strong document-style reporting but also expects a more modern design experience, broader dashboard capability, or flexibility beyond the traditional Microsoft stack, it is reasonable to compare SSRS with FineReport and other enterprise reporting tools. A pragmatic evaluation should focus on output requirements, usability, governance, and deployment model rather than brand familiarity alone.
What changed in recent versions and what matters in 2026
From legacy SQL Server bundles to the modern SSRS release model
Historically, many professionals learned SSRS as something bundled tightly with SQL Server. That is why older documentation, training courses, and internal system inventories still refer to versions such as SQL Server 2019 Reporting Services.
Over time, SSRS shifted toward a more standalone release and deployment model. In practical terms, that changed how teams think about installation, upgrades, and lifecycle management. Instead of assuming reporting services simply “comes with the database server” in the old sense, administrators now need to think more deliberately about reporting infrastructure as a distinct workload.
For readers in 2026, this matters because you will still encounter mixed terminology:
SSRS documentation referencing older SQL Server version numbers
Internal servers labeled around 2017, 2019, or 2022-era reporting deployments
Training content that predates more recent Microsoft reporting consolidation changes
The takeaway is simple: when evaluating an environment, verify the actual installed reporting platform, version, support status, and roadmap, not just the legacy naming.
Key capabilities, limitations, and ecosystem changes
In 2026, the most relevant discussion is not nostalgia. It is operational fit.
Important capabilities that still matter:
Browser-based access to reports through a web portal
Export to business-friendly formats such as PDF and Excel
Parameterized reports for repeatable filtered output
Less compelling for highly interactive visual exploration
More developer- and admin-oriented than business-user friendly
Can create maintenance overhead if report sprawl is not governed
User experience may feel dated compared with modern analytics platforms
There are also ecosystem realities to consider. Microsoft’s reporting landscape has evolved, and some legacy concepts around mobile reporting or hybrid use patterns have shifted over time. For many enterprises, the practical question is no longer “Can SSRS do reporting?” but “Is this the right long-term reporting layer for our specific outputs?”
That is why maintenance and upgrade planning matters. If your team is running older SSRS content, ask:
Are reports still business-critical?
Are developers available who understand the current deployment model?
Are security and credentials documented properly?
Is your export behavior still meeting stakeholder expectations?
Would modernization reduce support load?
Is SSRS still relevant today?
Yes, SSRS is still relevant in 2026, but only when matched to the right use case.
Exact formatting for finance, audit, or customer-facing documents
It is less sensible as the main answer for enterprise-wide interactive analytics.
That distinction is important because many failed reporting programs happen when teams force one platform to do everything. SSRS still fills a clear role. It just is not the entire reporting strategy for most modern organizations.
When to use SQL reporting services and when not to
Best-fit scenarios
SSRS is a strong fit when report layout is part of the requirement, not a cosmetic detail.
Operational summaries generated on a daily, weekly, or monthly schedule
Management packs distributed by email or shared folders
Parameterized reports reused across departments, regions, or time periods
Why these scenarios still matter:
Subscriptions reduce manual distribution work
Parameters allow one report design to serve many audiences
Controlled exports improve consistency across the business
Repeatable delivery supports governance and auditability
For organizations evaluating alternatives, this is also the point where a broader comparison makes sense. If the requirement is mostly fixed-format reporting, SSRS is still viable. If the requirement expands into dashboarding, portal embedding, cross-source reporting, or more flexible designer experiences, tools like FineReport may offer a more balanced path. Compared with SQL reporting services, FineReport typically appeals to teams that want both formal reports and modern dashboards in one platform. Compared with classic SQL reporting services and some older reporting workflows, it can also reduce the gap between IT-controlled reporting and business-facing usability.
Cases where another tool may be better
You should not default to SSRS if your primary need is:
Ad hoc exploration by nontechnical users
Highly interactive dashboards
Drag-and-drop self-service analysis
Broad KPI storytelling across executives and departments
Real-time cross-filtering and exploratory visual workflows
In those cases, Power BI or another modern analytics platform is usually a better fit.
Likewise, if your team is comparing SSRS, FineReport, and SQL reporting services alternatives more broadly, use these decision criteria:
Do users need documents or dashboards?
Is the output consumed on paper, in inboxes, or in live portals?
How much report design must be centralized?
How technical are the report builders?
How important is exact export fidelity?
If the answer leans toward document control and scheduled distribution, SSRS remains relevant. If it leans toward interactive consumption and broad self-service, another tool will likely outperform it.
A simple decision framework
Use this checklist before choosing a reporting platform:
Audience: Are users consumers of formal reports or explorers of data?
Format: Does the output need to be paginated, printable, or export-perfect?
Skill profile: Do you have report developers, or do business users need to build content directly?
A quick rule of thumb:
Choose SSRS for formal, recurring, exact-layout reporting
Choose Power BI for interactive analytics and self-service exploration
Evaluate FineReport or similar enterprise reporting tools when you need both strong reporting output and broader dashboard capability with a more unified business-facing experience
Installing, configuring, and getting started
What setup typically involves
A typical SSRS setup includes:
Installing the report server
Creating or connecting the report server databases
Configuring service settings
Setting up web service and portal URLs
Validating browser access
Testing permissions and data connections
The two core administrative touchpoints are usually:
Report Server Configuration Manager for service setup, database connection, URLs, email, and execution settings
Web portal administration for folders, permissions, shared resources, and report access
From a consulting perspective, the biggest setup mistake is treating installation as the whole project. Installation is only the start. Production readiness depends on identity, security, credential strategy, deployment process, and support documentation.
Beginner learning path
If you are new to SQL reporting services, start with one controlled project instead of trying to master the full platform all at once.
A good first project path:
Connect a data source to a test SQL Server database
Build a simple paginated report with a table or matrix
Add parameters such as date range, region, or department
The most common SSRS issues are not about report design. They are about operations.
Watch out for these pitfalls:
Permissions confusion between server roles, folder access, and database access
Service account mistakes that break remote database connectivity or subscriptions
Credential handling problems in shared data sources
Environment drift between development, test, and production
Undocumented URL and email settings
Weak deployment planning that turns report changes into risky manual work
Export surprises caused by poor page sizing or inconsistent layout decisions
Best practices I recommend as a consultant:
Standardize shared resources early
Use shared data sources, naming standards, folder structures, and parameter conventions from the beginning.
Design for the final export format first
If the business consumes PDF, design and test in PDF early. If they consume Excel, validate tabular behavior before sign-off.
Separate dev, test, and production clearly
Avoid direct editing in production. Treat reports like managed assets, not ad hoc files.
Document service accounts and credential strategy
This single step prevents a large percentage of upgrade and support issues.
Control report sprawl with governance
Not every department request needs a brand-new report. Reuse parameters, templates, and shared datasets where possible.
After your initial rollout, it is often worth reviewing whether the reporting estate should remain purely SSRS-based or evolve into a broader reporting stack. This is where some organizations introduce FineReport for dashboarding and business-facing delivery while keeping certain SSRS assets for legacy or compliance-heavy workloads. Others replace older SSRS report sets entirely if maintenance cost outweighs value.
Conclusion: choosing SQL reporting services with confidence in 2026
In 2026, SQL reporting services still has a clear place in enterprise reporting. SSRS is not the most modern tool for every analytics need, and it should not be positioned that way. But when the requirement is exact formatting, predictable scheduling, centralized governance, and reliable export delivery, it remains highly practical.
The smart decision is not to ask whether SSRS is “old” or “new.” The smarter question is whether your reporting scenario depends on:
Exact page layout
Controlled recurring delivery
Formal printable output
Parameter-driven repeatability
Governance and permissions
If yes, SSRS is still worth considering. If your priorities are exploration, interactivity, and self-service, you should likely look elsewhere.
For teams evaluating, implementing, or modernizing a reporting environment, the next step is to map your reporting portfolio by use case. Separate operational documents from analytic dashboards. Identify which reports truly need paginated precision. Then choose the platform that fits the job instead of forcing one tool to satisfy every reporting demand.
If you want a faster path to building governed reports and dashboards with a more modern enterprise reporting experience, FineReport is worth evaluating alongside SSRS and Power BI.
SQL Server Reporting Services is mainly used for paginated, fixed-layout reports that need consistent formatting, scheduled delivery, and reliable exports to formats like PDF and Excel. It is still a strong fit for invoices, board packs, compliance reports, and other formal business documents.
Yes, SSRS remains relevant when the priority is print-ready layout, exact pagination, and automated distribution rather than interactive self-service analysis. Many organizations use it alongside dashboard tools instead of replacing them.
SSRS works best for recurring operational and compliance reports where page structure, templates, and export fidelity matter. Common examples include financial statements, invoices, audit reports, production logs, and scheduled summaries.
SSRS can run reports on schedules and send them through subscriptions, typically by email or file share delivery. This helps teams distribute the same filtered report to the right people without manual effort each time.
Microsoft has consolidated on-premises reporting services under Power BI Report Server starting with SQL Server 2025. That change matters most for planning upgrades and long-term reporting architecture, but the core need for paginated reporting still remains.
Product Trial
FineReport
Pixel-perfect reports · Interactive dashboards · Easy data entry · Digital twins



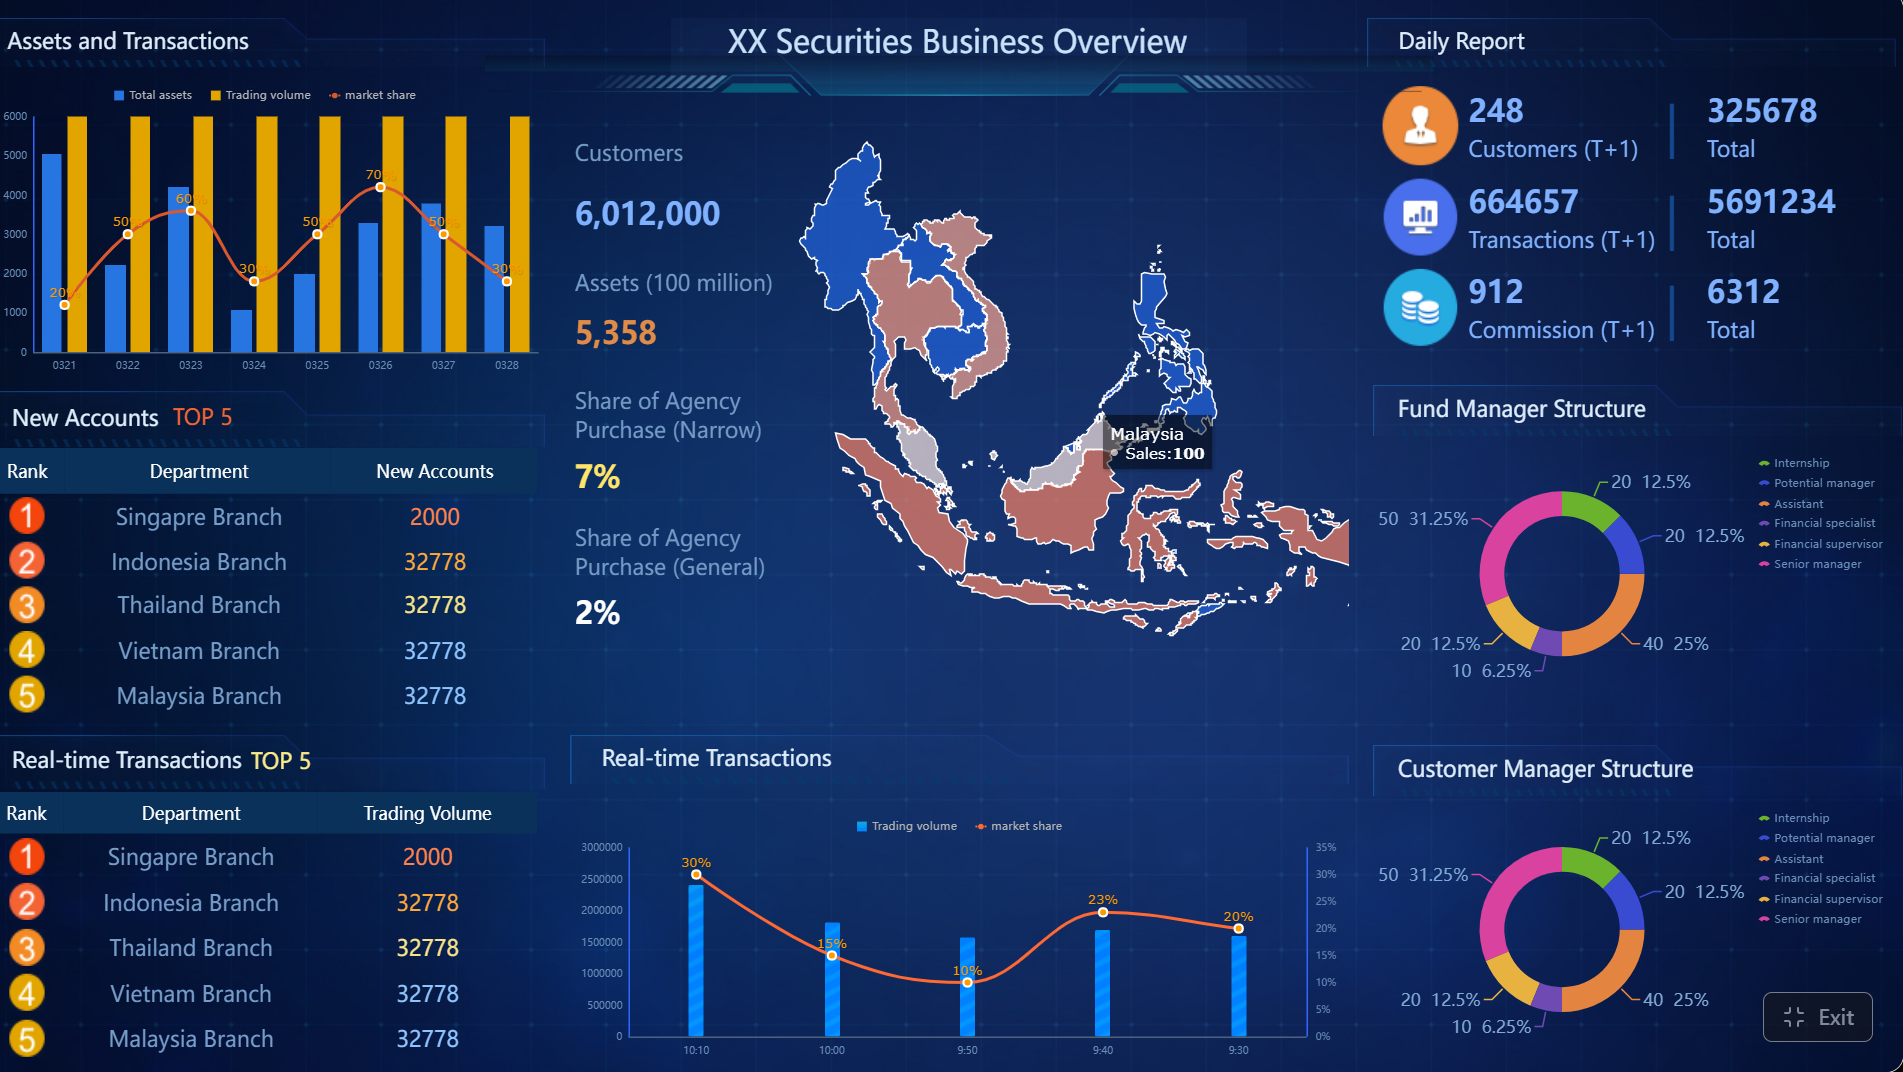 An Interactive Dashboard created by