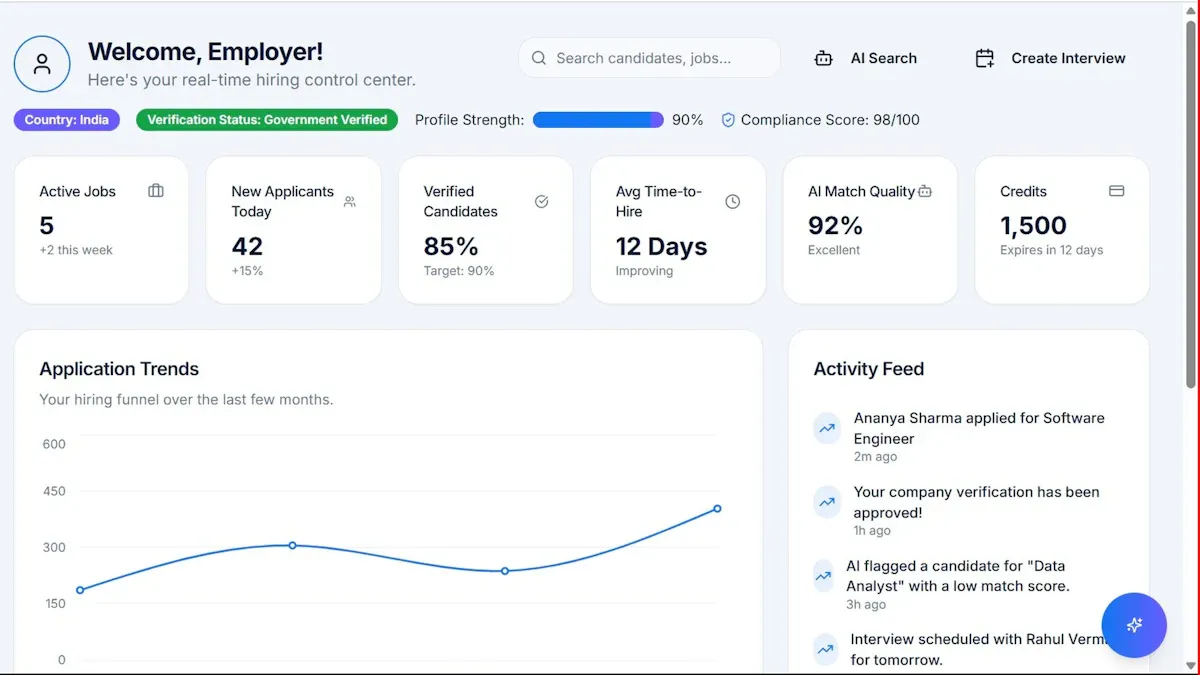
An SSRS report is a structured, server-delivered report built with SQL Server Reporting Services to turn database data into printable, shareable, and governed business output. For IT managers, BI leads, and operations teams, the value is simple: SSRS solves the recurring need for pixel-perfect reports, scheduled delivery, parameter-driven filtering, and controlled on-premises reporting without forcing every user into a modern dashboard tool. If your organization still depends on invoices, statements, audit logs, compliance packs, or fixed-layout internal reports, SSRS remains highly relevant in 2026 because it handles operational reporting with predictability and control.
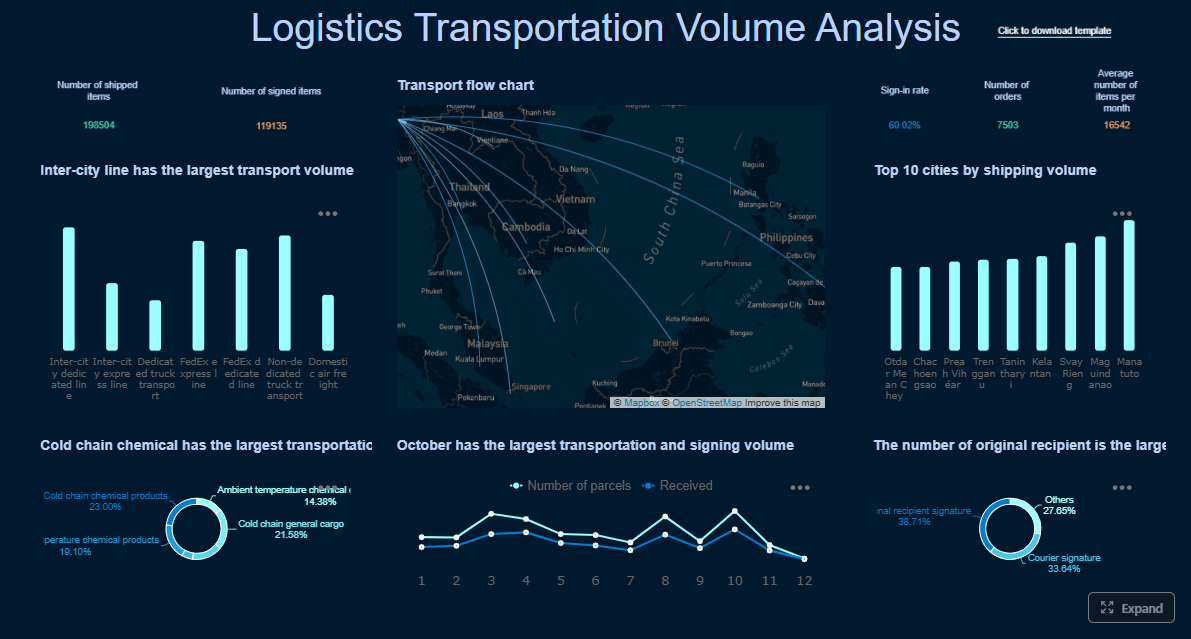 Click To Try The Dashboard
All reports in this article are built with FineReport
What an SSRS report is and how it fits into modern reporting
An ssrs report is a report definition that pulls data from one or more sources, applies business logic and formatting, and renders the result into a usable output such as HTML, PDF, Excel, CSV, or Word-compatible documents. In plain language, it is Microsoft’s long-standing way to convert raw SQL data into formal business reports people can read, print, export, or receive automatically.
This matters because a database query alone is not a business report. Decision-makers need titles, grouping, totals, charts, pagination, row-level visibility, and delivery workflows. SSRS adds that reporting layer on top of relational and analytical data sources.
At a high level, the platform works through a few connected building blocks:
- Report: The finished artifact users run and view.
- Report server: The engine that stores, processes, secures, and delivers reports.
- Data source: The connection information for a database or other system.
- Dataset: The query and returned fields used by the report.
- Parameters: User inputs such as date range, region, department, or customer ID.
- Rendering format: The final output format, such as browser view, PDF, Excel, or CSV.
An SSRS report typically begins with a query against SQL Server, Oracle, or another supported source. That data is loaded into a dataset, passed through grouping and expressions, and then laid out in report objects such as tables, matrices, charts, text boxes, and page sections. The report server then renders the result based on the target format and user context.
Key Metrics (KPIs) to evaluate an SSRS reporting scenario
When enterprises assess whether SSRS is the right fit, these are the core metrics and evaluation points that matter most:
- Report execution time: How long the report takes to run from request to output.
- Render time by format: Performance differences between HTML, PDF, Excel, and CSV exports.
- Data freshness: How current the underlying dataset is when users open or receive the report.
- Subscription success rate: The percentage of scheduled email or file-share deliveries completed without failure.
- Parameter usability: How easily business users can filter reports without technical help.
- Layout accuracy: How consistently the report preserves formatting across print and export formats.
- Security coverage: Whether role-based access and data permissions align with governance requirements.
- Reuse ratio of shared assets: How often shared data sources and datasets reduce duplication.
- Maintenance effort per report: The time required to update layouts, queries, or logic.
- Volume scalability: The system’s ability to support large user groups or recurring batch delivery.
The reason SSRS still shows up in enterprise environments in 2026 is not because it is the newest option. It is because many organizations still need a controlled reporting platform for formal documents, recurring operational distribution, and SQL Server-centered estates. In environments where reliability matters more than flashy interactivity, SSRS continues to hold ground.
How SSRS architecture works behind the scenes
Understanding SSRS architecture helps teams decide whether they can support it, secure it, and scale it properly. The platform is not just a report designer. It is a delivery and governance layer for structured reporting.
Core components of the platform
The architecture centers on the report server, which stores report definitions, executes processing, handles authentication, and renders output for users and subscriptions. This server is the operational heart of SSRS.
Other essential components include:
- Web portal: The browser-based interface where users access reports, folders, subscriptions, and shared assets.
- Shared data sources: Centralized connection definitions reused across multiple reports.
- Shared datasets: Reusable query-based datasets that standardize reporting logic.
- Report definitions: Usually stored as RDL files, these describe layout, queries, parameters, expressions, and formatting.
- Configuration and catalog databases: Used to store metadata, schedules, settings, and report content references.
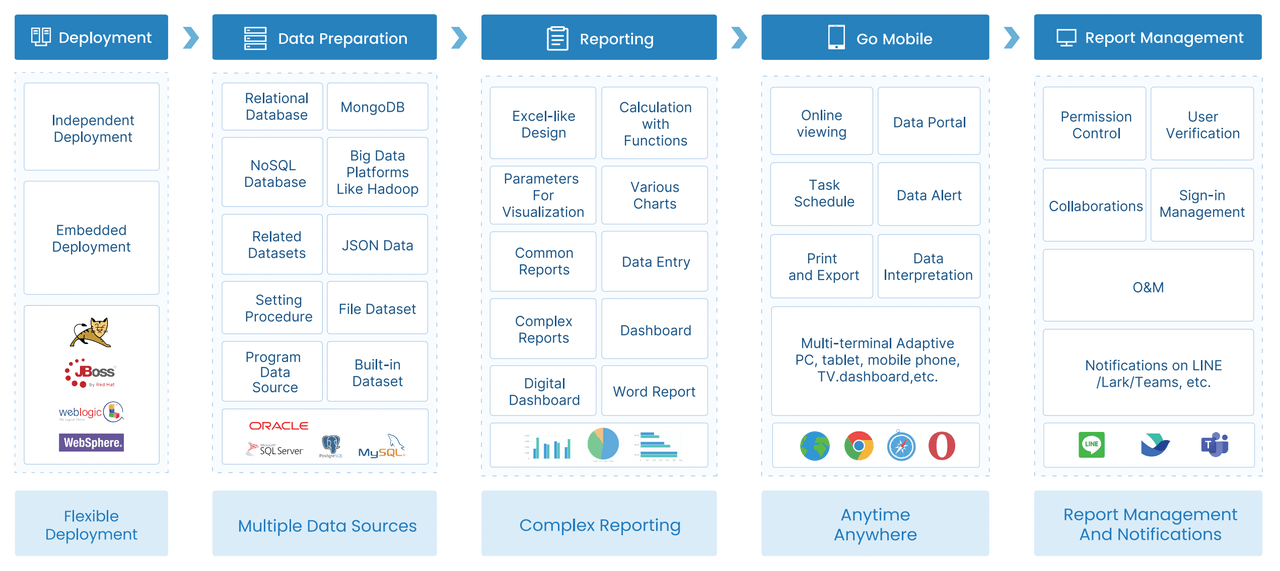
From an enterprise architecture perspective, shared assets are one of the most valuable features. They reduce inconsistency, make connection management easier, and support more disciplined reporting operations.
Data flow from source to final output
The data flow in SSRS is straightforward in concept but important in execution.
- A user opens a report, clicks a subscription link, or triggers a scheduled process.
- The report server reads the report definition.
- Parameters are applied to determine scope, filters, or report behavior.
- The server connects to the configured data source.
- The dataset query executes and retrieves data.
- SSRS processes expressions, grouping, sorting, totals, and visibility rules.
- Security rules determine whether the user can access the report and, in some designs, what data they can see.
- The report is rendered into the selected output format.
- The final report is displayed, exported, emailed, or dropped to a file share.
This pipeline is why SSRS is especially effective for stable, repetitive reporting workflows. Once configured properly, the same logic can deliver the same business document over and over with minimal manual work.
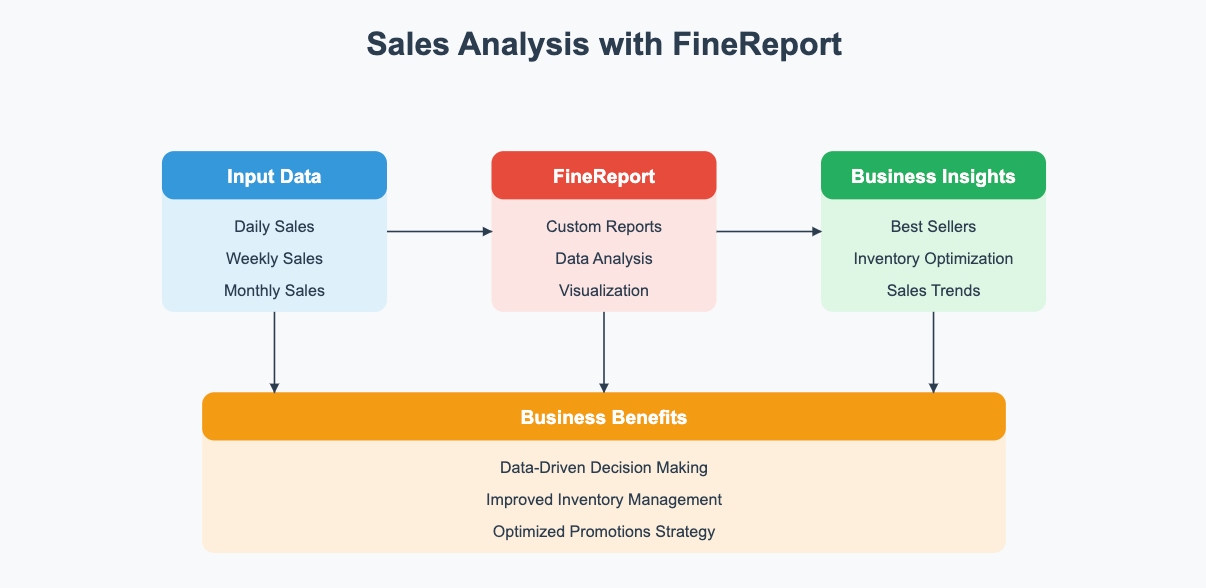
A practical note for IT teams: report performance often depends less on SSRS itself and more on query quality, indexing, parameter design, and dataset scope. Poor SQL design creates slow reports, regardless of how polished the layout appears.
Deployment, permissions, and delivery options
SSRS fits well into controlled enterprise environments because it supports layered administration and distribution.
Key deployment and management features include:
- Role-based access control for folders, reports, and resources
- Scheduled execution for regular processing
- Subscriptions for email or file-share delivery
- Export options such as PDF, Excel, CSV, XML, and browser-based viewing
- Integration with SQL Server environments for authentication, data access, and administration
- Folder hierarchies and content organization for departmental governance
For regulated organizations, this matters. Permissions can be aligned to finance, HR, operations, or compliance teams. Reports can be published once and consumed safely by many groups without duplicating the underlying logic.
Common use cases for SSRS reports
The strongest case for an ssrs report is not general analytics. It is operational, paginated, repeatable reporting where structure and consistency matter more than interactive exploration.
Operational reporting for teams and departments
SSRS is widely used for routine business reporting that needs a formal layout and dependable delivery. Typical examples include:
- Invoices
- Customer statements
- Purchase orders
- Audit trails
- Compliance documentation
- Daily sales summaries
- Warehouse pick lists
- Financial reconciliations
- Recurring departmental performance packs
These are not exploratory dashboards. They are business documents people email, print, archive, sign off on, or submit to auditors.
This is where SSRS still performs well. It was built for highly formatted reports that need consistent page breaks, repeating headers, precise alignment, and export-ready output.
Parameterized and printable reporting
A major strength of SSRS is the ability to create one report that serves many users through parameters. Instead of building separate versions for every department or date range, teams can use filters such as:
- Start date and end date
- Region or branch
- Product category
- Department
- Customer account
- Transaction status
This design makes reports both reusable and manageable. A finance manager can run the same report for one cost center, while a regional lead can run it for an entire geography.
Fixed layouts also matter more than many teams initially realize. In board reporting, billing, legal documentation, and regulated operations, “close enough” formatting is not enough. The output must be stable across printers, PDF exports, and archived copies.
SSRS also supports drill-through patterns, allowing users to move from a summary page into a detailed transactional report. That gives business users some navigational depth without turning the report into a full self-service analytics environment.
Embedded and internal business applications
Another common use case is embedding reports into internal tools. Organizations often place SSRS content inside:
- Employee portals
- Operations dashboards
- ERP extensions
- Back-office admin systems
- Customer service applications
- Internal line-of-business software
In these cases, SSRS acts as the reporting engine behind an existing workflow. The business application handles process logic, while the report server handles formatted output and document distribution.
This remains practical for enterprises that have already invested in Microsoft infrastructure and need a dependable way to add reporting into operational systems without building a document engine from scratch.
Why SSRS still makes sense in 2026
SSRS is no longer the default answer for every reporting need, but it still has a durable role. The right question is not whether it is modern enough. The right question is whether it matches the reporting job.
Where it remains a strong fit
SSRS remains a strong choice when your organization needs:
- On-premises control over report infrastructure and data access
- Pixel-perfect layouts for formal documents
- Scheduled delivery via email or file shares
- Predictable exports to PDF, Excel, and other formats
- Parameterized reports for repeatable operational use
- Tight alignment with SQL Server environments
- Controlled access and governance for departmental reporting
These are still common enterprise requirements. Many organizations have not replaced them because interactive BI tools are designed for a different purpose.
For example, a sales dashboard is ideal for trend analysis and slicing dimensions interactively. But a compliance submission packet, a remittance statement, or a month-end printable report package demands precise structure. That is where SSRS keeps earning its place.
Where newer BI tools may be a better choice
Modern BI platforms are usually better when the business requirement is:
- Interactive dashboard exploration
- Drag-and-drop self-service analysis
- Visual storytelling for executives
- Rapid ad hoc slicing across many dimensions
- Cloud-native collaboration
- Broad non-technical user adoption
SSRS has clear limitations in these scenarios. It is not the most agile option for casual users who want to explore data freely. Building and maintaining reports often requires more technical skill than modern self-service tools. Its strengths are structure and control, not open-ended analysis.
The most practical decision model is this:
- Choose SSRS when you need fixed-format operational or printable reporting.
- Pair SSRS with dashboard tools when you need both formal documents and interactive BI.
- Move beyond SSRS alone when your users mainly need self-service analytics, richer data discovery, and faster visual iteration.
That balanced approach is often the smartest path in 2026. Enterprises rarely need one tool for everything. They need the right reporting stack for different business jobs.
Getting started with SSRS today
For teams adopting or maintaining SSRS, the starting path is still manageable, especially in SQL Server-heavy environments. The challenge is not installation alone. It is setting up a maintainable operating model.
Basic setup and configuration path
A typical SSRS setup includes these steps:
- Install the reporting service on a Windows server.
- Configure the report server and its service account.
- Create or connect the report server databases.
- Set up the web portal and service URLs.
- Configure authentication, permissions, and firewall access.
- Connect shared data sources to target databases.
- Validate email or file-share delivery for subscriptions.
For enterprise teams, the real planning should happen before installation. Decide who owns report development, who owns deployment, who manages shared data sources, and how production changes will be approved.
Designing your first report
The first ssrs report usually follows a familiar workflow:
- Create a data connection.
- Build a dataset using a query or stored procedure.
- Add a tablix, matrix, or chart to the report canvas.
- Bind fields to rows, columns, or groups.
- Add parameters for filtering.
- Format page headers, footers, labels, totals, and page breaks.
- Preview the report and test export behavior.
- Deploy it to the report server.
The key is to start with a single business question. Do not begin by cramming every possible metric into one report. Strong SSRS design is purpose-built. Each report should answer a specific operational need clearly and reliably.
Tools, versions, and development workflow
Teams working with SSRS today often use a mix of report authoring tools depending on skill level and environment. Common options include:
- Report Builder for business-friendly paginated report authoring
- Visual Studio-based extensions for developer-oriented report design and lifecycle management
- Version-controlled RDL management for team collaboration
- Deployment workflows across dev, test, and production environments
Legacy maintenance is a major reality in 2026. Many enterprises are not building SSRS from scratch; they are supporting years of accumulated reports. That means teams should focus not only on new development but also on refactoring inconsistent datasets, cleaning up old folder structures, and documenting dependencies.
Best practices for choosing, building, and maintaining SSRS reports
If you want SSRS to remain useful instead of becoming a maintenance burden, follow a disciplined operating model. This is where experienced teams separate themselves from reactive report factories.
First, design each report around a clear business question. Avoid bloated reports that try to serve every department at once. Narrow scope improves usability, performance, and stakeholder satisfaction.
Second, optimize the data layer before the layout layer. Slow reports are usually caused by inefficient queries, poor indexing, over-fetching, or parameter misuse. Fixing the visual design will not solve backend inefficiency.
Third, standardize reusable assets:
- Shared data sources
- Shared datasets where appropriate
- Folder naming conventions
- Report naming standards
- Parameter naming rules
- Security role templates
- Release and rollback procedures
Fourth, design for readability. SSRS is often used in high-stakes operational contexts, so the layout must be scannable. Keep fonts consistent, totals obvious, labels precise, and page breaks intentional.
Fifth, formalize deployment and support. Do not let report changes go directly from developer desktop to production without testing. Treat reports as production software assets.
4 practical implementation best practices from a consultant’s perspective
1. Start with the output format, not the dataset
If the report must be printed, archived as PDF, or emailed to executives, design the page structure first. This forces clarity around page width, grouping logic, totals, and pagination before complexity creeps in.
2. Use parameters carefully and limit optional sprawl
Every new parameter adds testing burden and performance risk. Keep only the filters users truly need. Too many parameter combinations create confusion and inconsistent results.
3. Separate shared logic from report-specific logic
Put stable connections and reusable query assets into shared objects. Keep report-specific formatting and presentation inside the report definition. This reduces duplication and makes large report estates easier to maintain.
4. Monitor execution and subscription health monthly
Review slowest reports, failed subscriptions, stale assets, and unused content regularly. Most SSRS problems become expensive only because nobody notices them early.
Simple decision checklist: is SSRS the right reporting solution?
Use this quick checklist before you commit:
- Do you need pixel-perfect formatted reports?
- Do users need printable or archived outputs?
- Do you require scheduled report delivery?
- Is on-premises control important?
- Are your data sources primarily in a SQL Server-centric environment?
- Do you need role-based governance more than self-service exploration?
- Are report requirements relatively stable and repeatable?
If you answered yes to most of these, SSRS is still a sensible option.
If your answers lean more toward interactive exploration, ad hoc analysis, and non-technical dashboard creation, then a newer BI platform may be the better primary tool.
Build the workflow faster with FineReport
Building this manually is complex; use FineReport to utilize ready-made templates and automate this entire workflow.
For many enterprises, the reporting challenge is no longer just “Can we build a report?” It is “Can we build it fast, standardize it, scale it, and reduce maintenance overhead?” That is where a modern reporting platform becomes strategically valuable. FineReport helps teams accelerate report delivery with visual design, ready-to-use templates, centralized management, and automation features that reduce the manual effort often associated with traditional reporting stacks.
If your teams are juggling operational reports, dashboard expectations, export requirements, and internal distribution demands, FineReport offers a more efficient path to production-grade reporting without rebuilding the same components again and again.

Get Ready-to-Use Dashboard Templates in Fine Gallery
FineReport is especially compelling for teams that want to:
- Reduce custom report development time
- Standardize layouts across business units
- Support both dashboard-style views and structured reporting
- Improve collaboration between business and IT
- Scale report delivery without growing maintenance complexity
In practical terms, this means less time formatting repetitive outputs, less dependency on manual report assembly, and faster time to value for enterprise reporting initiatives.
FAQs
An SSRS report is mainly used for fixed-layout business reporting such as invoices, audit logs, statements, compliance documents, and scheduled operational reports. It is especially useful when teams need printable, exportable, and tightly controlled outputs.