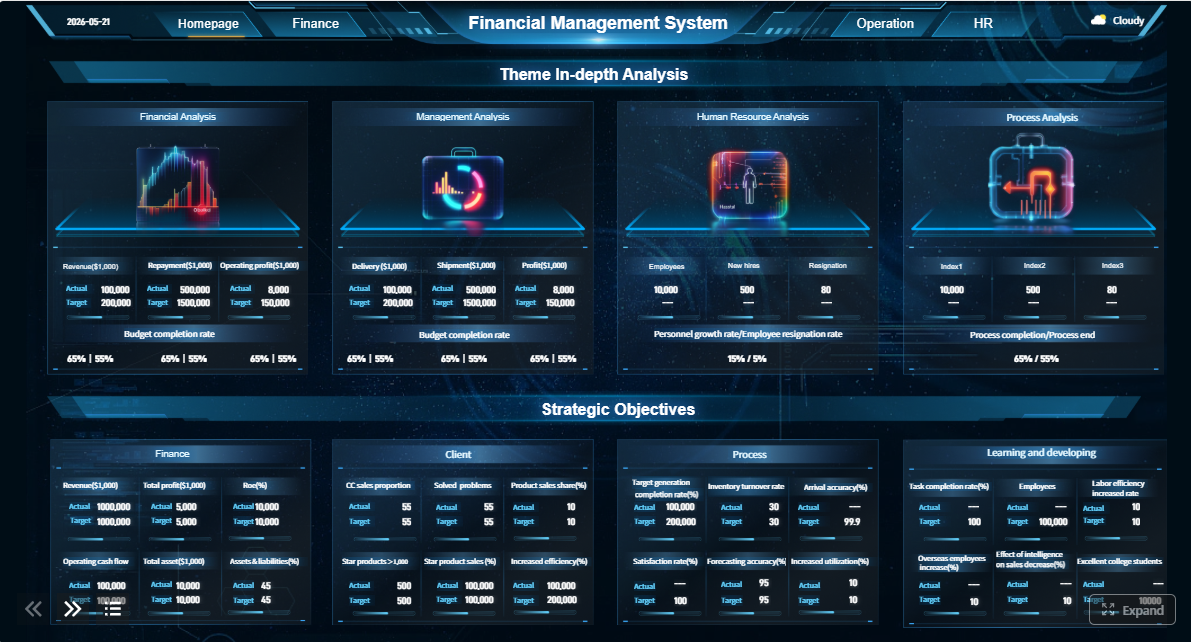
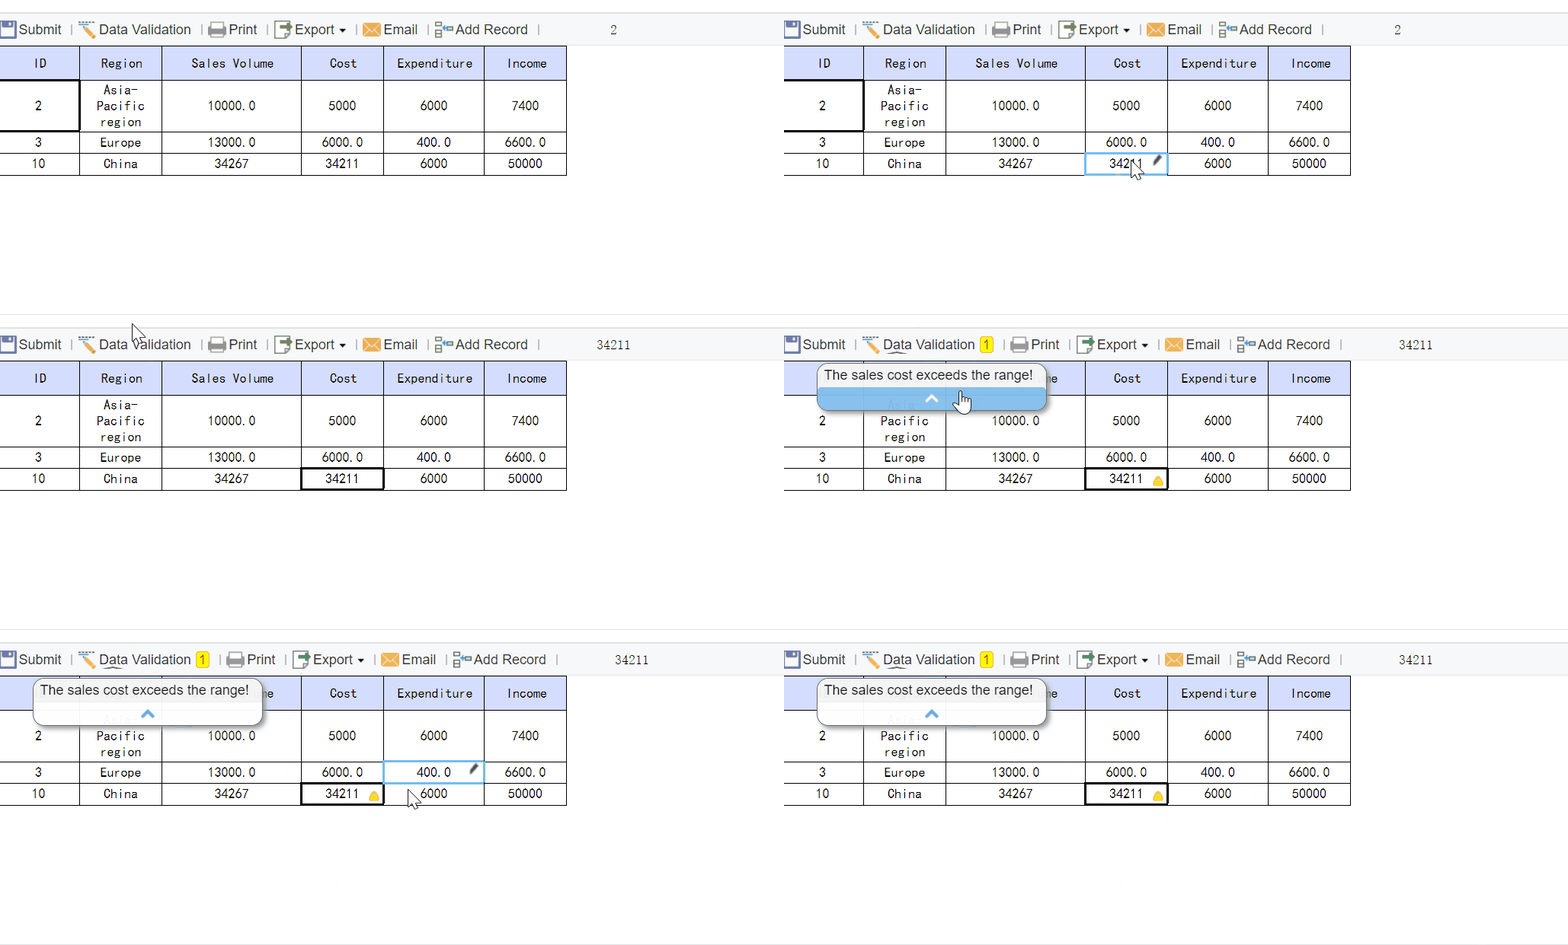
If you are searching for financial report analysis software, you are probably trying to solve a finance problem that dashboards alone do not fully address. Most finance teams do not just need charts and trend lines. They need reliable monthly packs, variance reports, cash flow visibility, board-ready outputs, controlled review workflows, and reporting that stands up under audit and executive scrutiny.
That is where confusion often starts. Many organizations evaluate BI tools and assume they will cover all finance reporting needs. BI platforms are useful for exploration and visualization, but finance teams often need something more structured: repeatable reporting processes, governed templates, printable statements, scheduled distribution, and traceable outputs that support close, review, and decision-making.
In other words, the real question is not whether dashboards are valuable. It is whether dashboards are enough for FP&A, controllership, and CFO reporting workflows.
Trusted data integration: Pulls from ERP, accounting, and operational systems without excessive manual rework.
Period comparison: Makes month-over-month, quarter-over-quarter, and budget-vs-actual analysis easy to review.
Governance and traceability: Tracks changes, permissions, and report logic to improve confidence in the numbers.
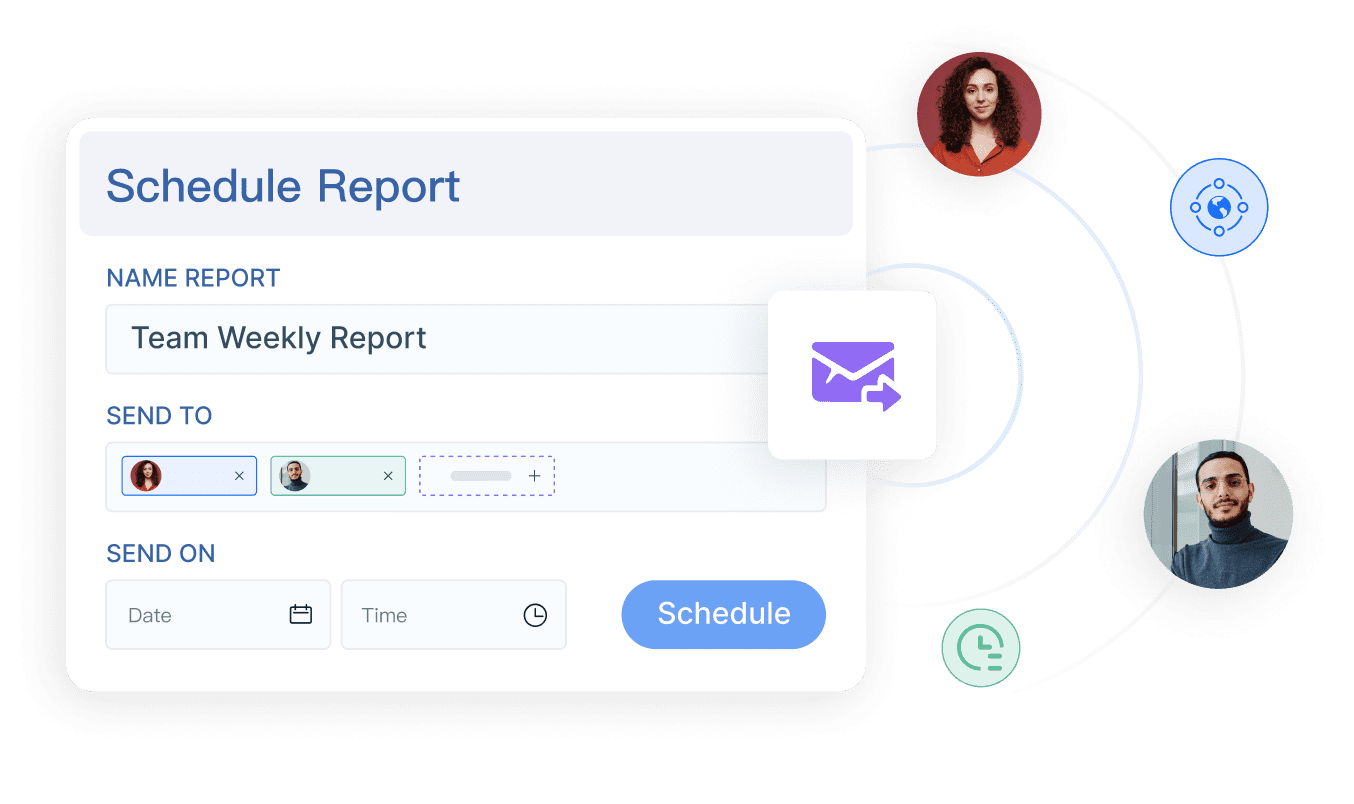
Automation: Schedules report generation and delivery for close, executive review, and stakeholder updates.
Finance-ready output: Produces printable, exportable, and presentation-ready reports, not just on-screen dashboards.
Collaboration support: Enables commentary, approvals, and cross-functional review during finance workflows.
Financial report analysis software vs BI tools: the core difference
At a high level, financial report analysis software is designed to help finance teams produce controlled, repeatable, finance-ready outputs. BI tools are designed to help users explore data, monitor metrics, and analyze trends interactively.
Both categories can overlap, but they serve different primary purposes.
Finance teams often confuse the two because both can display financial data. But displaying financial data is not the same as supporting the full finance reporting process.
Exploring data vs producing finance-ready outputs
A dashboard can show revenue trends, margin movement, or cash balances. That is useful. But finance leaders also need outputs that can be reviewed line by line, compared period over period, circulated to stakeholders, and archived as part of a formal reporting process.
Finance-ready reporting helps teams close, explain, approve, distribute, and defend results.
For example, a CFO may want an interactive dashboard for top-level KPI review, but controllers still need governed reports for reconciliation and financial review. FP&A may need scenario analysis and commentary alongside standardized reporting packs. The board may need polished exports rather than a live dashboard login.
FP&A teams, controllers, and CFO offices deal with much more than visualization. Their daily work combines analysis, reporting discipline, review processes, and communication.
Day-to-day finance requirements
Most finance teams need to manage a recurring set of responsibilities such as:
Tracking core KPIs across revenue, margin, opex, and liquidity
Monitoring cash flow and working capital
Running budget vs actual and forecast vs actual comparisons
Producing management, board, and lender reporting
Supporting monthly and quarterly close
Providing documentation for auditors and internal reviewers
Responding to ad hoc leadership questions without breaking report consistency
This is why finance often values repeatability and trust as much as speed.
KPI tracking, cash flow visibility, variance analysis, and board reporting
A strong finance reporting environment must support multiple output styles at once.
Finance teams often need:
KPI summaries for leadership review
Cash flow analysis to monitor inflows, outflows, and liquidity pressure
Variance analysis to explain changes by department, product, or region
Board reporting with concise visuals plus detailed backup schedules
Detailed drill-through when executives ask what changed and why
In many organizations, the real workload is not creating a chart. It is preparing the explanation, validating the data, and turning analysis into a formal reporting package.
Why consistency, governance, and traceability matter
Finance reporting is high-trust reporting. If two dashboards define EBITDA differently, or if a late spreadsheet adjustment is not reflected consistently, confidence erodes quickly.
Visualization helps people see performance. Governance helps them trust it.
Must-have capabilities for finance use cases
When evaluating financial report analysis software, finance teams should look for capabilities that directly support close, review, and recurring reporting.
Key requirements often include:
Period-over-period analysis
Budget vs actual and forecast vs actual comparisons
Multi-entity or consolidated reporting support
Standardized report templates
Drill-down from summary to detail
Commentary and annotations
Approval-oriented workflows
Flexible export options for Excel, PDF, or presentation use
Secure distribution to different stakeholder groups
These are the practical features that reduce last-minute reporting fire drills.
Period analysis, consolidation, and scenario comparison
Finance leaders rarely look at a single number in isolation. They want context:
What changed from last month?
Is the variance seasonal, one-time, or structural?
Which entity or department drove the movement?
What does the forecast look like under different assumptions?
Good financial report analysis software should make that process manageable without forcing teams to rebuild analysis manually each cycle.
Report standardization and stakeholder reporting
Finance also needs consistency. A monthly reporting pack should not depend on one analyst’s spreadsheet habits. Templates, locked structures, standardized layouts, and reusable report logic help teams scale reporting across entities, periods, and stakeholder groups.
Collaboration matters too. Commentary, review notes, and approvals are often part of the reporting process, especially when numbers flow to executives, boards, or auditors.
More coordination needed between finance and IT for model changes
Challenges maintaining one consistent version of finance logic across reports
Many BI environments are excellent at answering “what happened?” but less efficient at producing formal finance deliverables.
Implementation effort, data modeling, and ownership
Another key difference is ownership.
BI tools often require more centralized data modeling and semantic design. That can be valuable, especially in larger enterprises, but it may also create a gap between finance’s reporting deadlines and IT’s development capacity.
Finance leaders should ask:
Can finance own and adjust reports without waiting on technical teams?
How much data modeling is required before reports become usable?
How quickly can reporting packs be updated during close?
Does the platform support both governed outputs and analysis?
In some organizations, BI works best as a shared analytics layer while financial report analysis software handles formal reporting deliverables.
Common pain points when finance relies only on BI
When finance relies only on BI, several recurring pain points tend to show up.
Version control, metric conflicts, and reconciliation work
Finance teams often struggle with:
Multiple exported copies of the same dashboard
Conflicting KPI definitions across departments
Manual offline edits that break consistency
Reconciliation effort between BI outputs and finance spreadsheets
Limited visibility into which output is final
These issues are especially common near month-end, quarter-end, and board reporting deadlines.
Turning insights into board-ready outputs
A dashboard may reveal a margin problem or expense spike. But someone still needs to:
Validate the underlying data
Write commentary
Prepare the executive summary
Build supporting schedules
Export a presentable document
Route it for review
That conversion from insight to formal reporting often becomes manual if the reporting platform is not designed for finance workflows.
For finance, governance is not an optional add-on. It is part of report quality.
Ease of use for non-technical teams
A platform can be powerful and still be a poor fit if finance cannot own basic changes. Finance teams often need to update layouts, filters, narratives, and recurring reports without opening a long IT ticket queue.
Compare total cost of ownership, deployment speed, and scalability
Finance buyers should also evaluate the broader operating model:
How long does implementation take?
How much technical dependency is involved?
What is required to maintain reports over time?
Can the system scale across more entities, departments, and reporting cycles?
Will the team need multiple tools just to finish the reporting process?
A cheaper dashboard layer can become expensive if finance still spends hours finishing reports manually every cycle.
Questions to ask vendors before choosing a platform
Before selecting a platform, finance leaders should ask direct, workflow-oriented questions.
Financial statements, multi-entity reporting, and close-cycle support
Can the tool handle statement-style reporting layouts?
How does it support multi-entity reporting and consolidated outputs?
Can finance create recurring close-cycle packs without rebuilding them monthly?
How are drill-down and summary-to-detail navigation handled?
Spreadsheet connectivity and customization options
Does the platform support spreadsheet-style workflows where needed?
How easily can templates be customized for board, management, and department reporting?
What export formats are supported?
Can users preserve formatting for print and executive presentation use?
Permissions, approvals, and change tracking
How are permissions managed by role, entity, or department?
Is there support for approvals, commentary, or review workflows?
Can the team trace report changes over time?
How does the platform help maintain one trusted reporting version?
This hybrid model works well when finance wants analytical flexibility without sacrificing reporting control.
Mapping by company size and reporting maturity
A simple way to think about fit:
Small, less complex organizations: BI may cover most needs if formal reporting requirements are still light.
Mid-sized organizations with growing stakeholder demands: A hybrid model often works best.
Large or multi-entity organizations: Dedicated finance reporting capabilities usually become more important.
Replacing manual spreadsheet reporting
If your current process depends on copying figures into spreadsheets, emailing versions back and forth, and rebuilding packs every month, that is a strong sign the reporting stack needs to mature.
The goal is not to eliminate spreadsheets entirely. It is to reduce spreadsheet dependency for core recurring reporting.
Shortlist criteria for 2026 tool comparisons
As you build a shortlist, focus on capabilities that matter to finance in real life, not just demo visuals.
What to look for in modern platforms
Standardized finance-ready report design
Strong automation for recurring cycles
Drill-down from KPI summary to detailed report
Export flexibility for PDF, Excel, and presentation use
Governance, permissions, and traceability
Support for multi-entity and stakeholder-specific reporting
Reasonable ownership by finance, not only IT
How to compare vendors without getting distracted
Vendor roundups often overemphasize dashboard appearance. Finance buyers should push deeper:
Can the platform support close-cycle reporting?
Does it reduce manual reconciliation?
Can outputs be trusted and repeated every period?
Is it practical for finance users to operate?
Does it support both analysis and reporting delivery?
Practical recommendations for finance teams
If you are evaluating financial report analysis software, these steps can help you make a better decision.
Map your real reporting process first. Document how reports move from data extraction to review, commentary, approval, and distribution.
Separate dashboard needs from reporting needs. Do not assume one visual analytics tool will automatically handle board packs and controlled finance outputs.
Test with an actual monthly reporting pack. Vendor demos should include your real reporting use case, not only KPI cards and drill charts.
Evaluate ownership carefully. Choose tools that let finance maintain recurring reports without excessive technical dependency.
Prioritize trust over polish. Consistency, governance, and traceability matter more than attractive visuals when numbers are used for executive and financial decisions.
Finance teams should choose tools based on reporting control, analytical depth, and workflow fit, not dashboard polish alone.
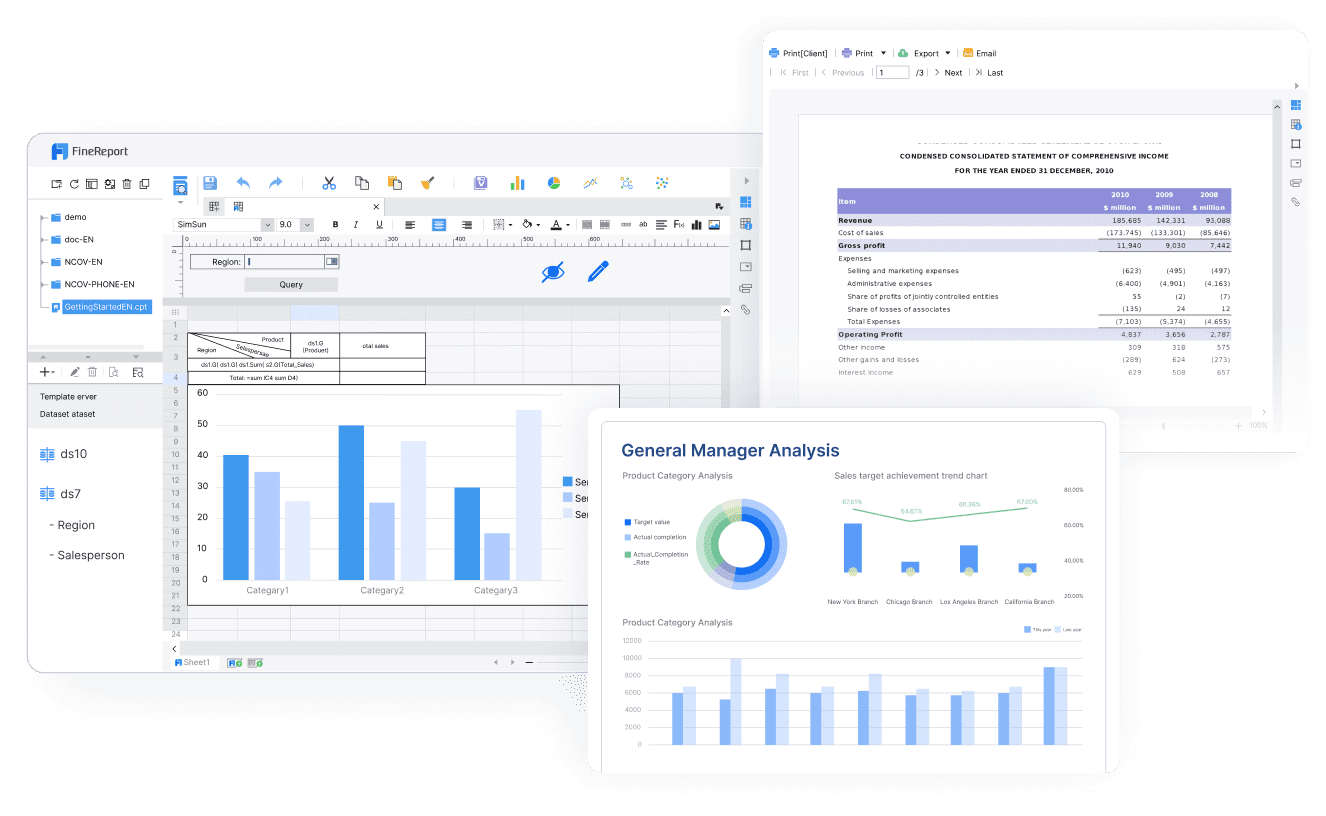
Tools like Tableau, Power BI, and similar BI platforms are widely used for visualization and broad analytics. They can be very effective for KPI monitoring, ad hoc exploration, and executive dashboards. But teams with complex reporting workflows may also need a dedicated enterprise reporting platform like FineReport.
FineReport is especially relevant when finance needs more than dashboarding, such as:
Pixel-perfect report design for finance-ready layouts
Paginated and printable reports for formal reporting packs
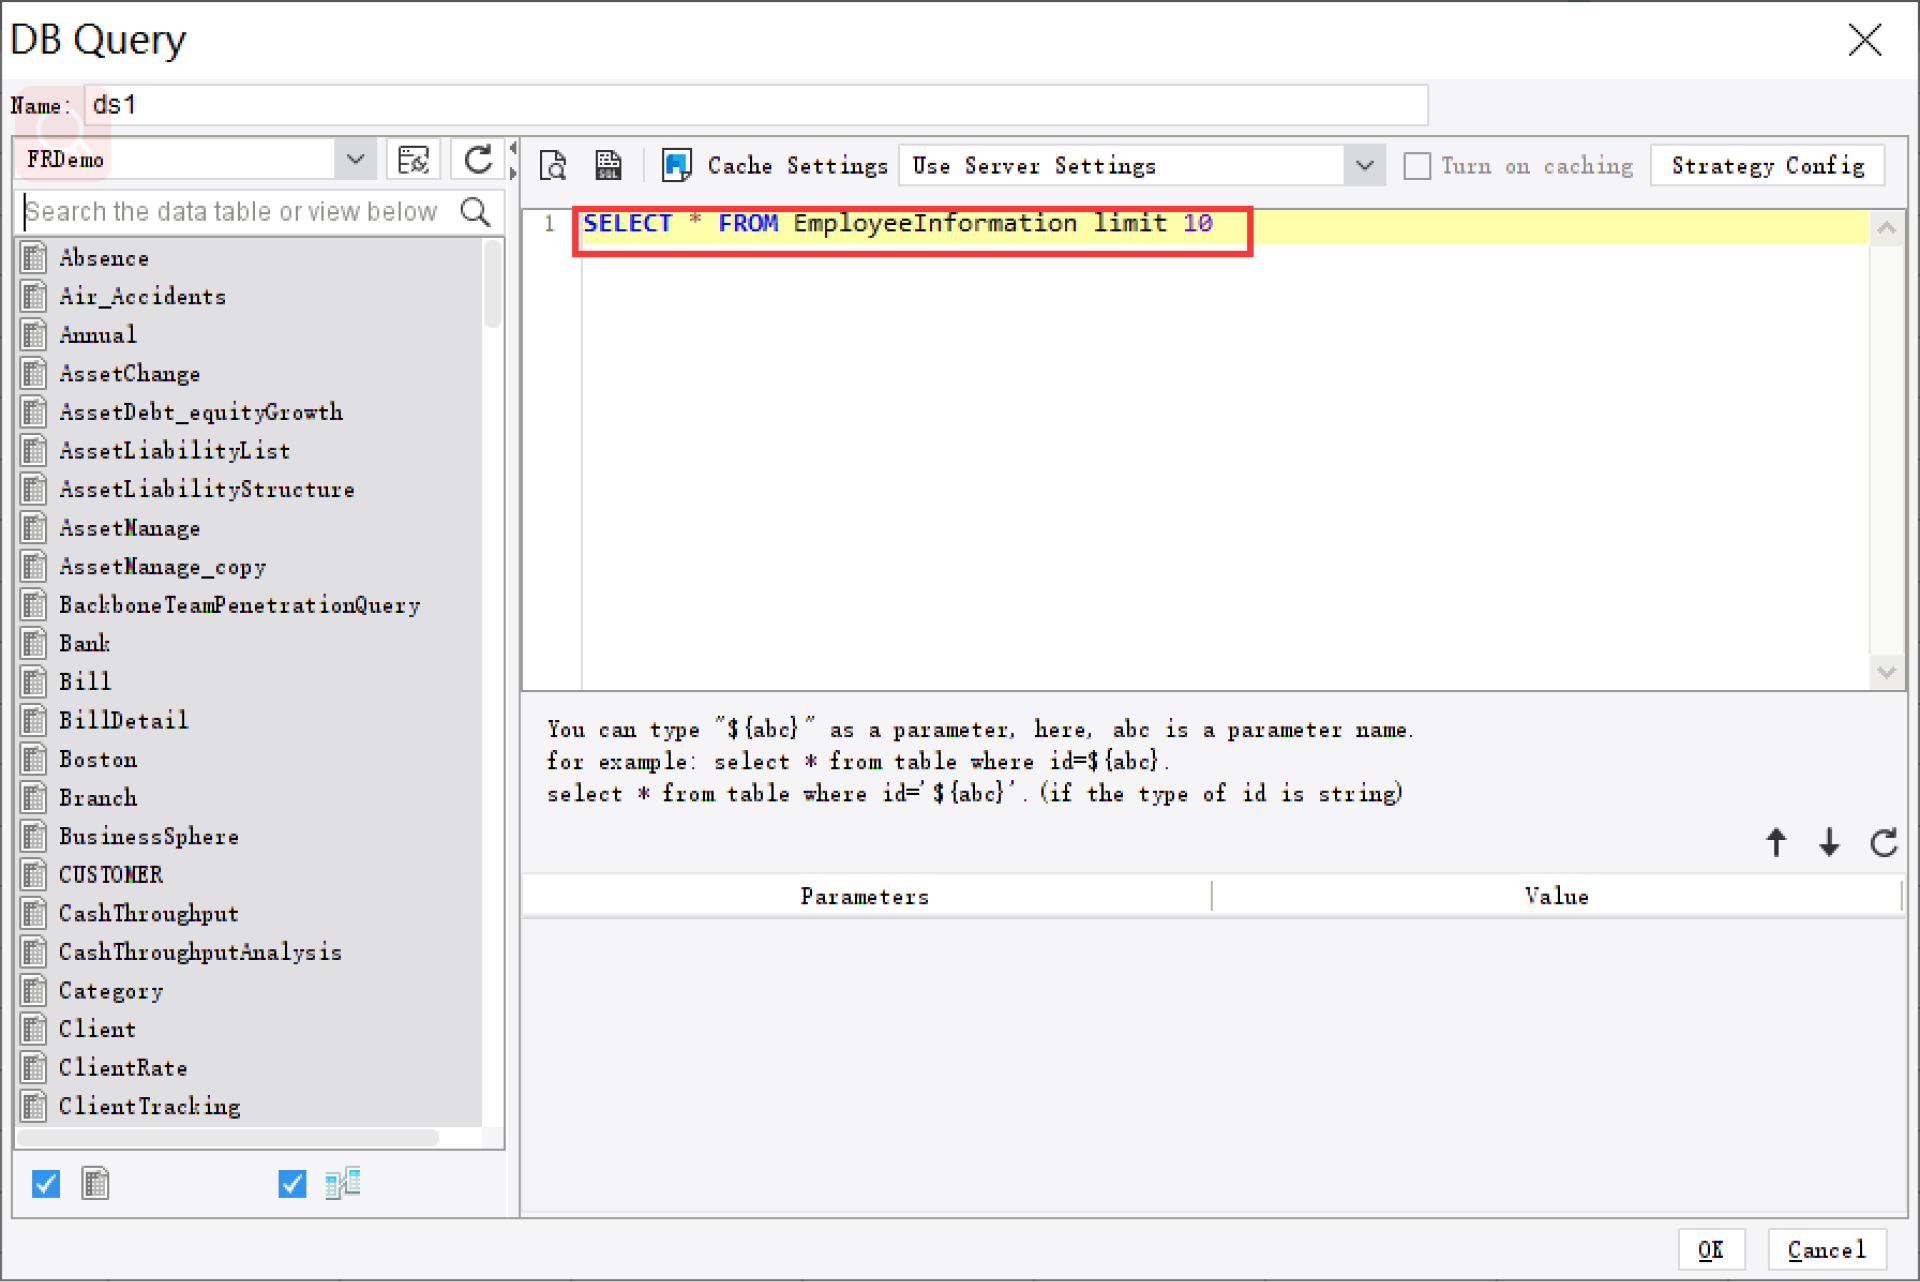
Parameter queries for period, entity, department, or scenario filtering
Operational finance reporting that combines KPIs and detailed tabular views
FineReport is not a replacement for every BI use case. It is a practical option for organizations that need stronger reporting structure alongside analytics.
Get Ready-to-Use Dashboard and Report Templates in Fine Gallery
Ultimately, the right solution should help finance teams move faster while improving accuracy and trust in the numbers. If your team is outgrowing dashboard-only reporting or spending too much time converting analysis into formal outputs, it may be time to evaluate a more complete finance reporting approach.
Financial report analysis software is built for structured, repeatable finance outputs like monthly packs, variance reports, and board-ready statements. BI tools are better for interactive exploration, dashboards, and ad hoc analysis.
In most cases, no. Dashboards are useful for KPI visibility, but finance teams also need controlled formatting, scheduled distribution, approvals, and audit-ready reporting that dashboards alone often do not provide.
Key features include data integration, period comparisons, automation, governance, traceability, and finance-ready exports. Collaboration tools for review and approval are also important during close and executive reporting cycles.
They need reporting that supports close, reconciliation, signoff, and formal stakeholder communication. That usually means printable statements, variance commentary, and trusted outputs that can be reviewed and archived.
It reduces manual spreadsheet work by pulling data from source systems into governed templates and automated workflows. Audit trails, permissions, and version control help teams explain changes and trust the final numbers.
Product Trial
FineReport
Pixel-perfect reports · Interactive dashboards · Easy data entry · Digital twins