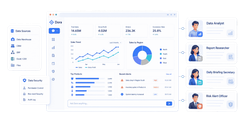
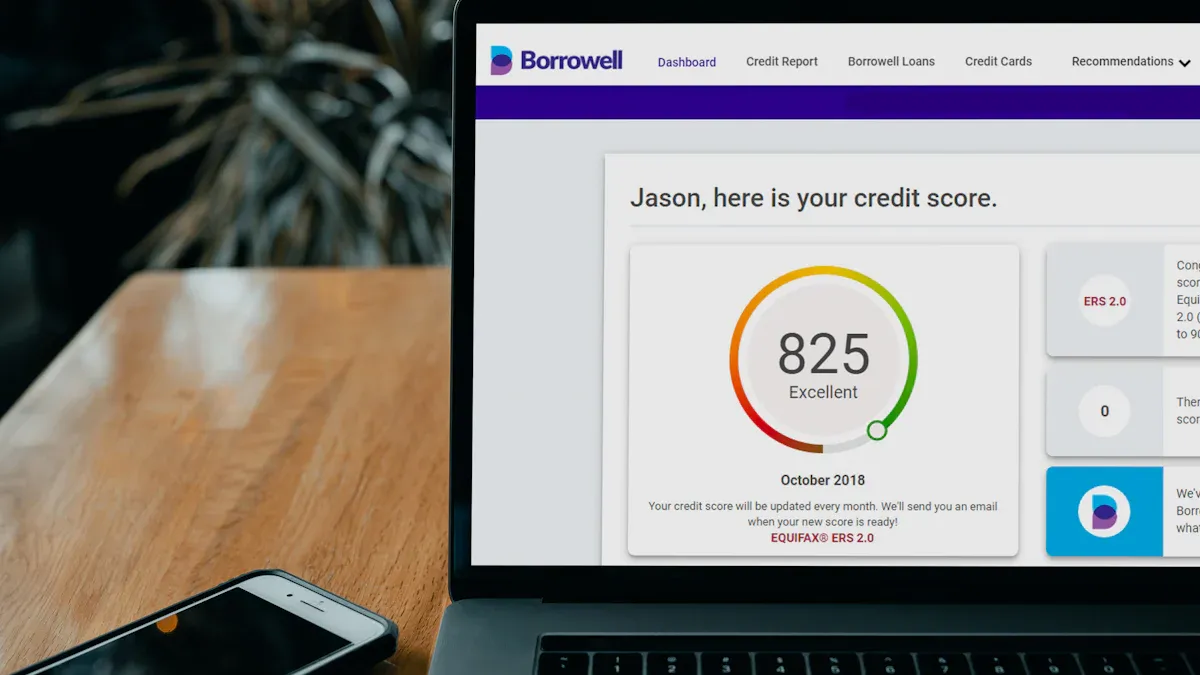
Analytics reporting software helps teams pull data from multiple sources, automate recurring reports, and turn metrics into decision-ready outputs such as dashboards, scheduled reports, and executive summaries.
12 analytics reporting software tools compared at a glance
If you want the short version first, here is the fastest way to compare the leading analytics reporting software options for 2026.
| Tool | Best Fit | Core Strengths | Main Limitations | Pricing Approach | Deployment |
|---|---|---|---|---|---|
| FineReport | Enterprises and mid-market teams needing flexible, pixel-perfect reporting | Strong reporting designer, scheduled distribution, data integration, enterprise controls | Less lightweight than pure self-service tools | Custom quote | Cloud / on-premises |
| Power BI | Microsoft-centric organizations | Low entry price, strong Microsoft integration, good self-service analytics | Governance can get complex at scale; presentation delivery is still limited | Per-user + premium capacity | Cloud / on-premises |
| Tableau | Teams prioritizing visual exploration | Best-in-class visual analysis, broad ecosystem, strong enterprise adoption | Higher cost; report automation beyond dashboards can require extra tooling | Per-user subscription | Cloud / on-premises |
| Looker | Governed metrics in modern data stacks | Semantic layer, strong governance, centralized metric logic | Can require technical setup; higher implementation effort | Custom quote | Cloud |
| Qlik Sense | Teams needing associative analysis and governed self-service | Flexible exploration, strong data engine, enterprise controls | UI and adoption can vary by team maturity | Custom quote | Cloud / on-premises |
| Domo | Organizations wanting an all-in-one analytics platform | Broad connector library, built-in apps, strong operational use cases | Total cost can rise quickly | Custom quote | Cloud |
| Sigma | Warehouse-first teams | Spreadsheet-style interface on top of cloud data warehouses | Best value depends on warehouse maturity | Usage / subscription mix | Cloud |
| Metabase | Lean teams and internal reporting | Simple setup, approachable UI, open-source option | Limited enterprise-grade governance compared with larger platforms | Free + paid tiers | Cloud / self-hosted |
| Looker Studio | Google-centric small teams and marketers | Low cost, easy sharing, fast marketing reporting | Limited governance and enterprise reporting depth | Free + enterprise add-ons via ecosystem | Cloud |
| Zoho Analytics | SMBs needing affordable cross-source reporting | Broad business app integrations, decent automation, approachable pricing | Less robust for advanced enterprise governance | Tiered subscription | Cloud / on-premises |
| Klipfolio | KPI tracking and executive dashboards | Fast metric boards, lightweight setup, strong KPI monitoring | Less depth for complex governed analytics | Tiered subscription | Cloud |
| Google Analytics 4 | Website and product analytics reporting | Native digital analytics, event-based reporting, Google ecosystem fit | Not a full cross-functional BI platform on its own | Free + enterprise 360 tier | Cloud |
Best choices by business type
- Best for startups: Metabase, Looker Studio, Zoho Analytics
- Best for mid-market teams: FineReport, Power BI, Tableau, Sigma
- Best for enterprises: FineReport, Looker, Qlik Sense, Domo, Tableau
- Best for regulated environments: FineReport, Looker, Qlik Sense, Power BI
Strongest tools by reporting need
- Best for automated reporting: FineReport, Power BI, Zoho Analytics, Domo
- Best for executive dashboards: Tableau, Klipfolio, Power BI
- Best for self-service analytics: Power BI, Tableau, Sigma, Qlik Sense
- Best for governed decision-making: FineReport, Looker, Qlik Sense, Power BI
Why analytics reporting software matters in 2026
Analytics reporting software matters because most organizations no longer struggle to collect data; they struggle to standardize it, distribute it, and turn it into consistent reporting that leaders actually use.
These platforms sit between raw data and business decisions. They connect to source systems, model or organize data, visualize metrics, and automate how reports are refreshed and delivered. That sounds similar to dashboards, BI suites, and embedded analytics tools, but there are important differences:
- Analytics reporting software focuses on recurring analysis, scheduled delivery, multi-source reporting, and decision-ready outputs.
- Dashboards are often just one interface for monitoring KPIs and may not solve report scheduling, governance, or formatted output.
- BI suites are broader ecosystems that include modeling, governance, exploration, and sometimes reporting, but not every BI tool is equally strong in production-grade reporting.
- Embedded analytics tools are designed to place charts and insights inside customer-facing apps or software products rather than internal team reporting workflows.
In 2026, buyers usually evaluate analytics reporting software against six practical criteria:
- Automation: Can it refresh data, distribute reports, and reduce manual spreadsheet work?
- Data connectors: Does it connect deeply to warehouses, databases, CRMs, ad platforms, spreadsheets, and business apps?
- Governance: Can teams control definitions, permissions, auditability, and access across departments?
- Visualization flexibility: Can users build both executive summaries and detailed operational reports?
- AI assistance: Does the platform help summarize insights, surface anomalies, or speed report creation?
- Total cost: Does pricing stay reasonable as users, data volume, and reporting frequency grow?
This comparison is for:
- BI teams that need governed reporting and automated delivery
- Operations leaders who need recurring performance visibility
- Marketing analysts combining ad, web, and CRM metrics
- Finance teams producing standardized management reporting
- Growing businesses moving beyond spreadsheets and static exports
How we reviewed the best analytics reporting software tools for 2026
Evaluation criteria
To compare the best analytics reporting software fairly, we looked at the capabilities that matter most once teams move past basic dashboarding.
1. Ease of setup
We considered how quickly a team can connect data, build initial reports, and start distributing outputs without a long technical project.
2. Learning curve
Some tools are built for analysts, while others are accessible to business users. We assessed how much training is typically needed for authors and report consumers.
3. Reporting automation
We evaluated scheduled refreshes, subscriptions, exports, alerts, burst distribution, parameterized reporting, and repeatable workflow automation.
4. Customization
We compared layout control, formatting flexibility, interactivity, drill-down support, and the ability to tailor reports by team or stakeholder.
5. Collaboration
We reviewed sharing options, commenting, workspace organization, role-based access, and how well reports support cross-functional alignment.
6. Governance controls
We looked at permissioning, semantic consistency, centralized metric logic, auditing, and enterprise security readiness.
7. Scalability
We considered how well each platform performs as data sources, user counts, and reporting demands increase.
8. Integration depth
We examined support for:
- Cloud data warehouses
- Databases
- CRMs
- Advertising platforms
- Spreadsheets
- ERP and finance systems
- APIs and custom integrations
Testing methodology and assumptions
Our comparisons are based on common real-world reporting workflows rather than vendor feature grids alone.
We used representative scenarios such as:
- Building an executive KPI report from multiple systems
- Automating weekly operations reporting
- Combining CRM, ad, and web analytics into one reporting layer
- Creating finance or management reports with stricter formatting requirements
- Supporting a mix of analyst authors and business consumers
- Evaluating governance for teams with shared metrics across departments
Where available, rankings were influenced by a mix of:
- Hands-on product familiarity
- Publicly visible product capabilities
- Common user-reported strengths and friction points
- Vendor positioning and packaging assumptions for 2026
Because reporting needs differ widely, there is no single best analytics reporting software for every company. The right choice depends on your team size, existing stack, governance needs, and how formal your reporting outputs must be.
Detailed comparison of the 12 analytics reporting software tools
Best picks for BI teams that need automated reporting
For BI teams, the top priority is usually reducing repetitive reporting work without losing control over metrics. The strongest options here are:
- FineReport for structured, enterprise-grade automated reporting and formatted outputs
- Power BI for Microsoft-aligned reporting automation and broad accessibility
- Domo for operational reporting workflows across many business functions
- Zoho Analytics for budget-conscious teams that still want scheduled, cross-source reporting
If your biggest pain point is analysts manually rebuilding the same weekly or monthly reports, these tools will generally deliver more value than dashboard-only solutions.
Best options by team size, stack, and reporting needs
For lean teams
- Metabase
- Looker Studio
- Zoho Analytics
These tools are easier to deploy and typically require less technical overhead.
For modern data stacks
- Looker
- Sigma
- Tableau
- FineReport
These fit well when your reporting layer depends on a warehouse, modeled data, and stronger data discipline.
For mixed-source reporting
- FineReport
- Power BI
- Domo
- Zoho Analytics
These are strong when teams need to combine databases, spreadsheets, business apps, and operational systems.
For enterprise governance
- FineReport
- Looker
- Qlik Sense
- Power BI
These tools are the strongest fit when consistency, permissions, auditability, and centralized control matter more than lightweight setup.
Pros, cons, and standout features of each tool
1. FineReport
 Website: https://www.fanruan.com/en/finereport
Overview: FineReport is enterprise-focused analytics reporting software designed for highly formatted reports, automated distribution, and governed reporting across complex business environments.
- Key Features
- Pixel-perfect report designer
- Scheduled report generation and distribution
- Broad data source connectivity
- Dashboard and parameterized reporting
- Role-based access control
- Support for enterprise deployment needs
- Cloud and on-premises deployment options
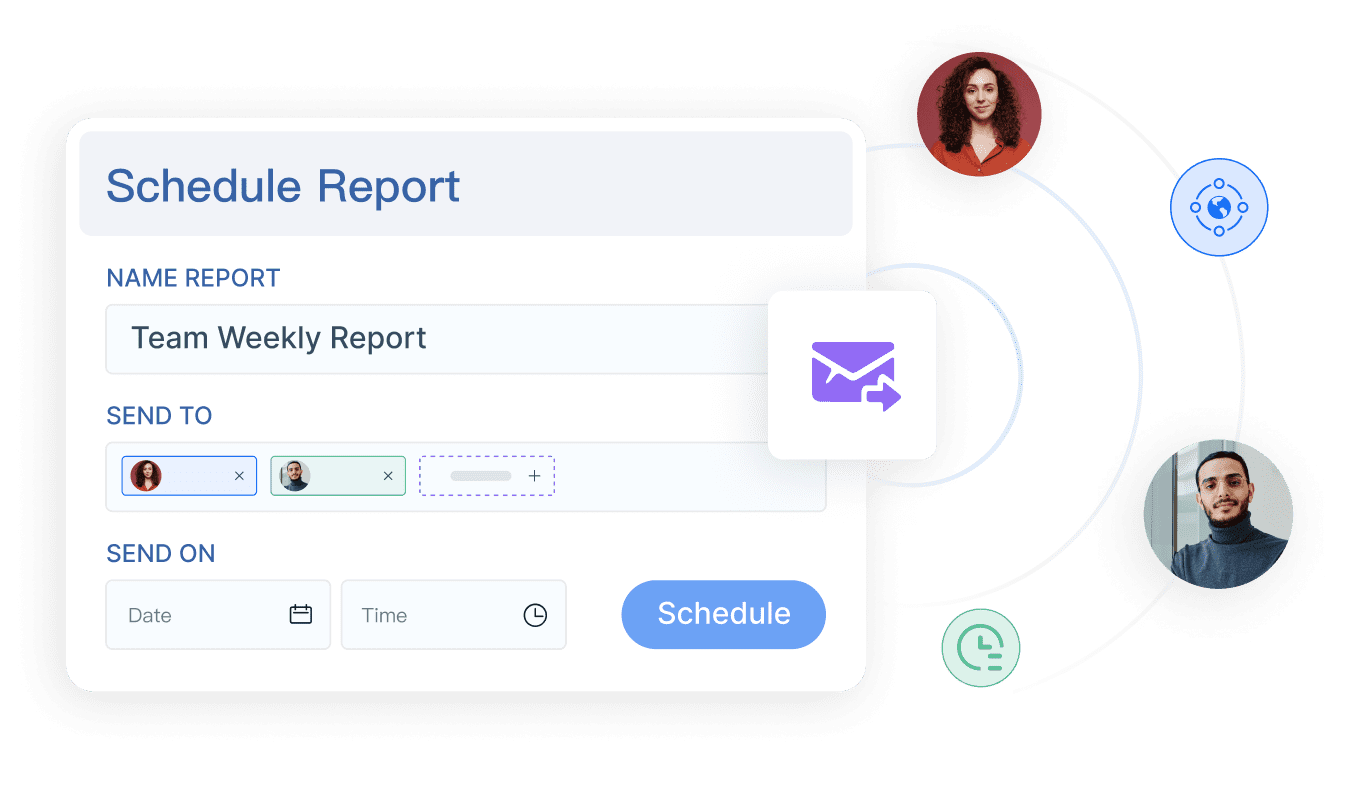 FineReport's Scheduled Generation
-
Pros
- Excellent fit for organizations that need structured, production-grade reporting
- Strong formatting flexibility for management, operational, and financial reports
- Good balance of reporting automation and governance
- Well suited to enterprises with mixed data environments
-
Cons
- Less lightweight than simpler self-service tools
- Can require more implementation planning than SMB-first platforms
- Best value is typically realized in larger or more formal reporting environments
-
Best For
- Enterprises, regulated teams, finance-heavy reporting, and organizations that need flexible yet governed reporting at scale
FineReport deserves the top spot because it addresses a gap many analytics teams still face: dashboards are easy to build, but repeatable, formatted, business-ready reporting is harder. For organizations that need more than ad hoc visual exploration, FineReport offers a stronger reporting-first foundation than many dashboard-centric alternatives.
2. Power BI
 Website: https://www.microsoft.com/en-us/power-platform/products/power-bi
Overview: Power BI is a widely adopted analytics reporting software platform that combines self-service dashboards, semantic modeling, and accessible reporting inside the Microsoft ecosystem.
-
Key Features
- Interactive dashboards and reports
- Microsoft 365, Excel, Teams, and Azure integration
- Data modeling with Power Query and DAX
- Scheduled refresh and subscriptions
- AI-assisted insights and Copilot capabilities
- Strong sharing and collaboration options
-
Pros
- Attractive entry pricing
- Strong fit for Microsoft-first organizations
- Large talent pool and partner ecosystem
- Good mix of self-service and enterprise control
-
Cons
- Governance can become fragmented without strong administration
- Premium features may be needed as usage scales
- Report delivery beyond dashboards and static exports can be limiting
-
Best For
- Mid-market and enterprise organizations already invested in Microsoft technologies
3. Tableau
 Website: https://www.tableau.com/
Overview: Tableau is a leading analytics reporting software option for teams that prioritize visual analysis, exploratory dashboards, and high-quality data storytelling.
-
Key Features
- Advanced visualization capabilities
- Interactive dashboards
- Broad data connectivity
- Strong calculated field and analysis options
- Enterprise sharing and governance support
- Tableau Cloud and Server deployment models
-
Pros
- Excellent visual exploration experience
- Strong community and training ecosystem
- Proven enterprise adoption
- Flexible for analyst-led reporting environments
-
Cons
- Cost can be high as teams scale
- Report automation is less compelling than visualization strength
- Business-user self-service varies depending on implementation quality
-
Best For
- BI teams and enterprises that need rich interactive analysis and polished dashboards
4. Looker
 Website: https://cloud.google.com/looker
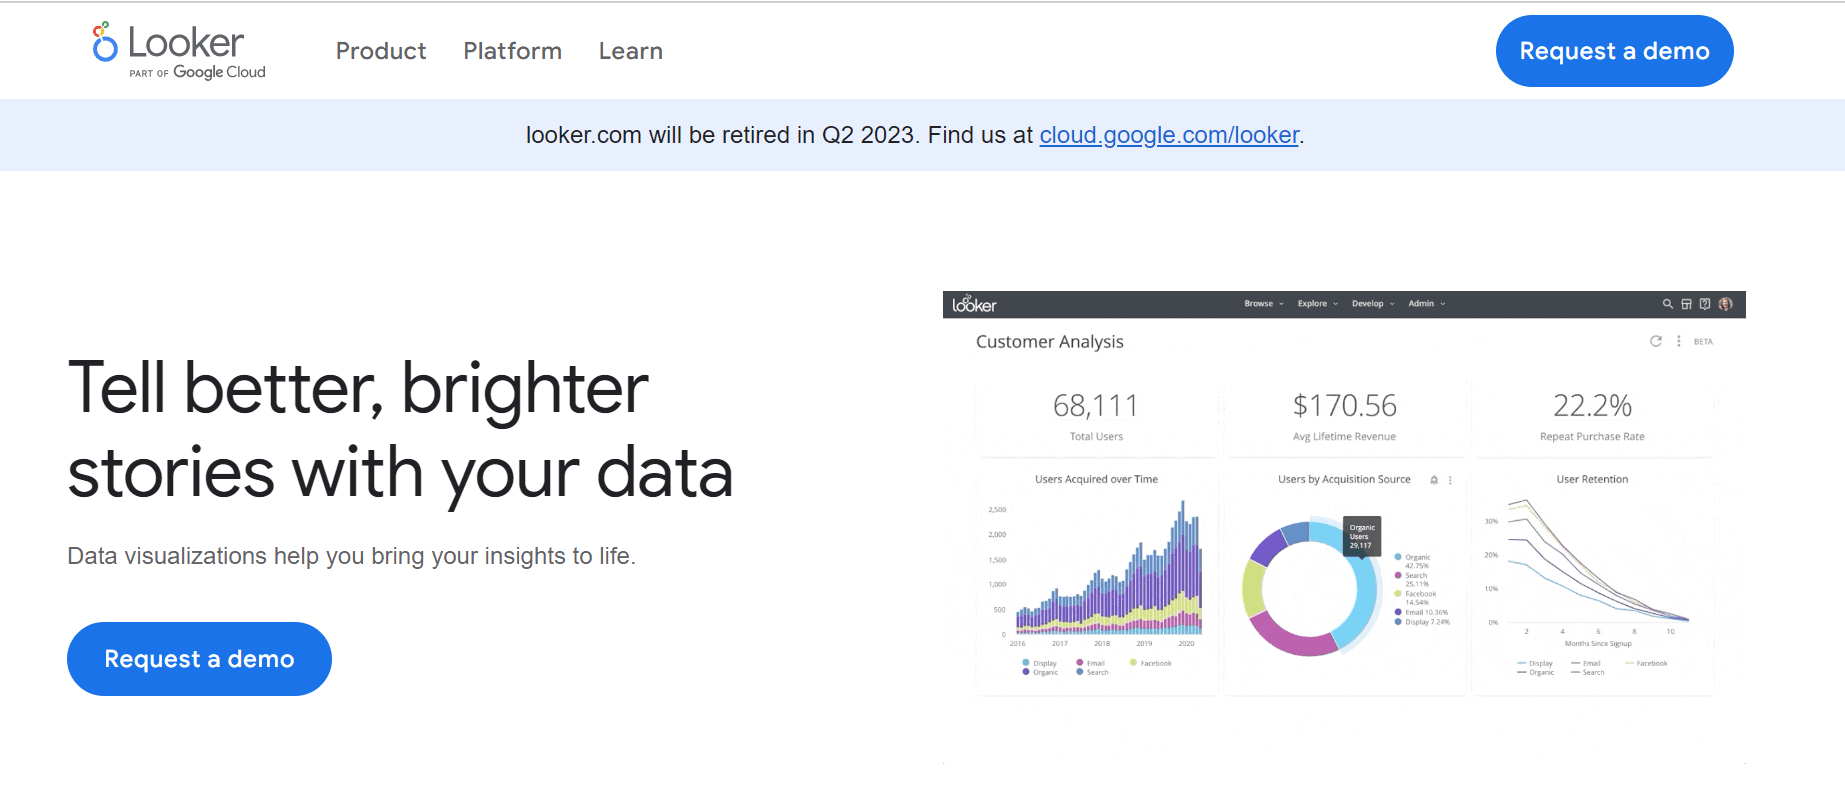
Overview: Looker is a governed analytics reporting software platform built around a centralized semantic model for consistent metrics across the organization.
-
Key Features
- Semantic modeling layer
- Governed self-service analytics
- Strong cloud data warehouse alignment
- Embedded analytics capabilities
- Scheduled delivery and alerting
- Centralized metric definitions
-
Pros
- Very strong governance for shared metrics
- Good fit for modern, warehouse-centric stacks
- Reduces metric inconsistency across teams
- Effective for data-mature organizations
-
Cons
- Higher implementation effort than lighter tools
- Can depend on technical resources for initial success
- Less ideal for teams wanting instant, low-code reporting
-
Best For
- Enterprises and data teams that prioritize metric consistency and warehouse-native governance
5. Qlik Sense
 Website: https://www.qlik.com/us/products/qlik-sense
Overview: Qlik Sense is analytics reporting software known for its associative engine, enabling users to explore relationships across data without rigid query paths.
-
Key Features
- Associative data model
- Interactive dashboards and reporting
- AI-assisted insight suggestions
- Strong security and governance controls
- On-premises and cloud deployment
- Enterprise scalability
-
Pros
- Powerful exploratory analysis
- Strong enterprise governance capabilities
- Suitable for complex data relationships
- Good flexibility across deployment models
-
Cons
- User experience may feel less intuitive for casual users
- Adoption depends heavily on implementation quality
- Can require specialized expertise
-
Best For
- Enterprises needing deeper exploratory analysis with strong controls
6. Domo
 Website: https://www.domo.com/
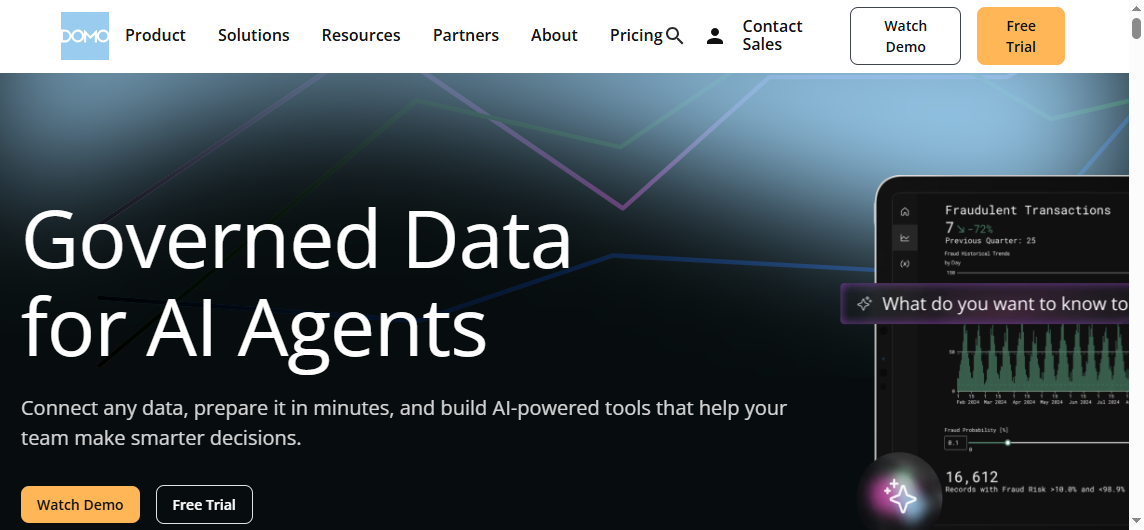
Overview: Domo is a cloud-based analytics reporting software platform that combines data integration, dashboards, alerts, and operational workflows in one environment.
-
Key Features
- Large connector ecosystem
- Cloud-native dashboards and reporting
- Alerts and automation
- App-building and workflow support
- Collaboration features
- Broad departmental use case coverage
-
Pros
- Strong for operational analytics
- Broad out-of-the-box integration coverage
- Useful for organizations that want one vendor for multiple analytics needs
- Business-friendly interface in many scenarios
-
Cons
- Pricing can be difficult to forecast
- May overlap with existing stack components
- Less appealing if you already have a mature warehouse and BI setup
-
Best For
- Companies wanting an all-in-one analytics and reporting environment
7. Sigma
 Website: https://www.sigmacomputing.com/
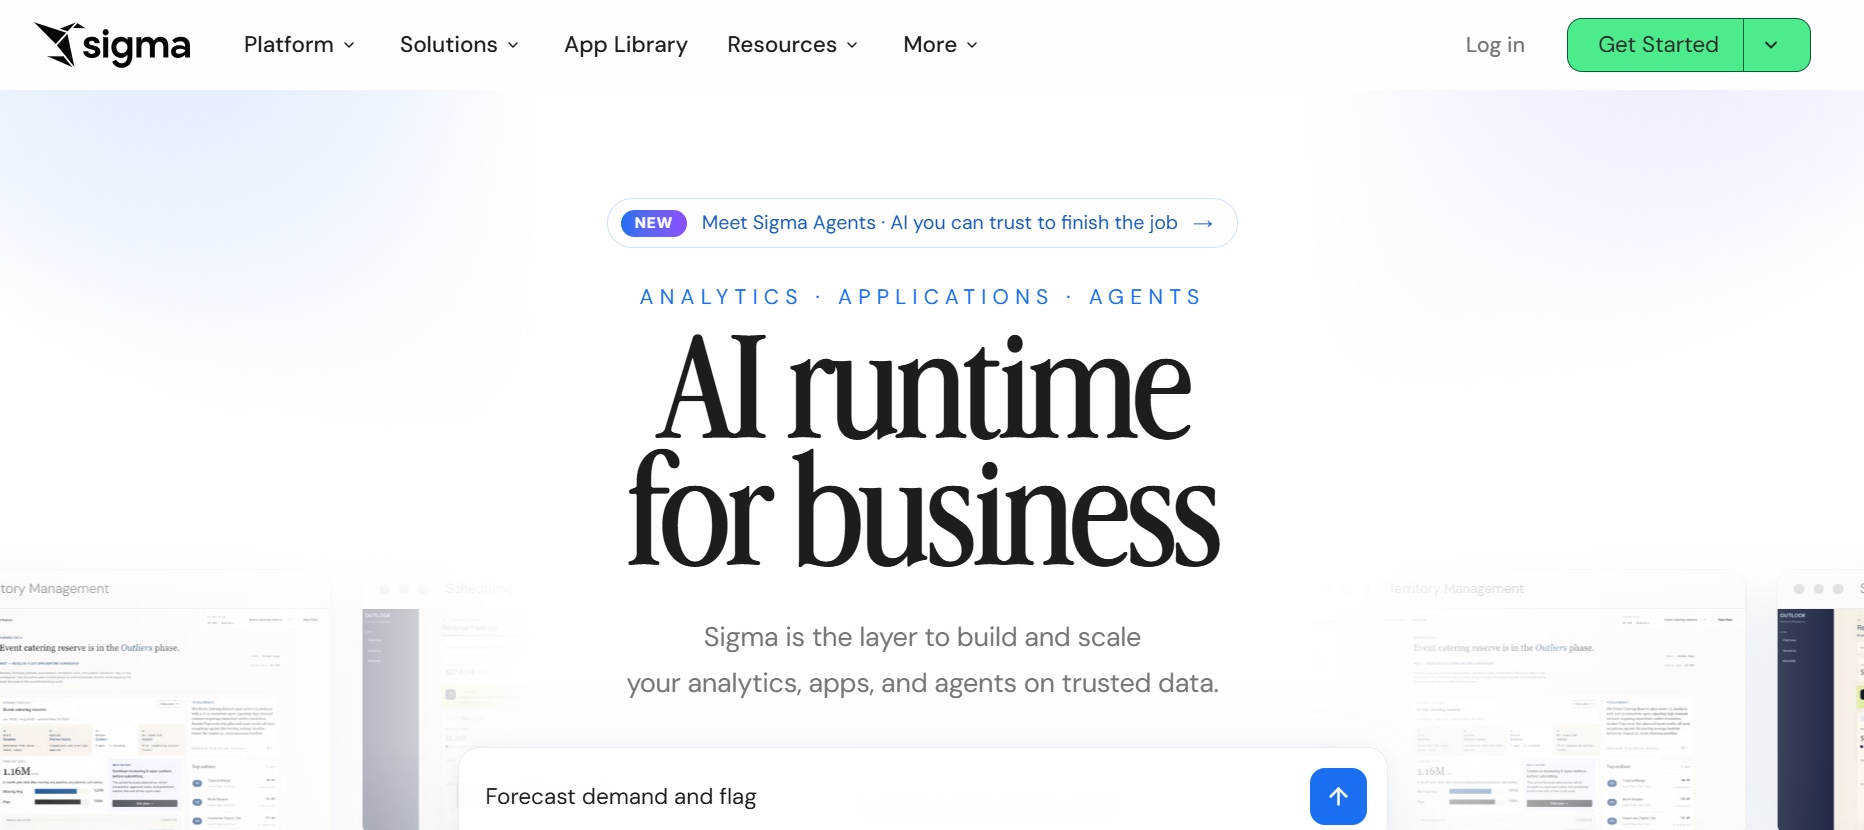
Overview: Sigma is warehouse-native analytics reporting software that gives business users a spreadsheet-like interface for exploring and reporting on governed cloud data.
-
Key Features
- Live querying on cloud warehouses
- Spreadsheet-style analysis experience
- Collaboration and workbook sharing
- Governed reporting on centralized data
- Interactive dashboards and reports
- Strong fit for modern data stacks
-
Pros
- Familiar interface for spreadsheet-heavy users
- Good for bridging analyst and business workflows
- Strong warehouse alignment
- Reduces extract-heavy reporting patterns
-
Cons
- Best results depend on a healthy warehouse foundation
- Less ideal for teams without modern data infrastructure
- Reporting presentation flexibility can be narrower than report-first tools
-
Best For
- Warehouse-first companies that want business users working closer to live governed data
8. Metabase
 Website: https://www.metabase.com/
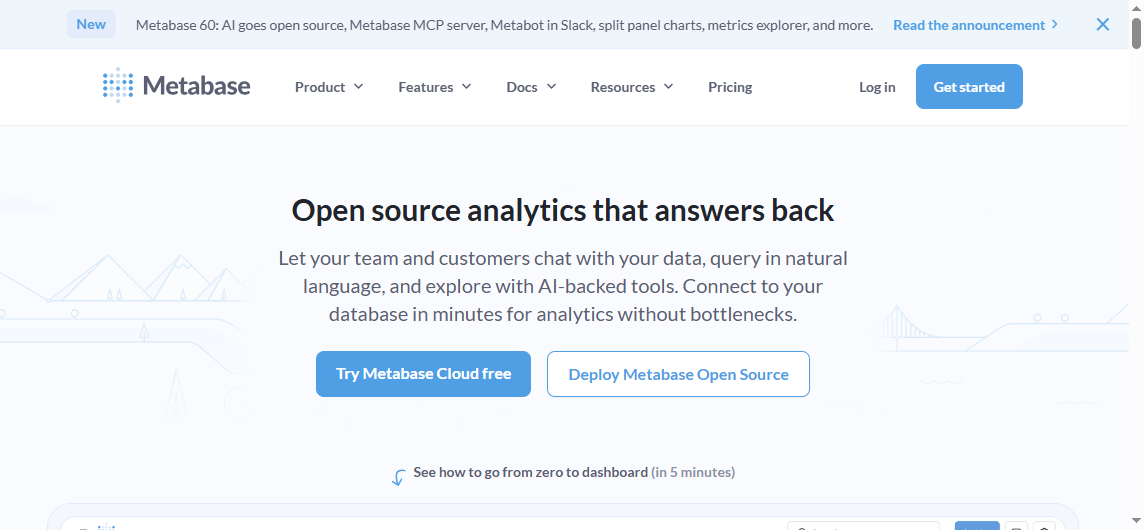
Overview: Metabase is simple, approachable analytics reporting software that helps small teams create dashboards, ask questions, and share internal reports quickly.
-
Key Features
- Easy dashboard creation
- Query builder for non-technical users
- SQL access for analysts
- Scheduled pulses and alerts
- Open-source availability
- Self-hosted and cloud options
-
Pros
- Fast to deploy
- Accessible for smaller teams
- Good value, especially for internal reporting
- Open-source option adds flexibility
-
Cons
- Governance depth is lighter than enterprise platforms
- Advanced enterprise workflows may require workarounds
- Visualization and formatting sophistication are more limited
-
Best For
- Startups, internal analytics teams, and cost-conscious organizations
9. Looker Studio
 Website: https://datastudio.google.com/navigation/reporting
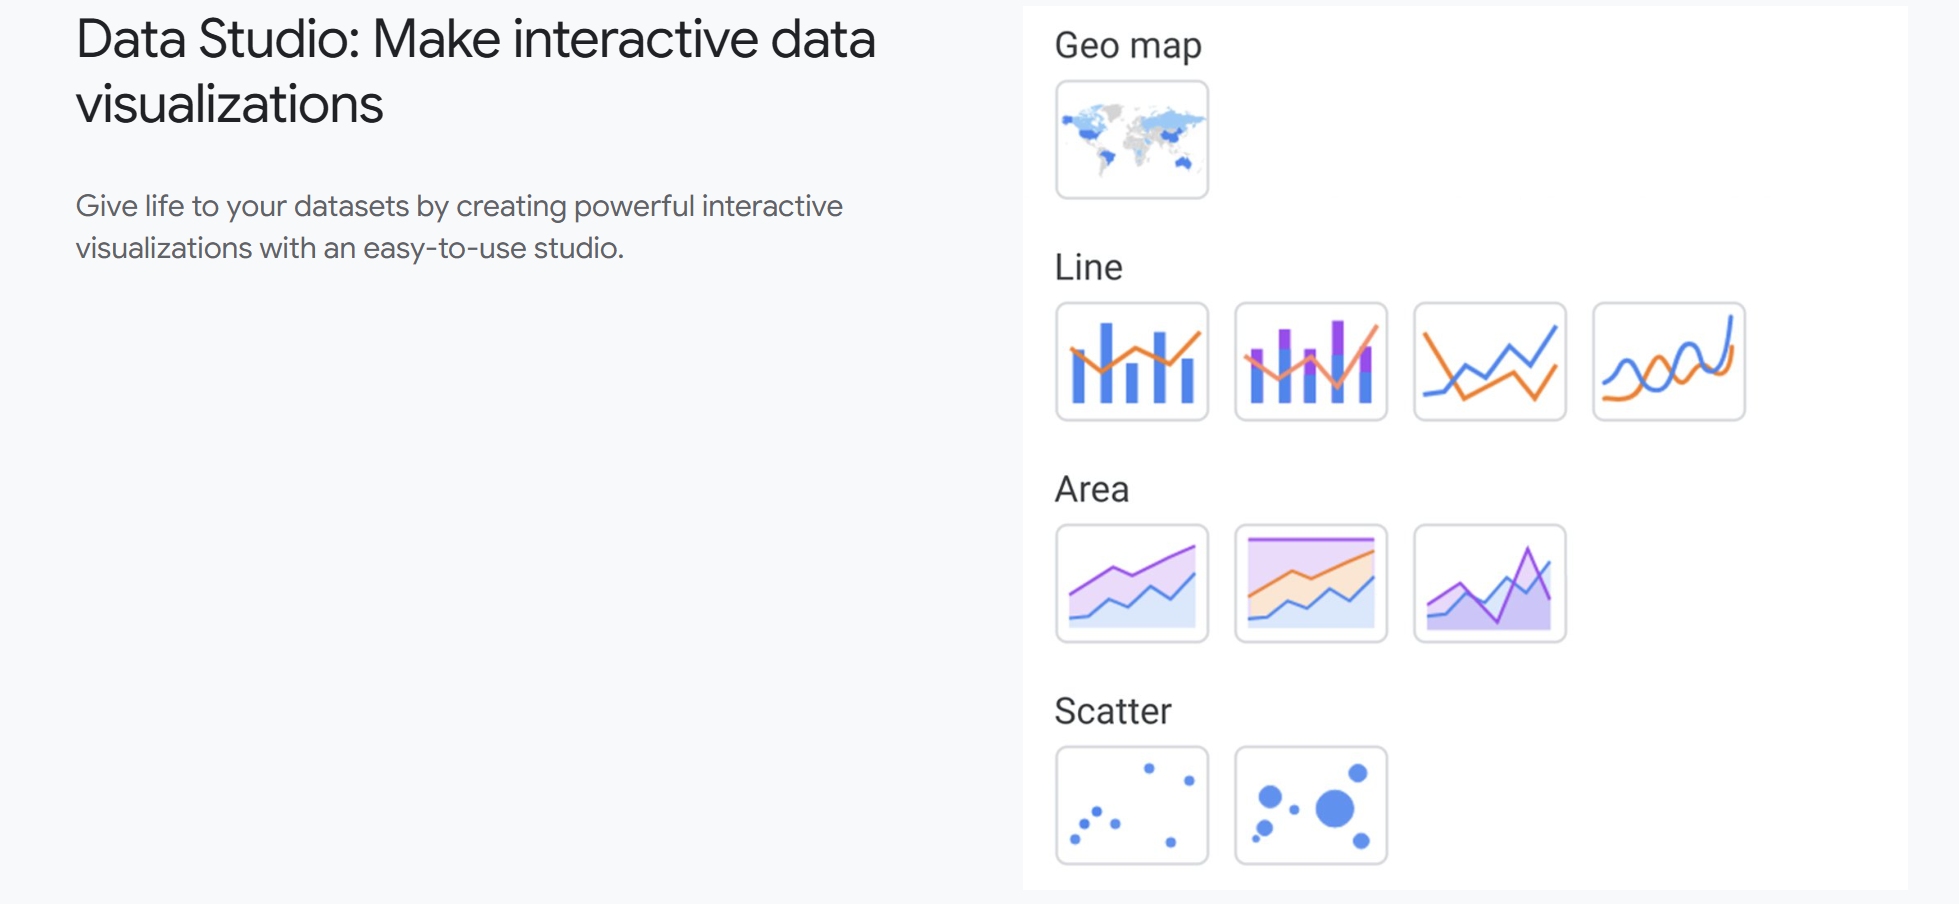
Overview: Looker Studio is lightweight analytics reporting software for building shareable dashboards and marketing reports, especially in the Google ecosystem.
-
Key Features
- Free dashboarding and reporting
- Native Google connector support
- Shareable cloud reports
- Basic report scheduling
- Customizable templates
- Broad use in marketing reporting
-
Pros
- Low cost of entry
- Easy to share with stakeholders
- Useful for quick campaign and web reporting
- Familiar for Google-centric teams
-
Cons
- Governance and enterprise controls are limited
- Performance can vary with more complex reporting
- Less suited to cross-functional enterprise reporting
-
Best For
- Marketers, agencies, and small teams using Google tools heavily
10. Zoho Analytics
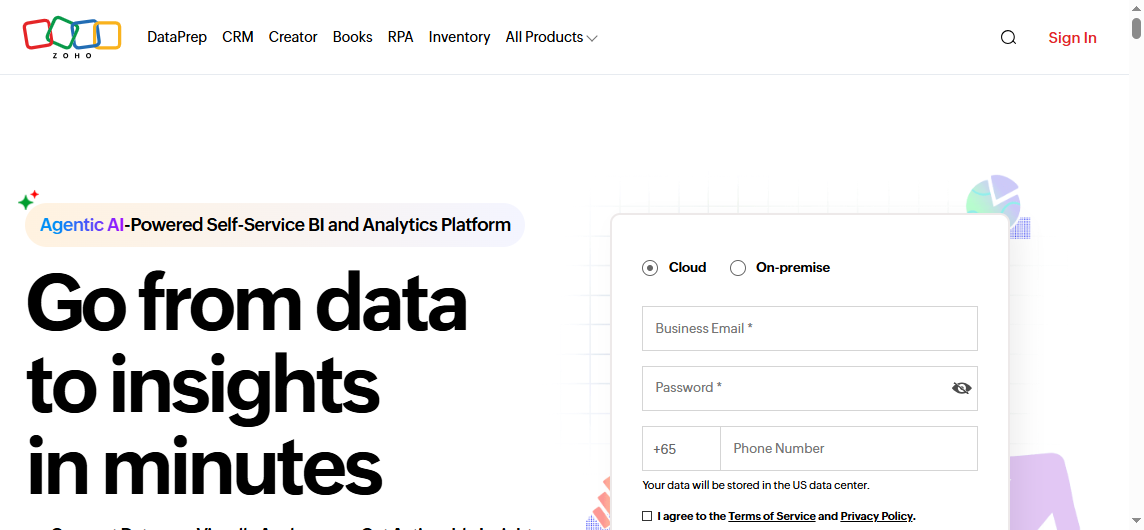 Website: https://www.zoho.com/
Overview: Zoho Analytics is affordable analytics reporting software that supports cross-source business reporting for SMBs and mid-sized companies.
-
Key Features
- Data blending across apps and files
- Automated report scheduling
- AI-assisted querying
- Dashboard and report builder
- Integration with Zoho apps and third-party tools
- Cloud and on-premises options
-
Pros
- Competitive pricing
- Broad business app connectivity
- Good feature depth for SMB budgets
- Useful balance of automation and usability
-
Cons
- Enterprise governance depth is more limited than top-tier platforms
- Advanced modeling use cases can be harder to scale
- Some larger organizations may outgrow it
-
Best For
- SMBs and mid-market businesses needing affordable cross-functional reporting
11. Klipfolio
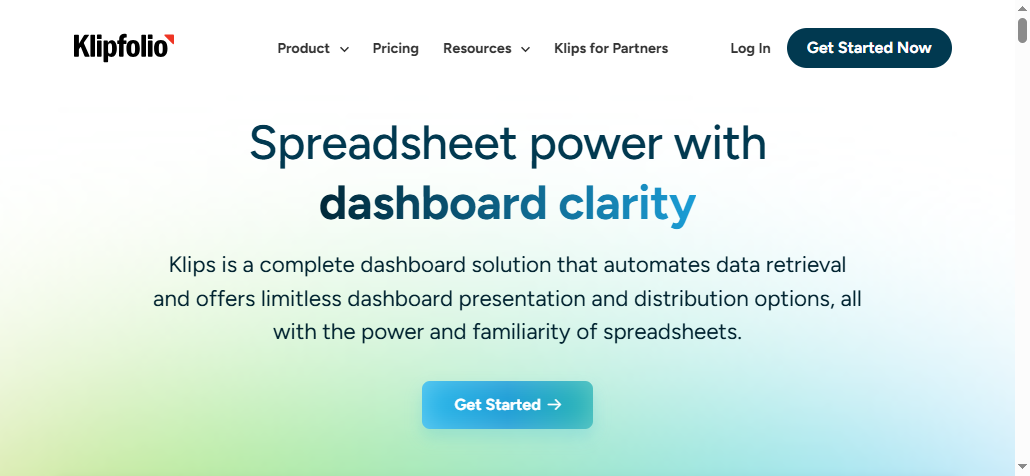 Website: https://www.klipfolio.com/
Overview: Klipfolio is KPI-focused analytics reporting software built for fast dashboard deployment and executive metric tracking.
-
Key Features
- KPI dashboards
- Prebuilt metrics and templates
- Cloud data integrations
- Lightweight automation
- Real-time monitoring
- Executive reporting support
-
Pros
- Fast setup for scorecards and KPI visibility
- Good for leaders who want simple status reporting
- Lighter operational footprint than larger BI suites
- Useful for always-on performance tracking
-
Cons
- Less depth for complex governed analytics
- Not ideal for highly formatted reporting needs
- Advanced customization can be narrower than larger tools
-
Best For
- Executives, small analytics teams, and KPI-centric reporting use cases
12. Google Analytics 4
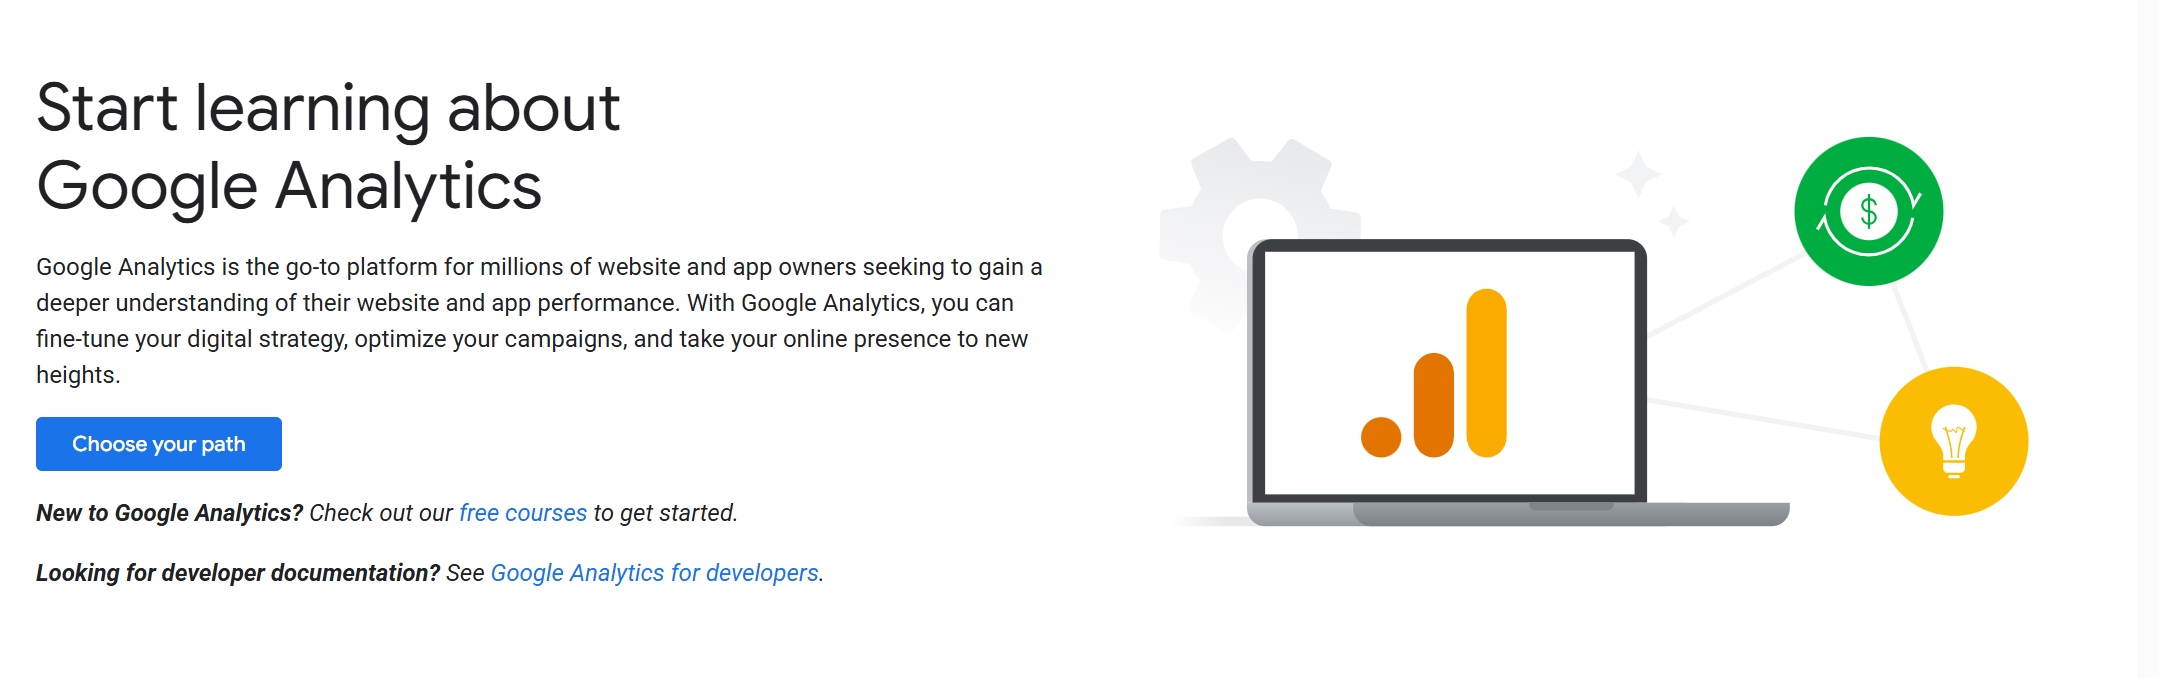 Website: https://analytics.google.com/analytics
Overview: Google Analytics 4 is digital analytics reporting software for tracking website and app behavior, campaign performance, and event-driven customer journeys.
-
Key Features
- Event-based website and app analytics
- Conversion and audience reporting
- Attribution and funnel analysis
- Native Google Ads integration
- Explorations and standard reports
- Free and enterprise-tier availability
-
Pros
- Strong native digital analytics capabilities
- Essential for web and app measurement
- Integrates well with Google marketing products
- Free tier is highly accessible
-
Cons
- Not a full business-wide reporting platform
- Cross-functional reporting often requires pairing with another BI tool
- Learning curve can be steep for non-specialists
-
Best For
- Marketing teams, product teams, and businesses focused on web or app analytics
Best-fit recommendations by use case
Best for executive reporting
- FineReport for structured, polished management reporting
- Power BI for Microsoft-based executive dashboards
- Klipfolio for quick KPI scorecards
Best for client reporting
- Tableau for strong visual presentation
- Looker Studio for lightweight shared reports
- FineReport for organizations needing more formal, controlled report formatting
Best for operational analytics
- Domo for cross-functional operational monitoring
- Power BI for broad business reporting
- Qlik Sense for complex operational analysis
Best for finance reporting
- FineReport for formatted, recurring reports with stronger control
- Power BI for finance teams already standardized on Microsoft
- Looker for governed definitions across the business
Best for cross-functional visibility
- Looker for metric consistency
- FineReport for governed reporting across departments
- Sigma for warehouse-centric collaboration
How to choose the right analytics reporting software for your business
Questions to ask before you buy
Before evaluating demos, align on the business problem first. Ask these questions:
1. Who will build reports, and who will consume them?
A tool that works for analysts may frustrate business users, and vice versa.
2. Which systems need to be connected?
List your required sources:
- CRM
- ERP
- Ad platforms
- Finance systems
- Cloud warehouse
- Databases
- Spreadsheets
3. Do you need dashboards, formatted reports, or both?
Some tools are far better at interactive dashboards than structured recurring reports.
4. How strict are your security and governance requirements?
Highly regulated teams should prioritize permissioning, auditability, and deployment control early.
5. What implementation resources do you actually have?
If your team lacks technical bandwidth, avoid platforms that depend on heavy modeling or extensive admin work unless the long-term payoff is clear.
6. How often are reports delivered?
Daily operational alerts, weekly department packs, and monthly board reporting all place different demands on automation.
Common mistakes to avoid
Overbuying
Many companies buy enterprise BI platforms when they only need cross-source dashboards and scheduled reporting.
Underestimating governance
The opposite mistake is choosing a lightweight tool that works for one team but breaks once multiple teams need shared definitions and access rules.
Ignoring adoption
The best analytics reporting software is the one your teams will actually use consistently. If report creation is too technical or too slow, adoption drops.
Choosing based only on dashboards
A beautiful dashboard does not guarantee reliable reporting workflows. Evaluate scheduled delivery, version control, formatting, permissions, and consistency.
A simple shortlist framework
Use this four-step framework to narrow your options quickly.
Step 1: Define must-have capabilities
Identify non-negotiables such as:
- Scheduled reporting
- Specific connectors
- On-premises deployment
- Row-level security
- AI assistance
- Pixel-perfect formatting
Step 2: Set a realistic budget range
Include:
- License costs
- Admin overhead
- Implementation support
- Scaling costs for more users or more data
Step 3: Match tools to team skills
- If your users are mostly business stakeholders, favor usability.
- If you have a mature BI team, prioritize governance and flexibility.
- If you run a warehouse-first stack, shortlist warehouse-native tools.
Step 4: Check future scalability
Choose a platform that fits current needs but will not force a rebuild in 12 to 24 months.
A practical shortlist for most buyers will end up looking something like this:
- FineReport if you need governed, flexible, enterprise-ready reporting
- Power BI if you are Microsoft-centric and want strong value
- Tableau if visual analytics is the priority
- Looker if metric governance is the top requirement
- Zoho Analytics or Metabase if budget and speed matter most
Final recommendations and next steps
If you are comparing analytics reporting software in 2026, the strongest overall choices depend on reporting maturity more than brand recognition.
- FineReport is the strongest overall pick for organizations that need formal reporting, automation, and enterprise governance in one platform.
- Power BI is the most practical option for many Microsoft-based teams.
- Tableau remains a top choice for visual analytics and interactive exploration.
- Looker is one of the best fits for governed, warehouse-centric metric consistency.
- Metabase and Zoho Analytics are smart choices for smaller teams that need faster deployment and lower cost.
The best next step is simple:
- Build a shortlist of three tools
- Request demos focused on your actual reporting workflow
- Test one real use case, such as a weekly executive report or monthly cross-functional performance pack
- Compare setup time, usability, governance, and delivery quality before committing
If your business needs more than dashboarding and you want a reporting-first platform that can scale across teams, FineReport should be at the top of your shortlist.

FAQs
Analytics reporting software helps teams combine data from multiple sources, automate report refreshes, and deliver dashboards or recurring reports that support decisions. It is mainly used to reduce manual reporting work and keep stakeholders aligned on trusted metrics.